Concept explainer: Why YOU need AIOps ►
Watch the following video to learn the many reasons that you need AIOps.
Why you need AIOps: What are the typical areas of improvement Ops teams are concerned about?
One is cost.
Are you reducing the number of actionable tickets? Are you reducing the configuration errors?
And how about service quality.
Are you reducing the number of incidents that cause business impact? Are you reducing the duration of those incidents happening?
And change velocity.
Is your IT system agile enough to change with the market demands?
In most cases, the answers to these questions aren’t positive. Why is that?
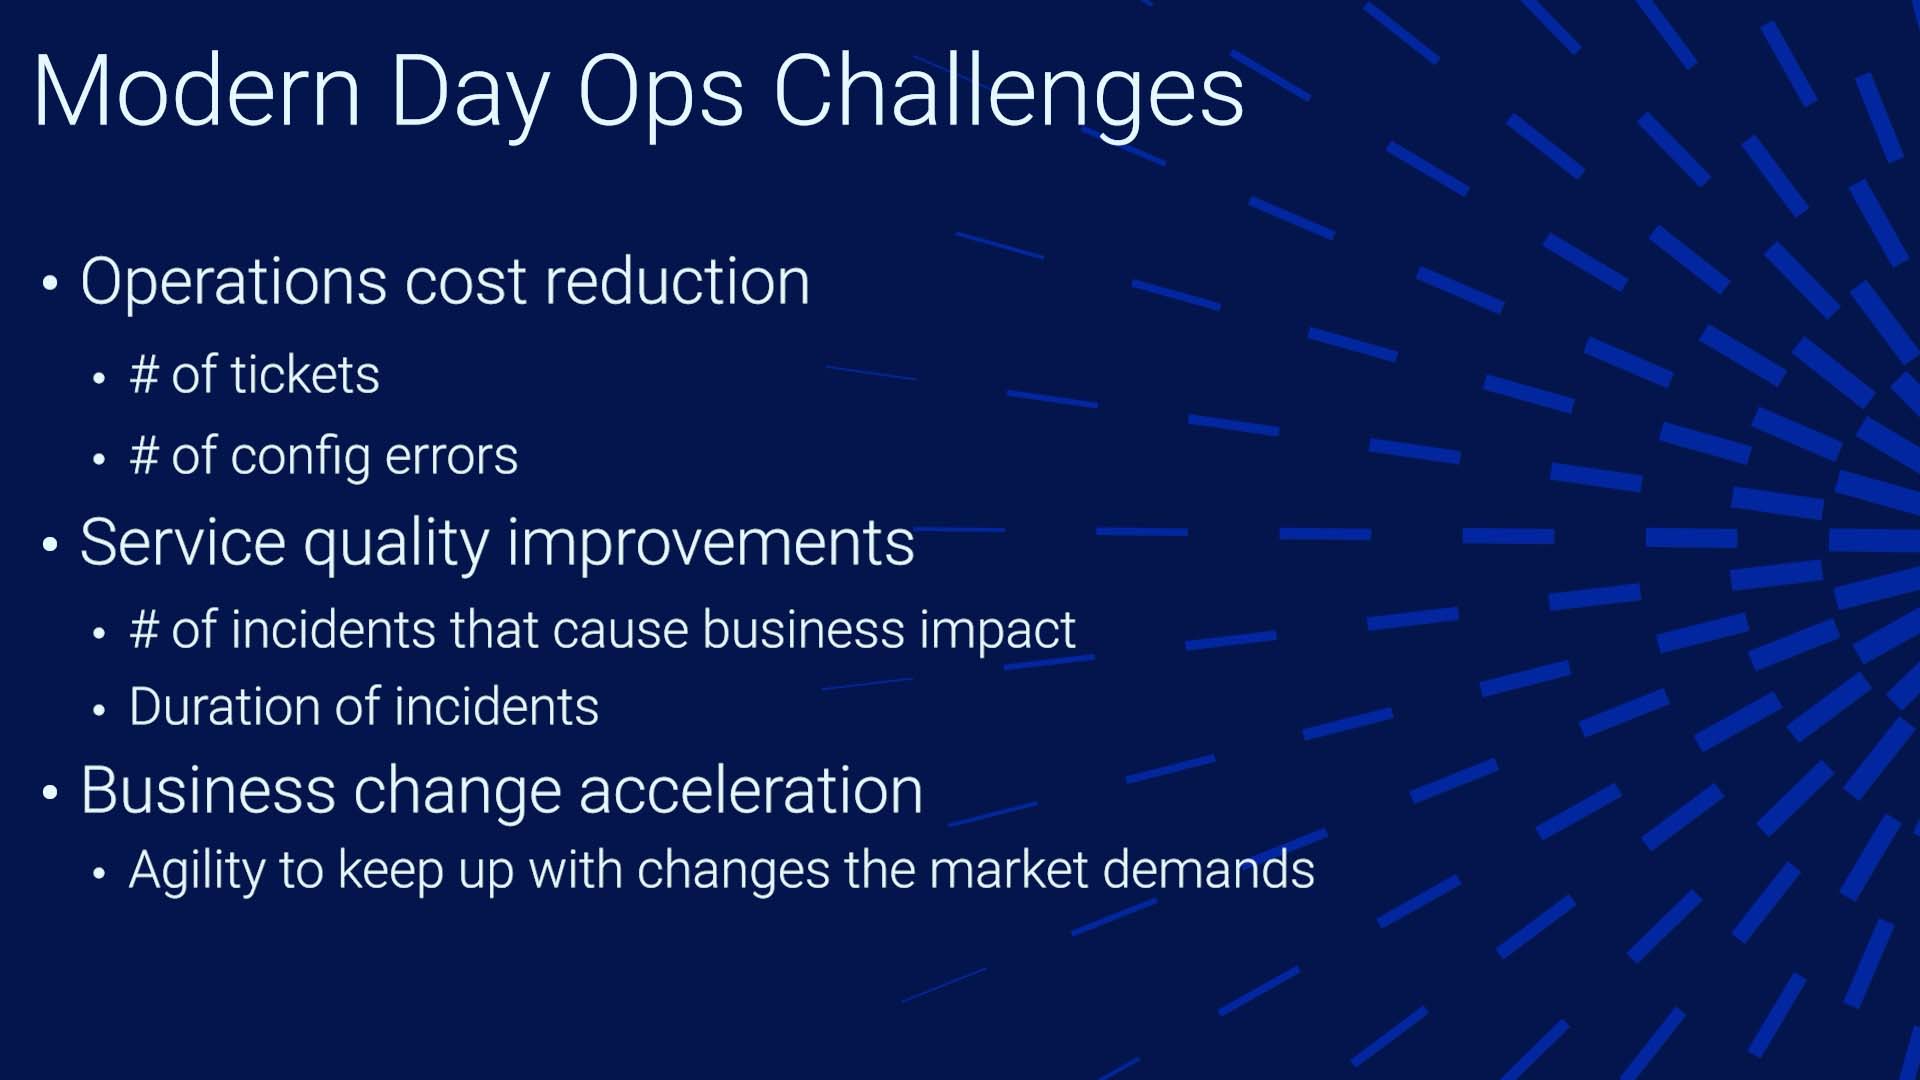
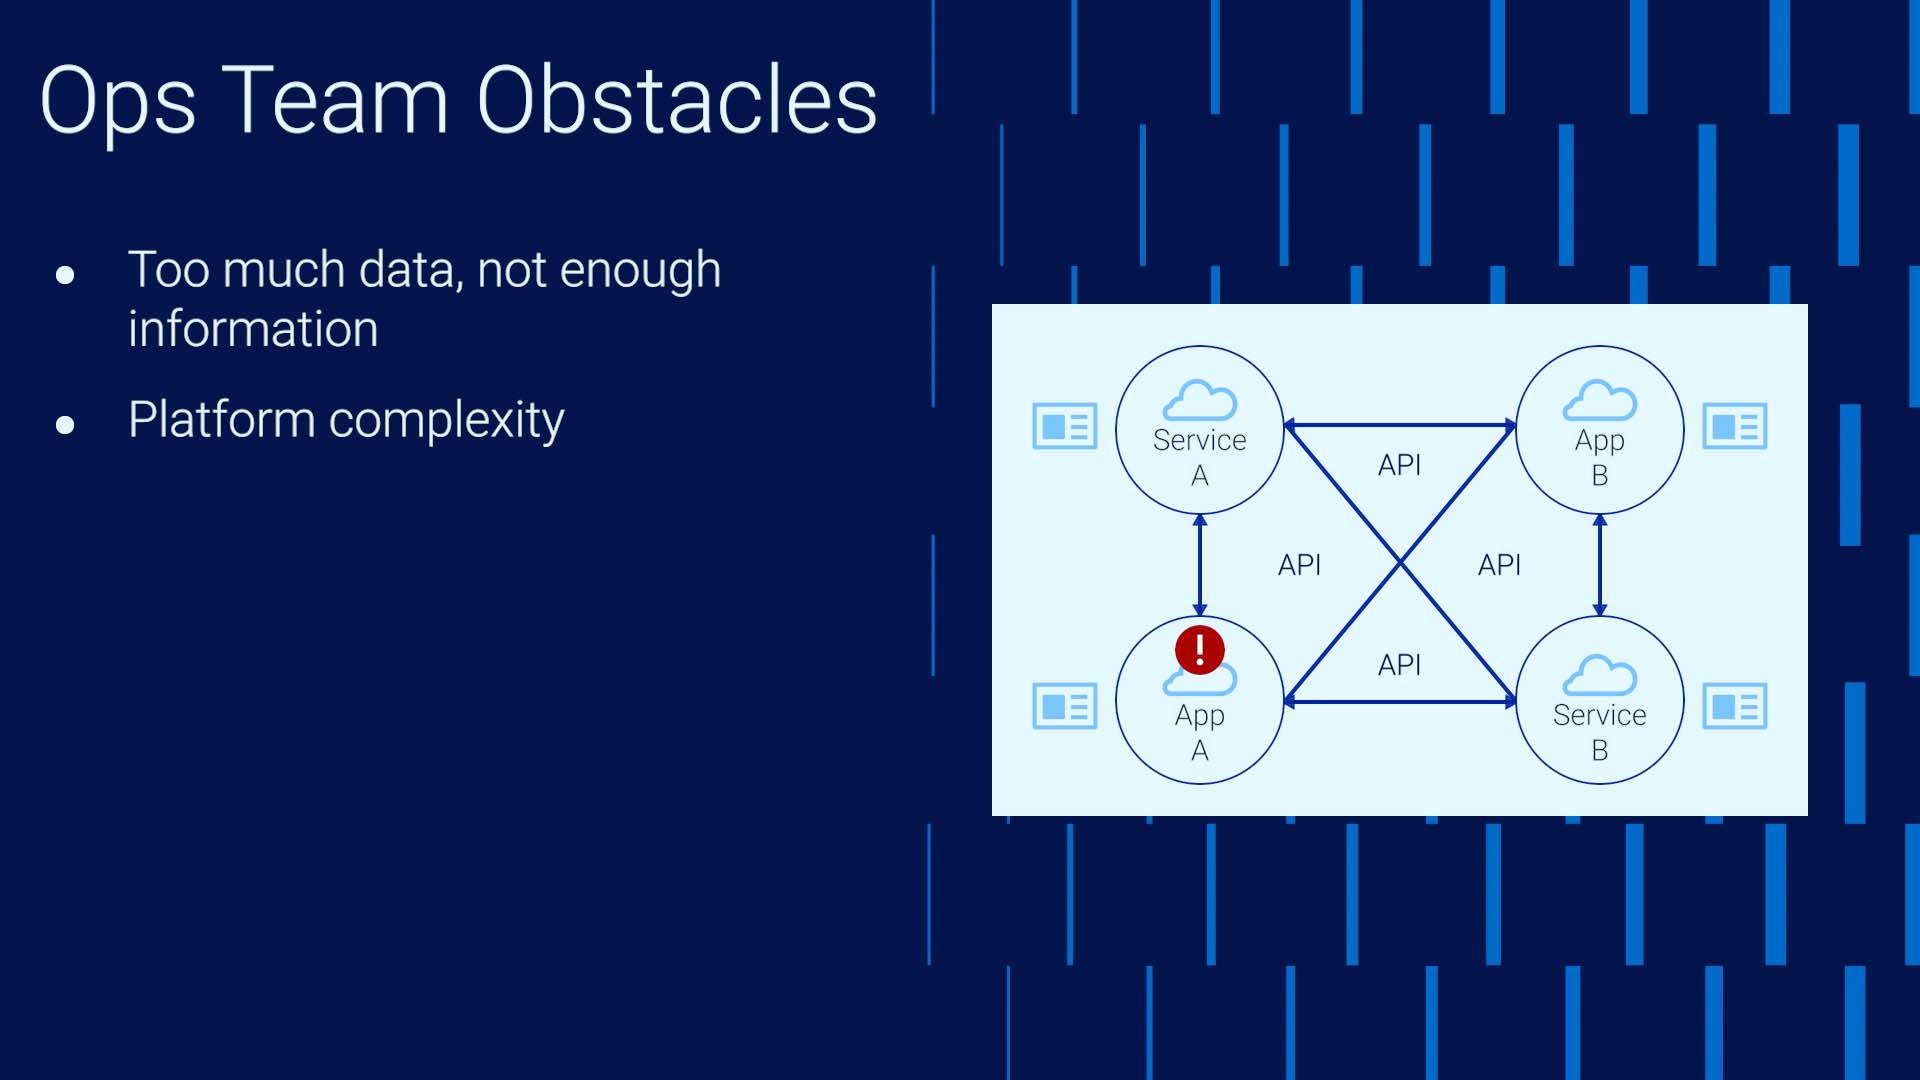
To keep things relatively simple, let’s say your org has two applications. Application A is run by the DevOps team, with one data center somewhere running a Kubernetes cluster, with virtualized computers, virtualized storage, and maybe some kind of virtualized networking.
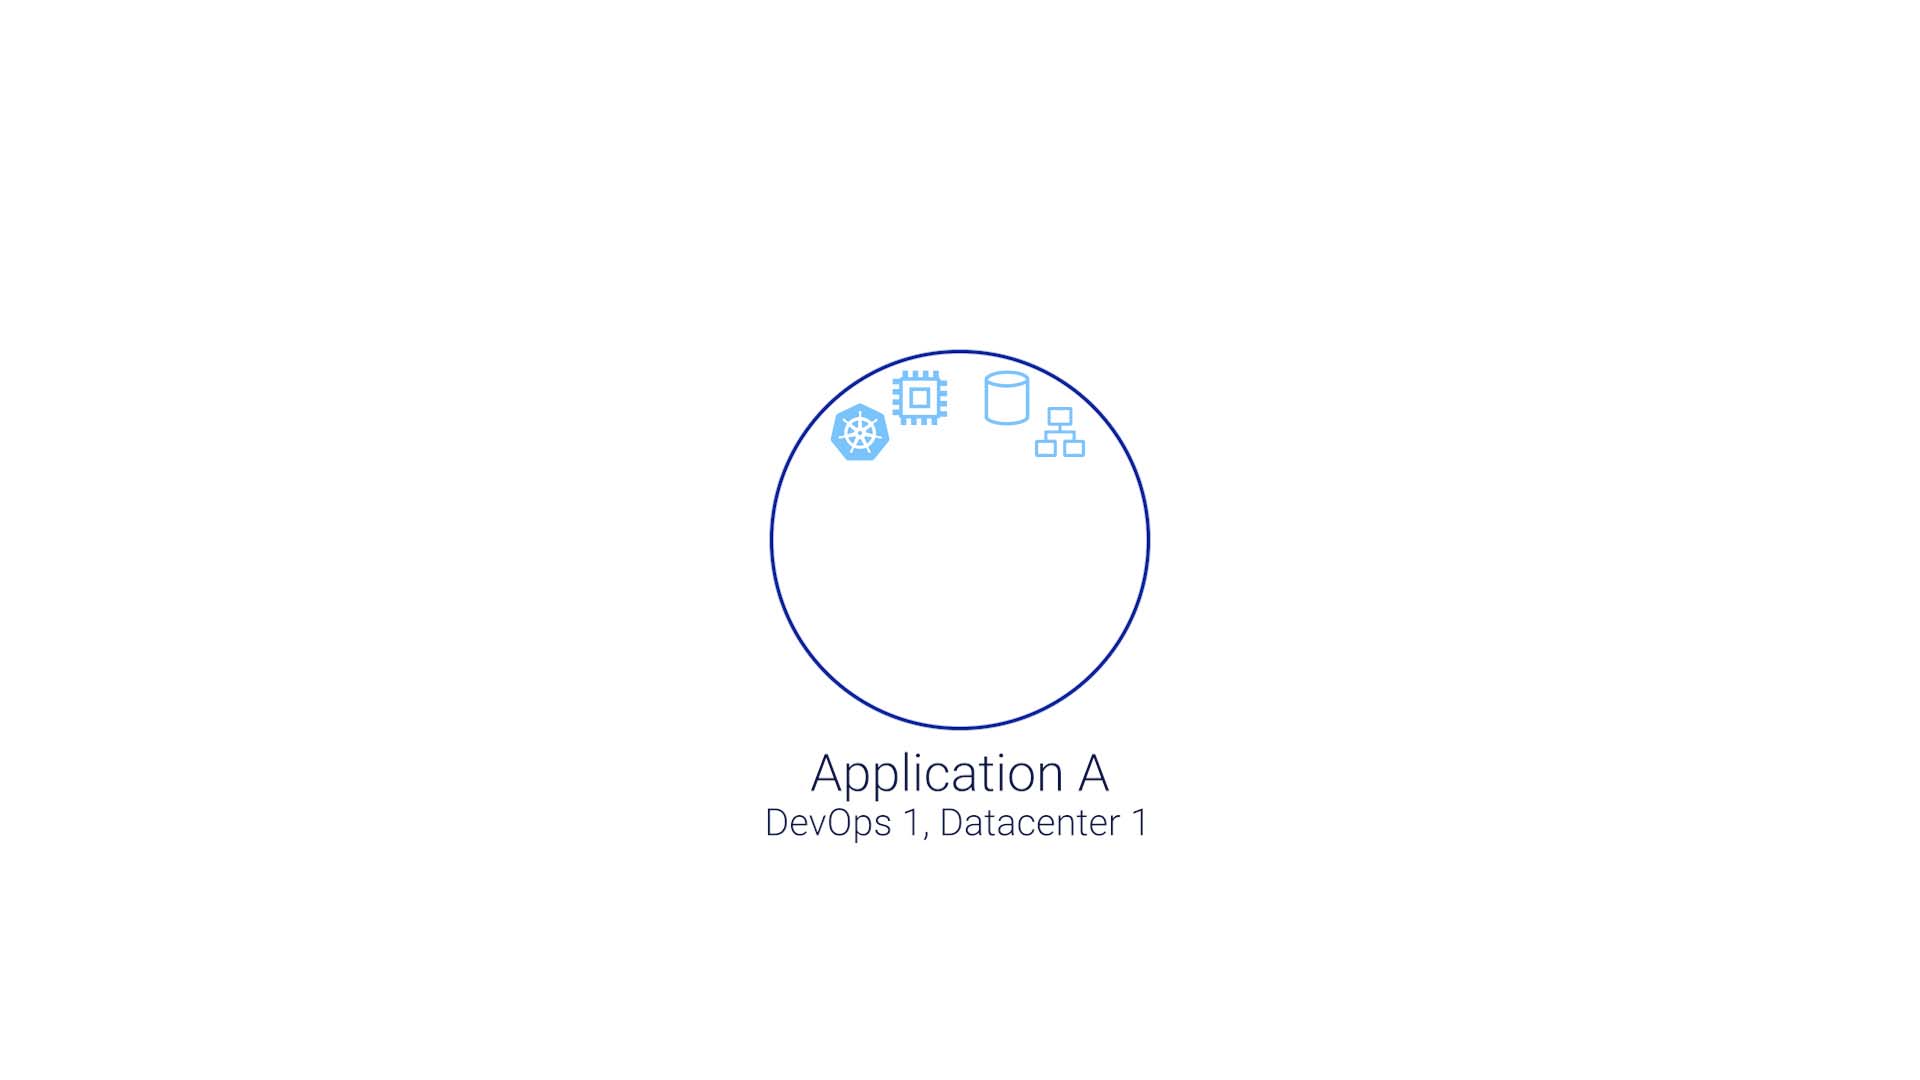
Application B is run the same way, but by a different team, in a different location, with their own data center or in a cloud somewhere.
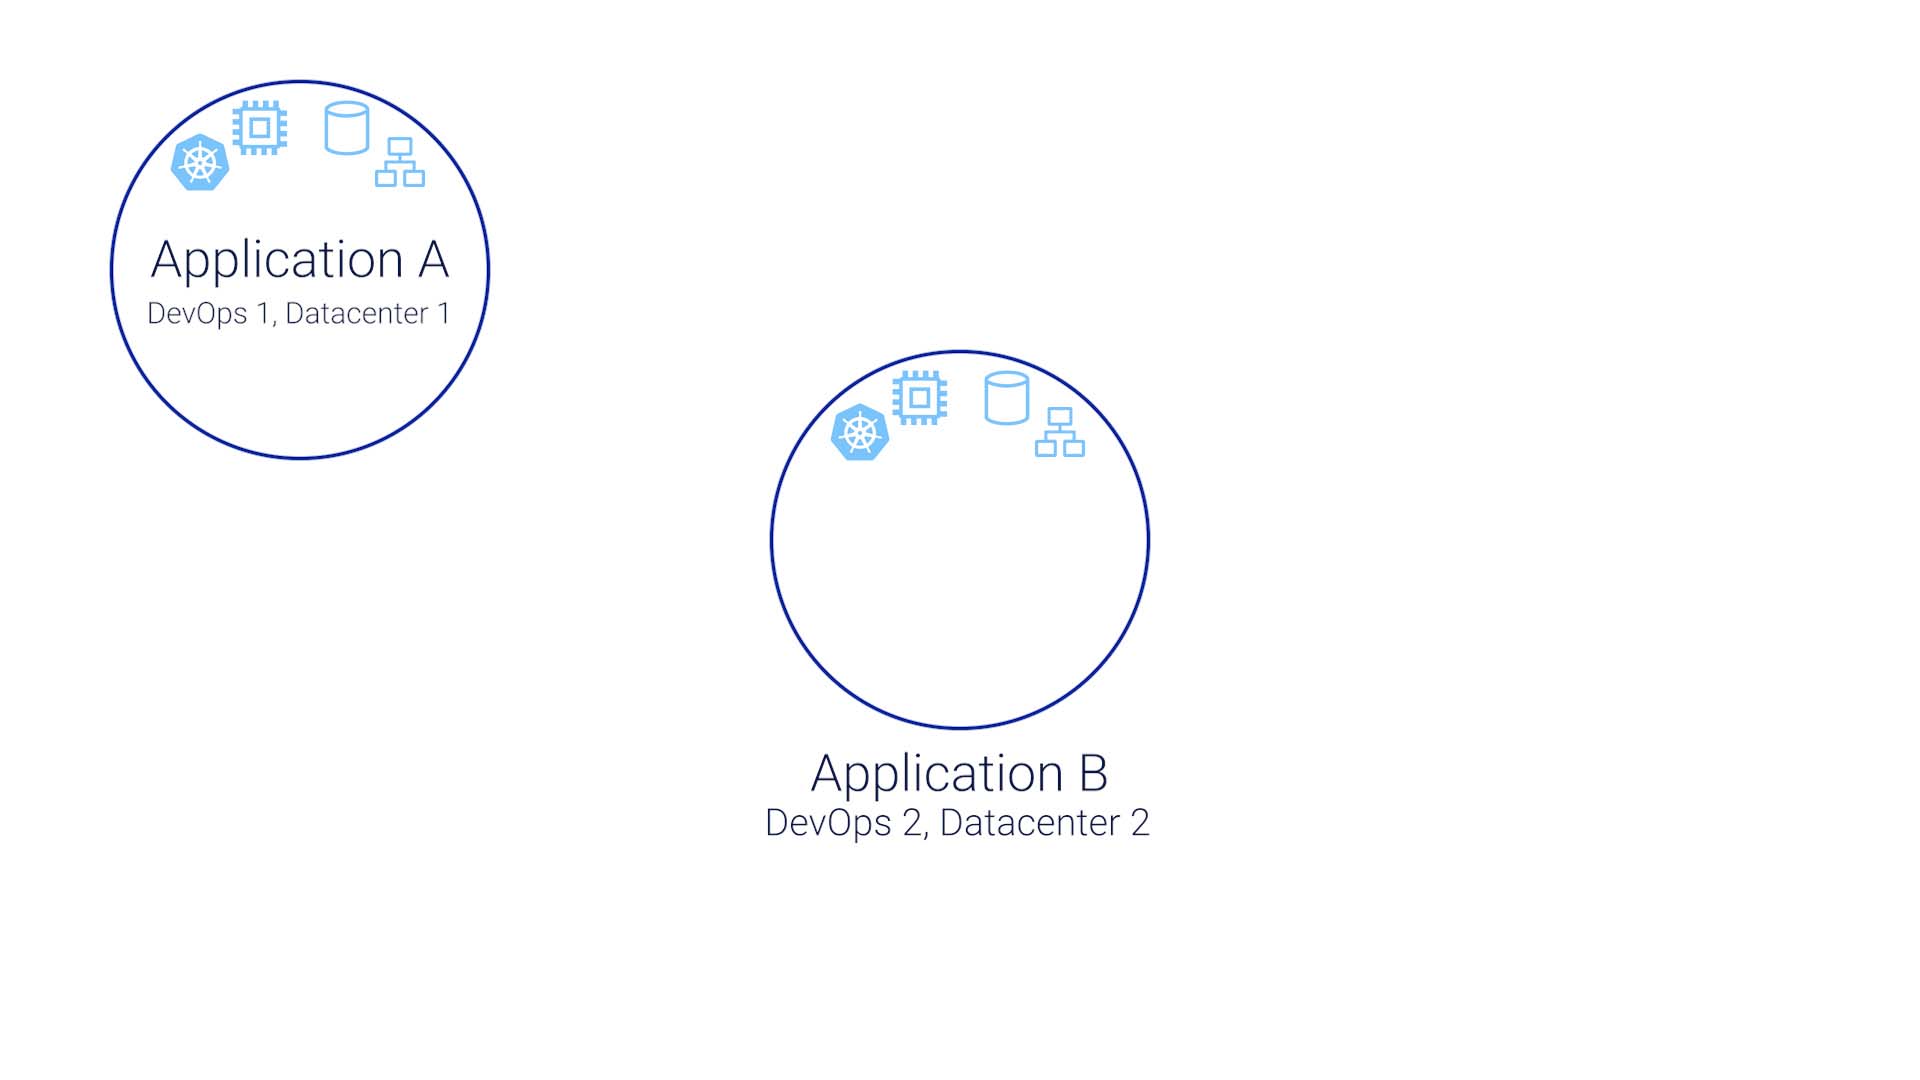
The two applications communicate via APIs, and don’t really know each other at all.

Then here’s an SDWAN that this business is connected by, and it is also running on somebody's data center somewhere.
The end user side is equally complex, too. Let's say they are running a fiber via transit Internet back to our own data center.
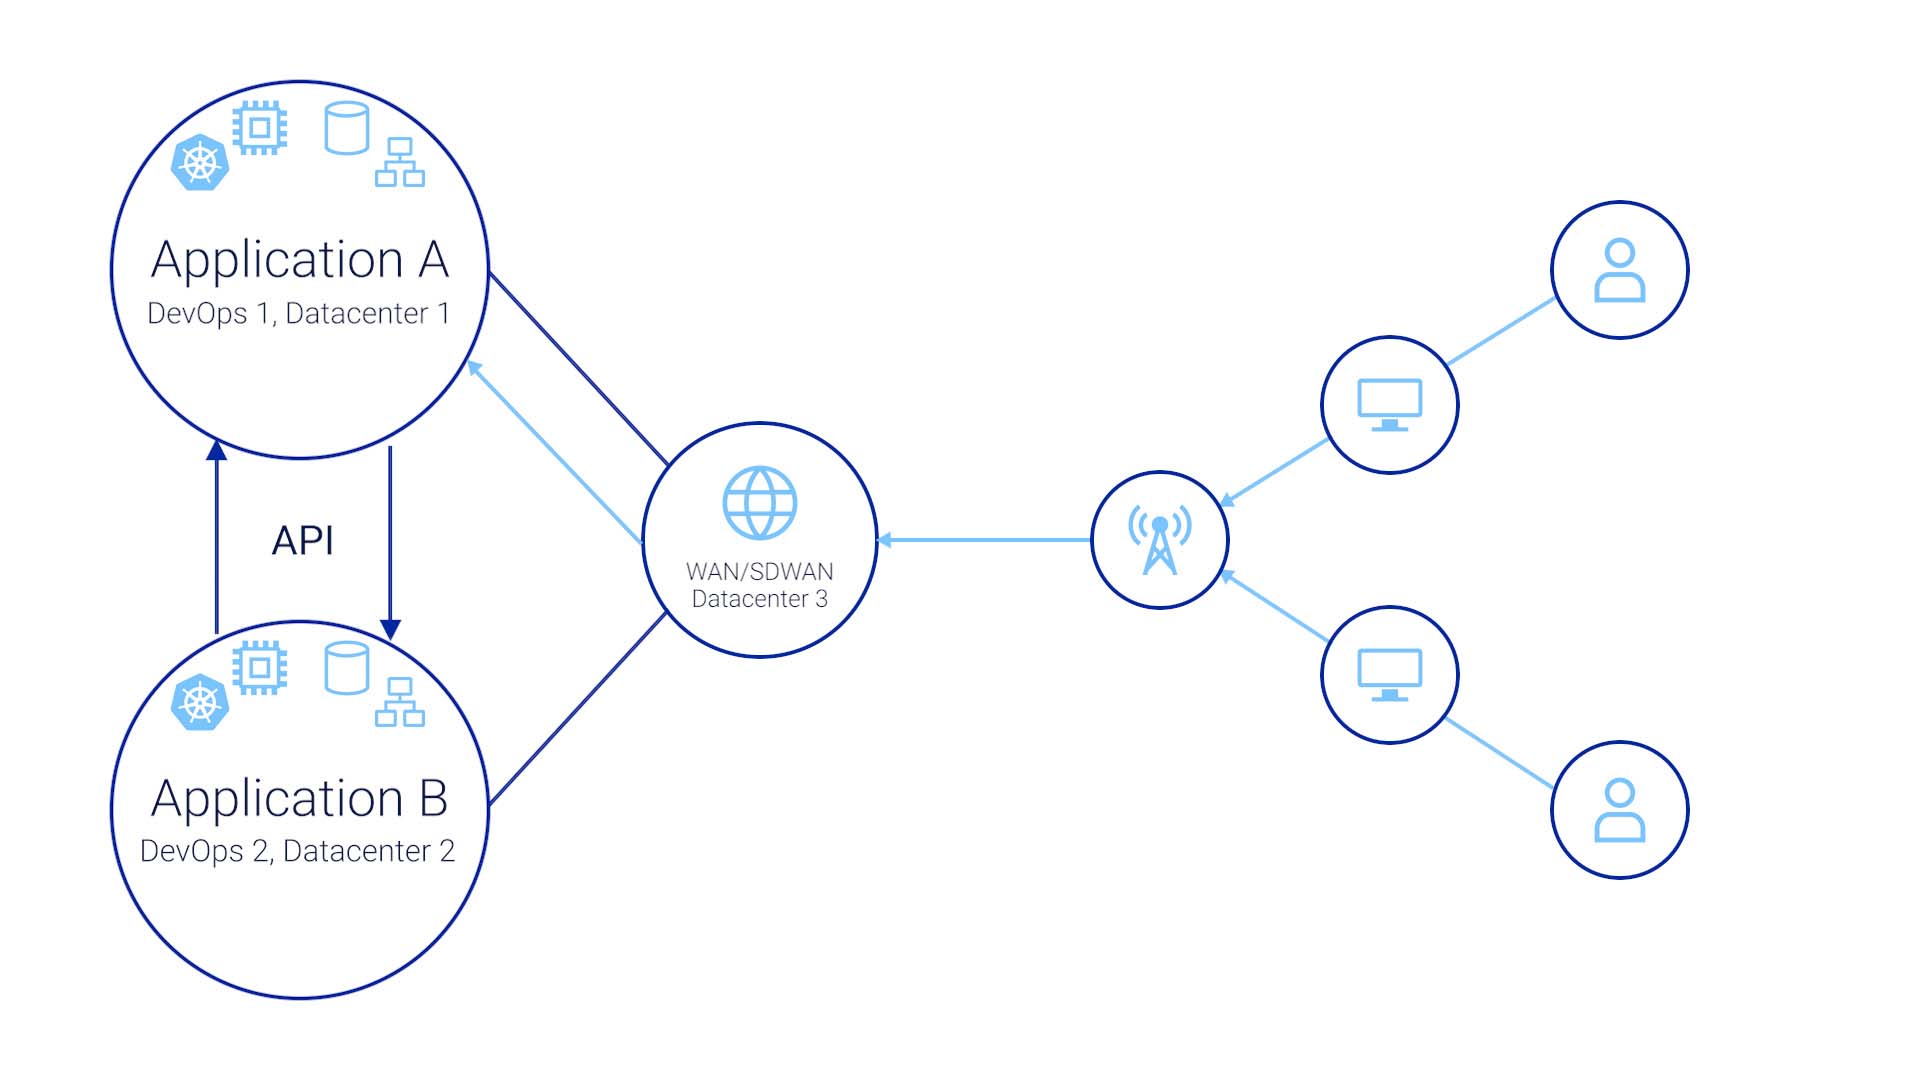
You are an Ops staff member here, responsible for keeping application A going. You just made a configuration change to a load balancer and accidentally introduced an error. That error may have been detected by a monitoring system, but with so much data coming in from our network, the alert was buried in the noise and you didn’t see it. Or it is entirely possible that the symptoms of the error did not go outside of the bounds of the outdated health rules.
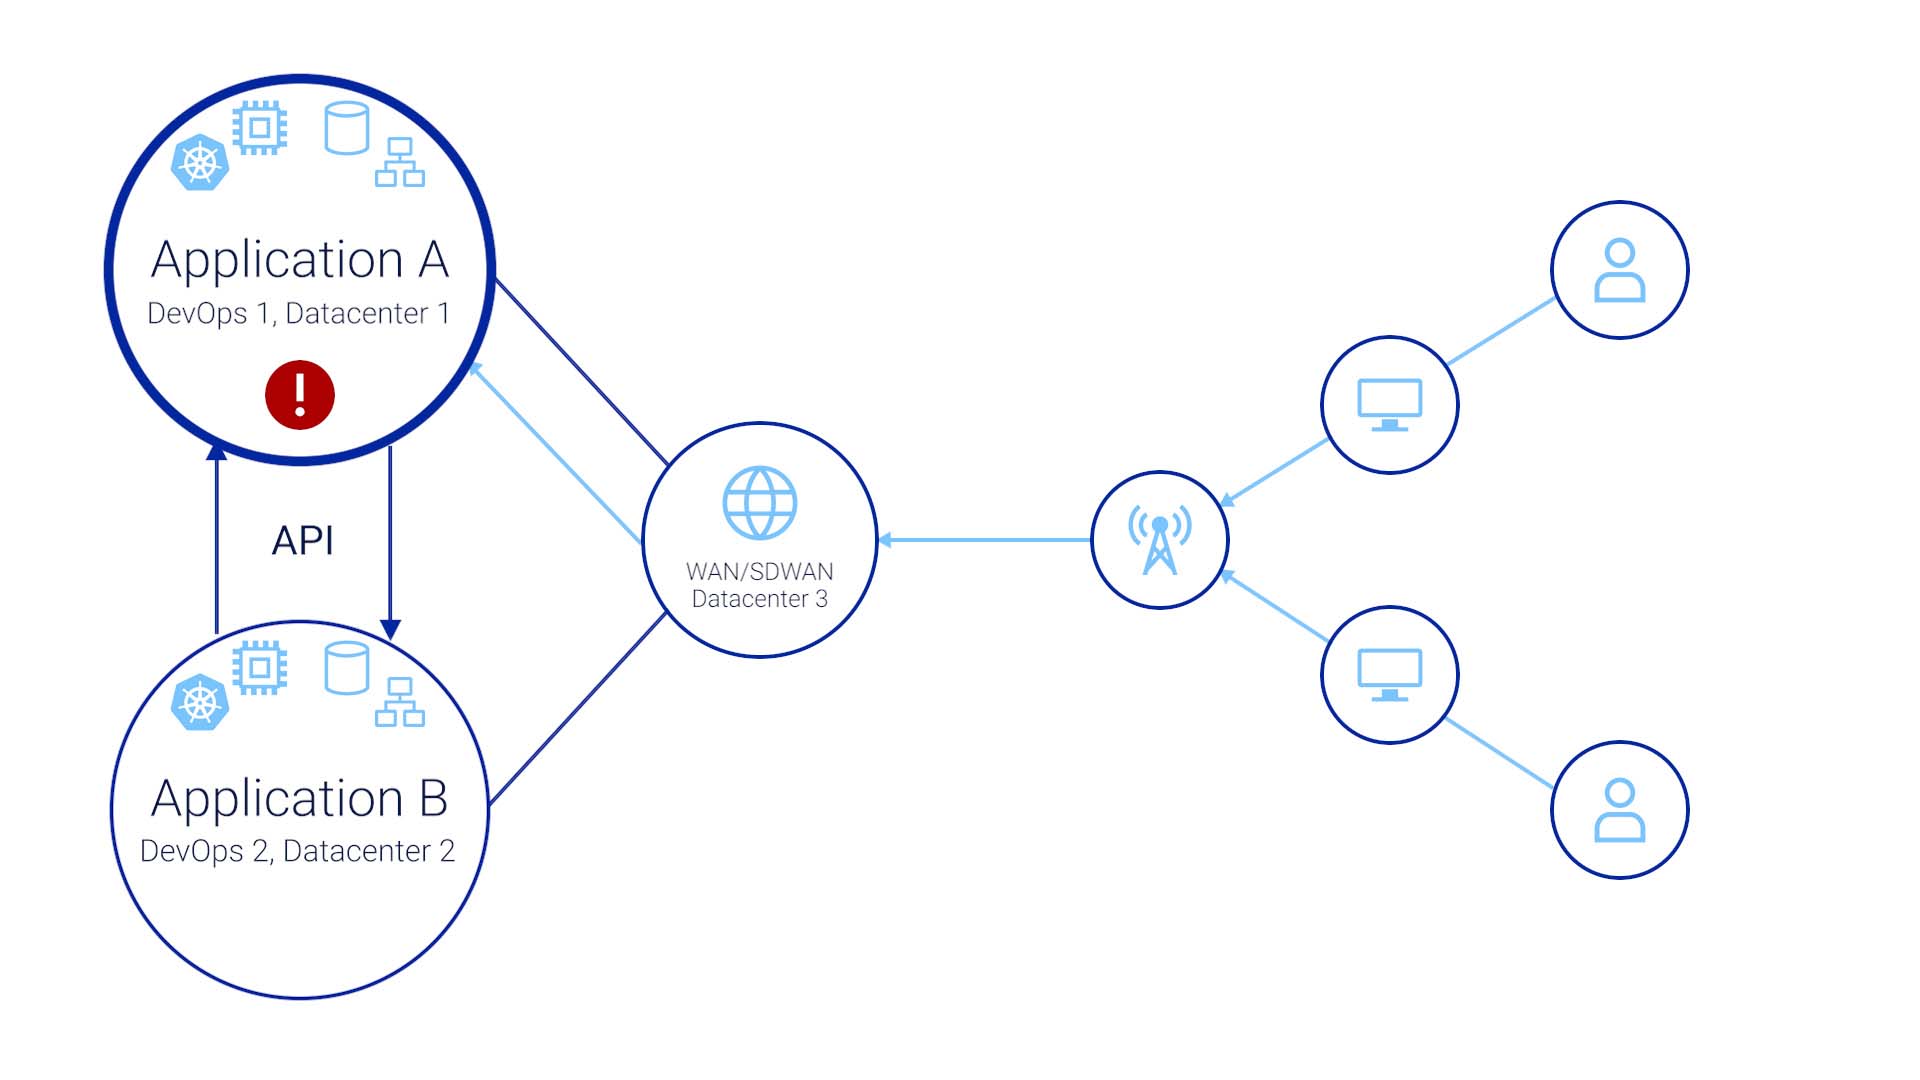
A few days later, the end users of both applications are calling our support lines to report the issue. The problem is, they aren’t saying, “hey, the load balancer for application A is not load-balancing!”
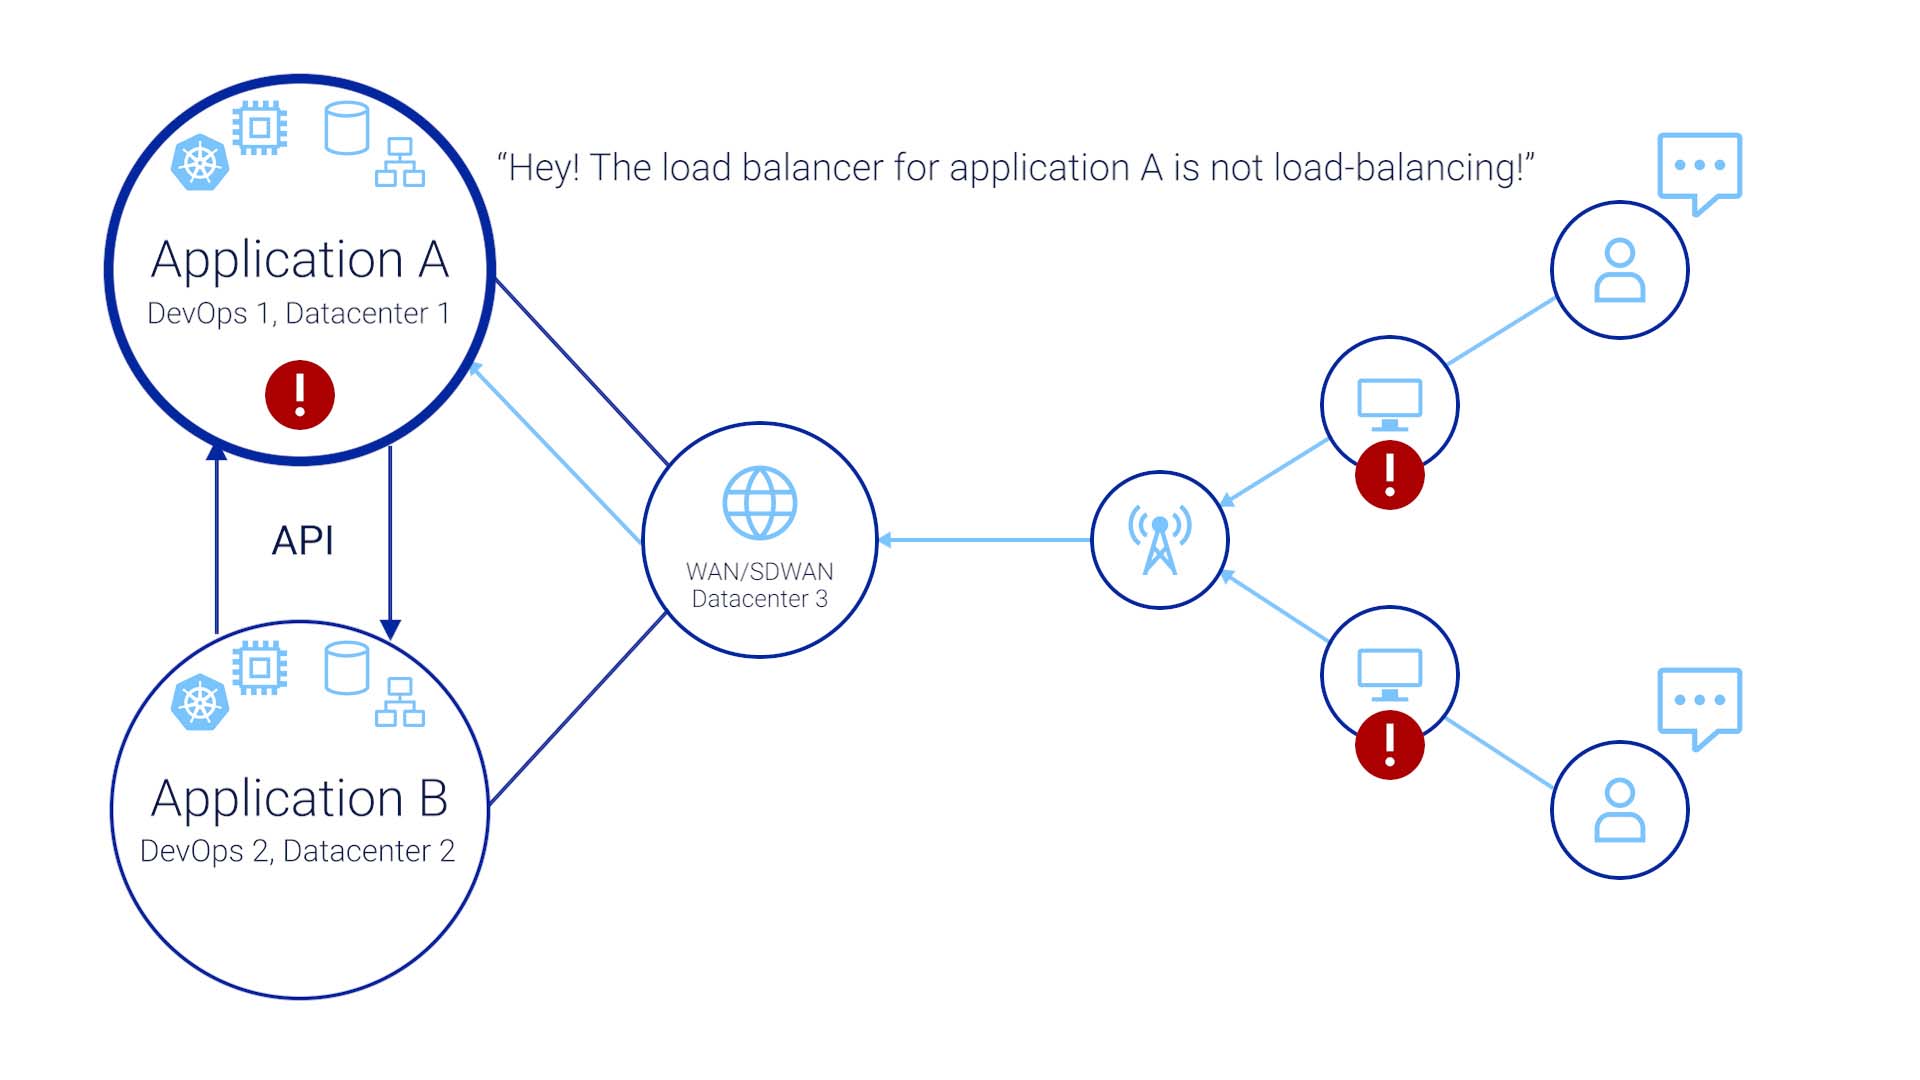
Or, “Application B is not getting a response from Application A when it makes an API call!”
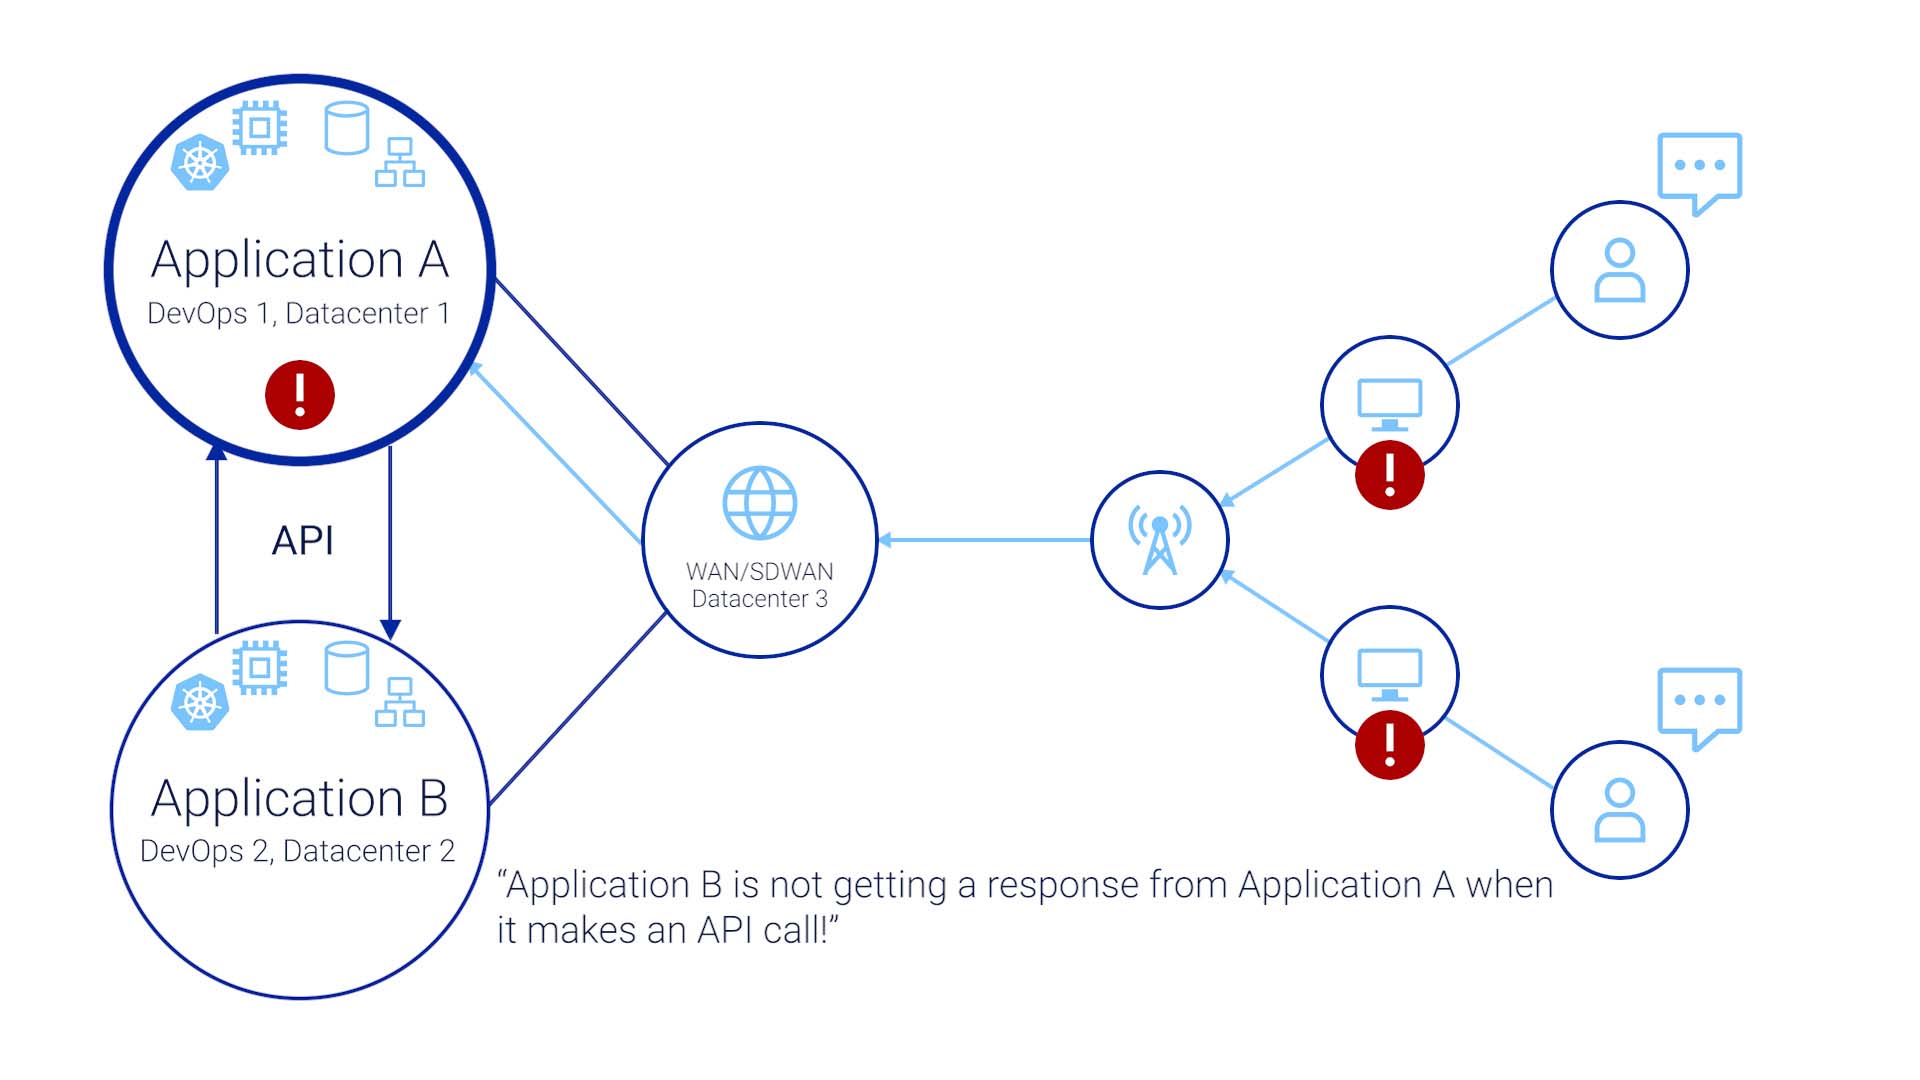
The issue manifesting in the end user’s world is something like, “my order management system is not responding!”
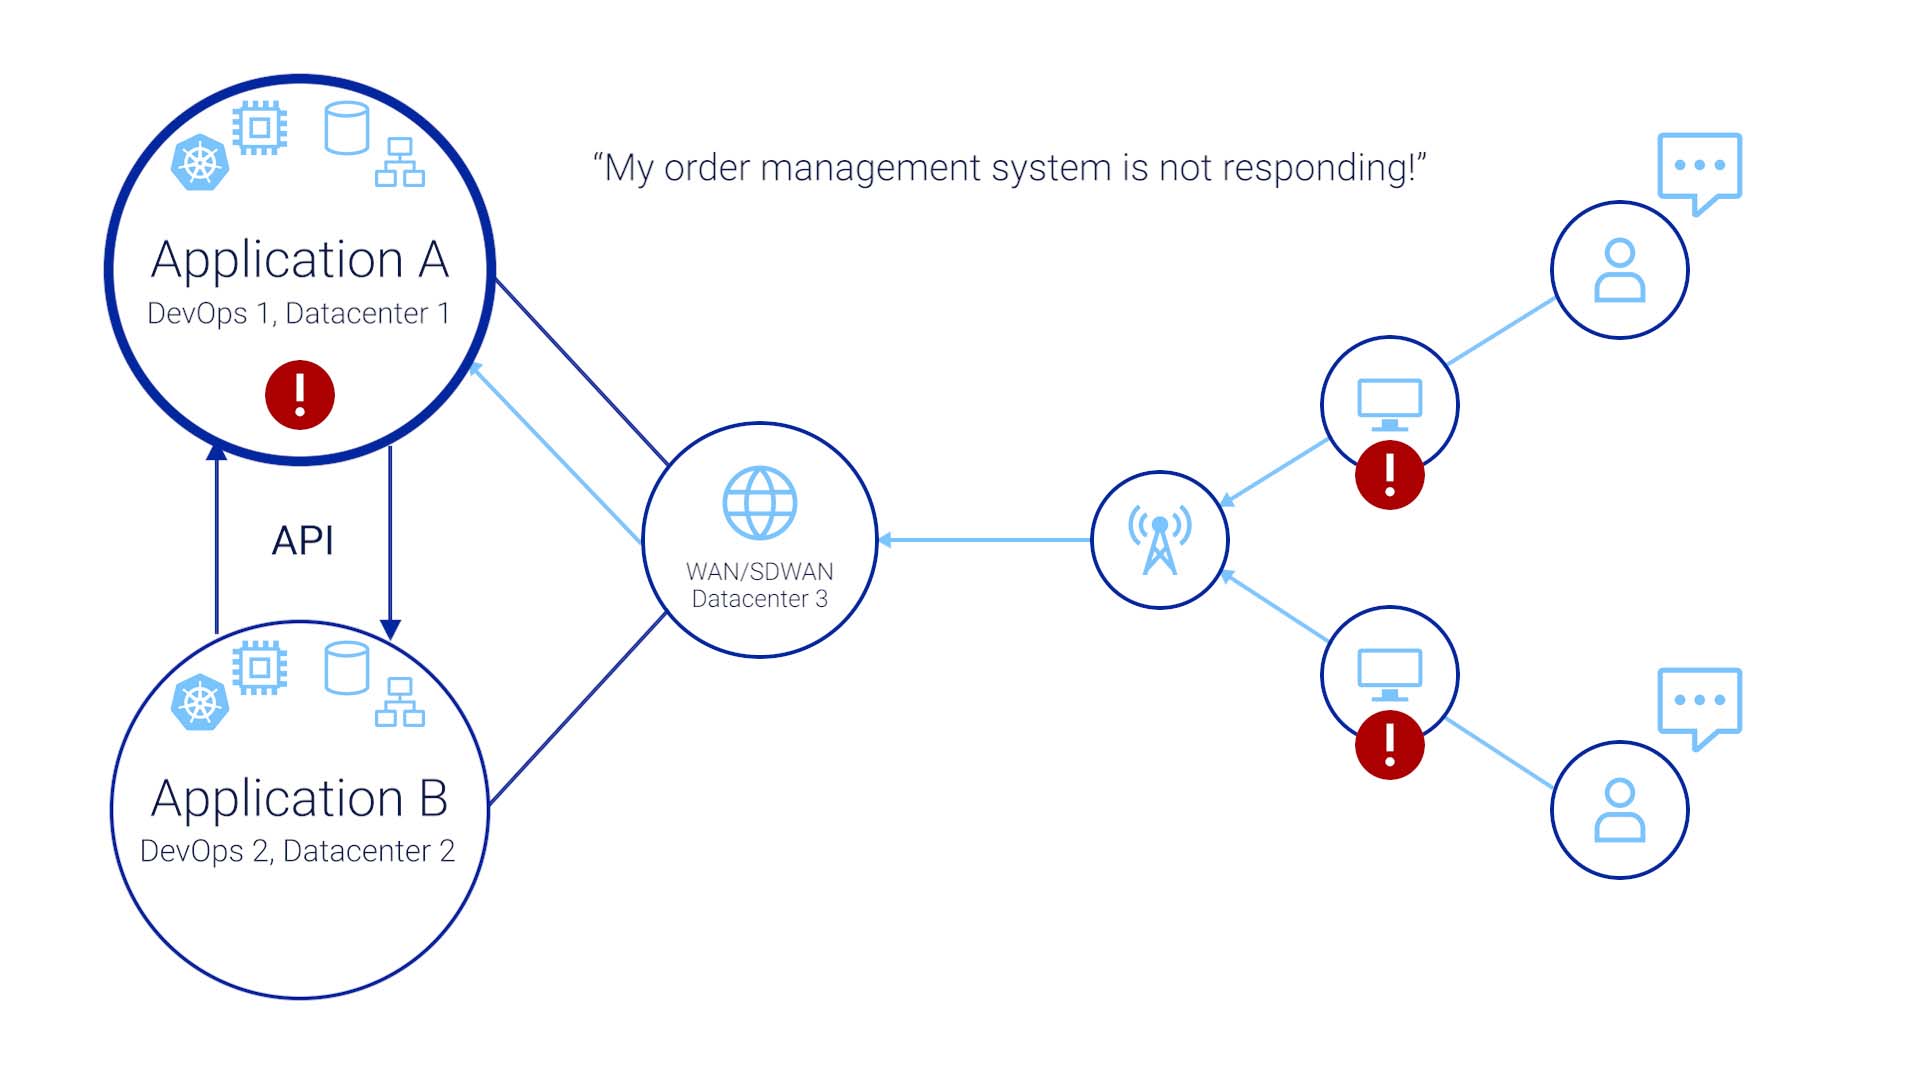
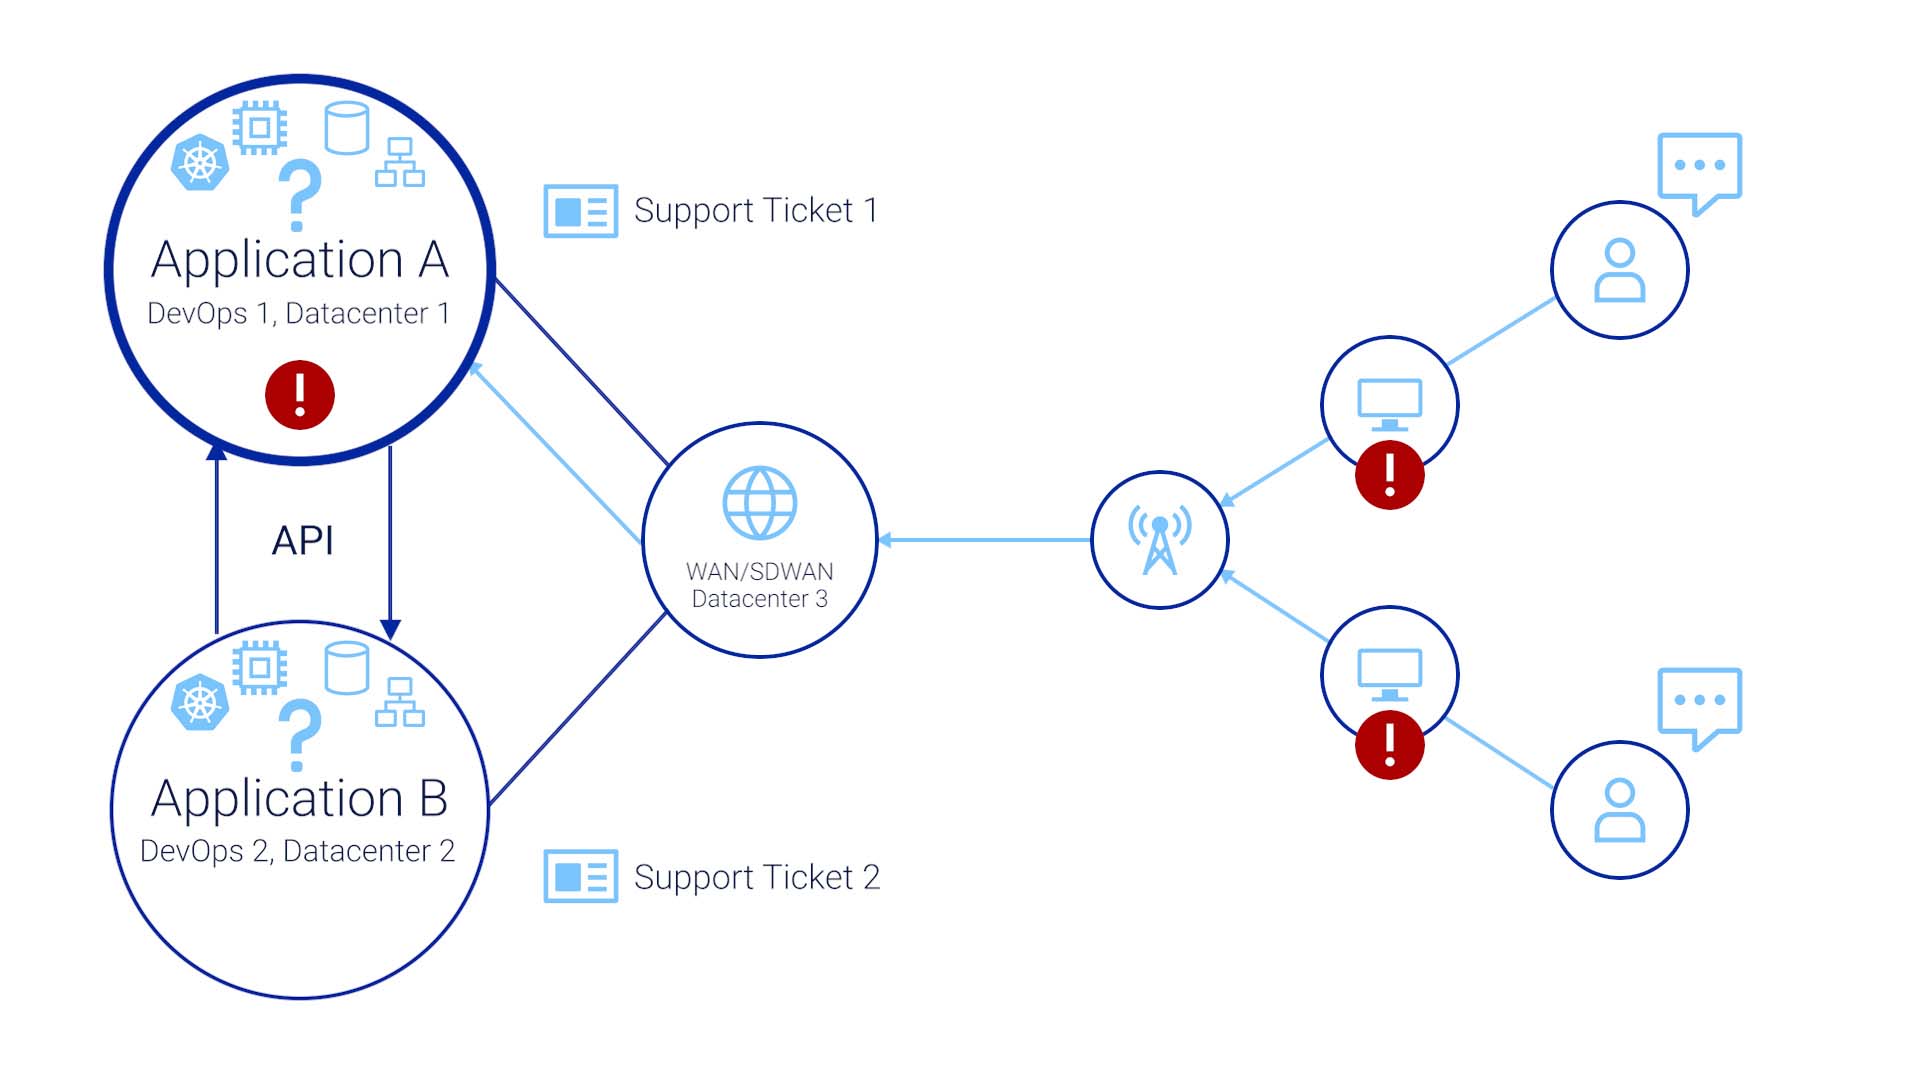
So users create a ticket with the app team that supports application A, and a separate ticket for application B.

The problems are acknowledged, but the application A and B teams don’t know about the ticket the other team has received.
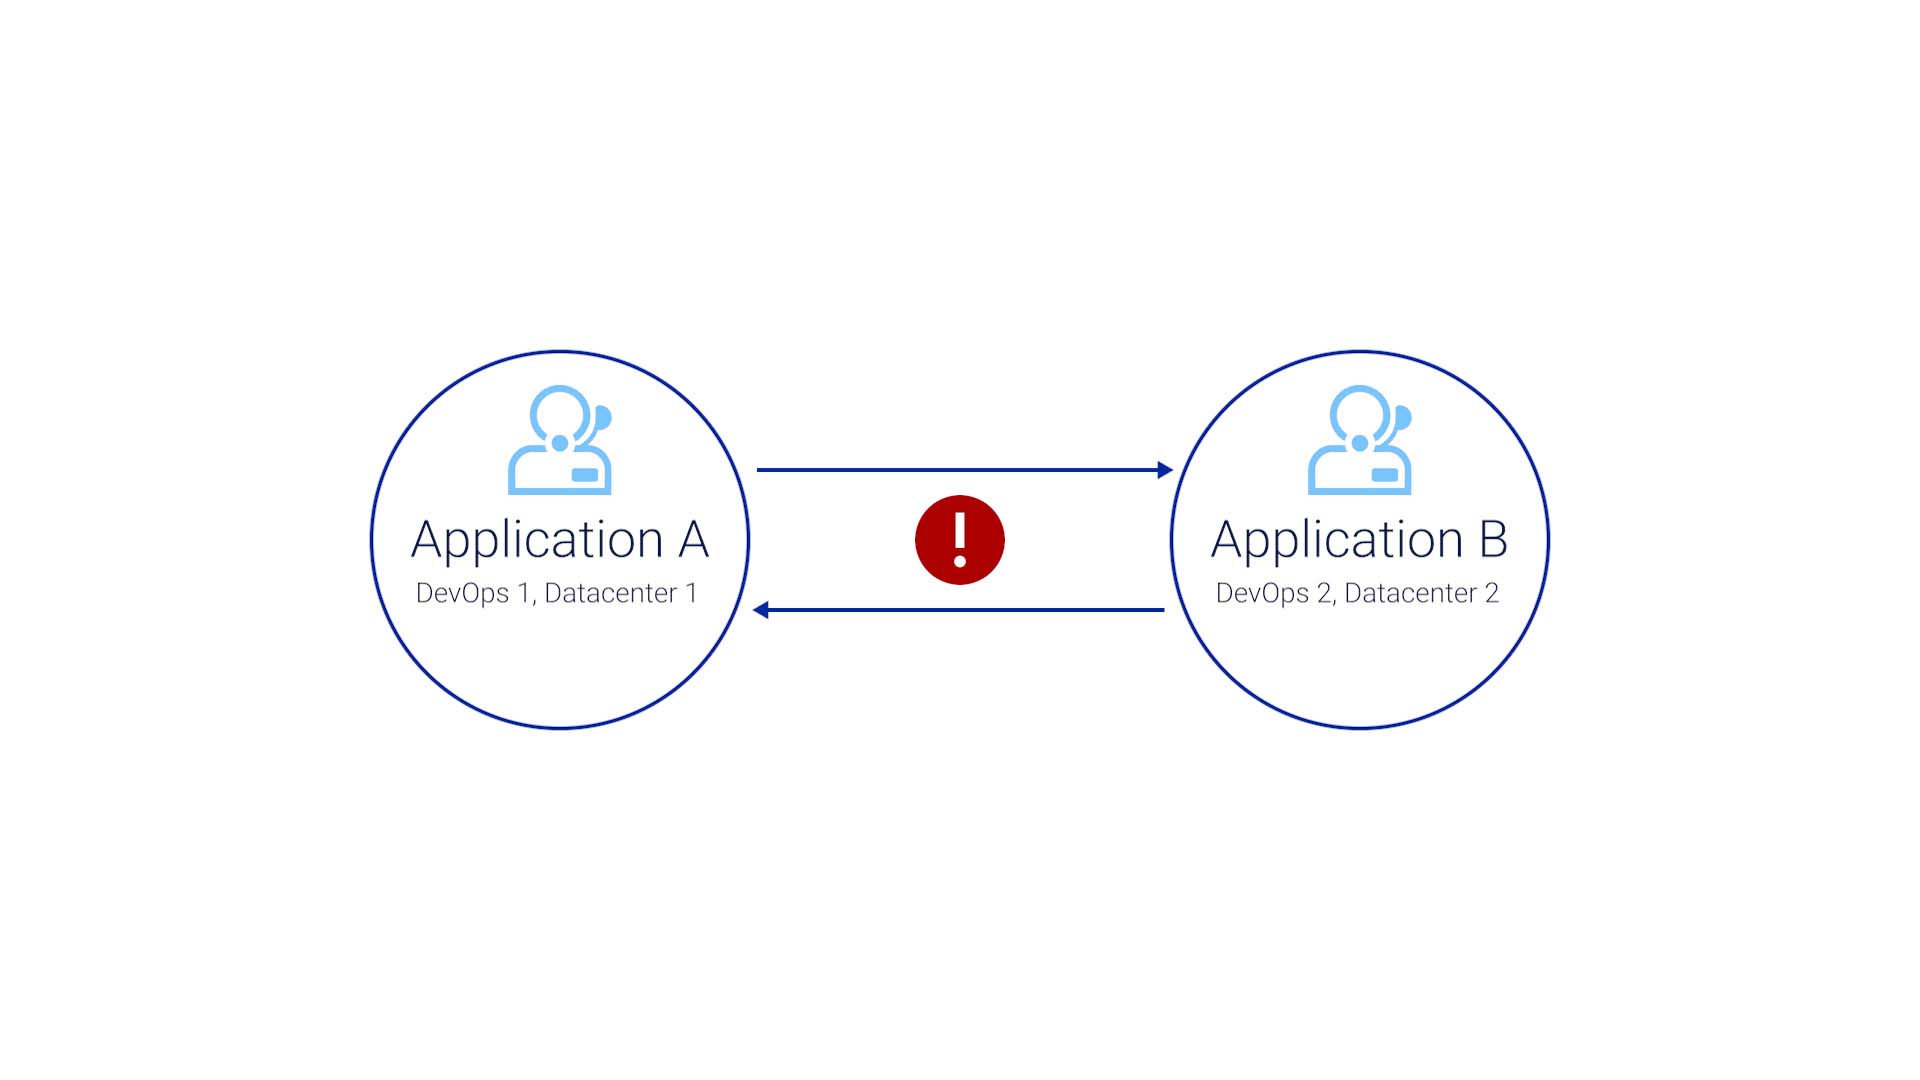
When the issue stays unaddressed and becomes a Sev1 incident, the two teams finally talk to each other in a war room.
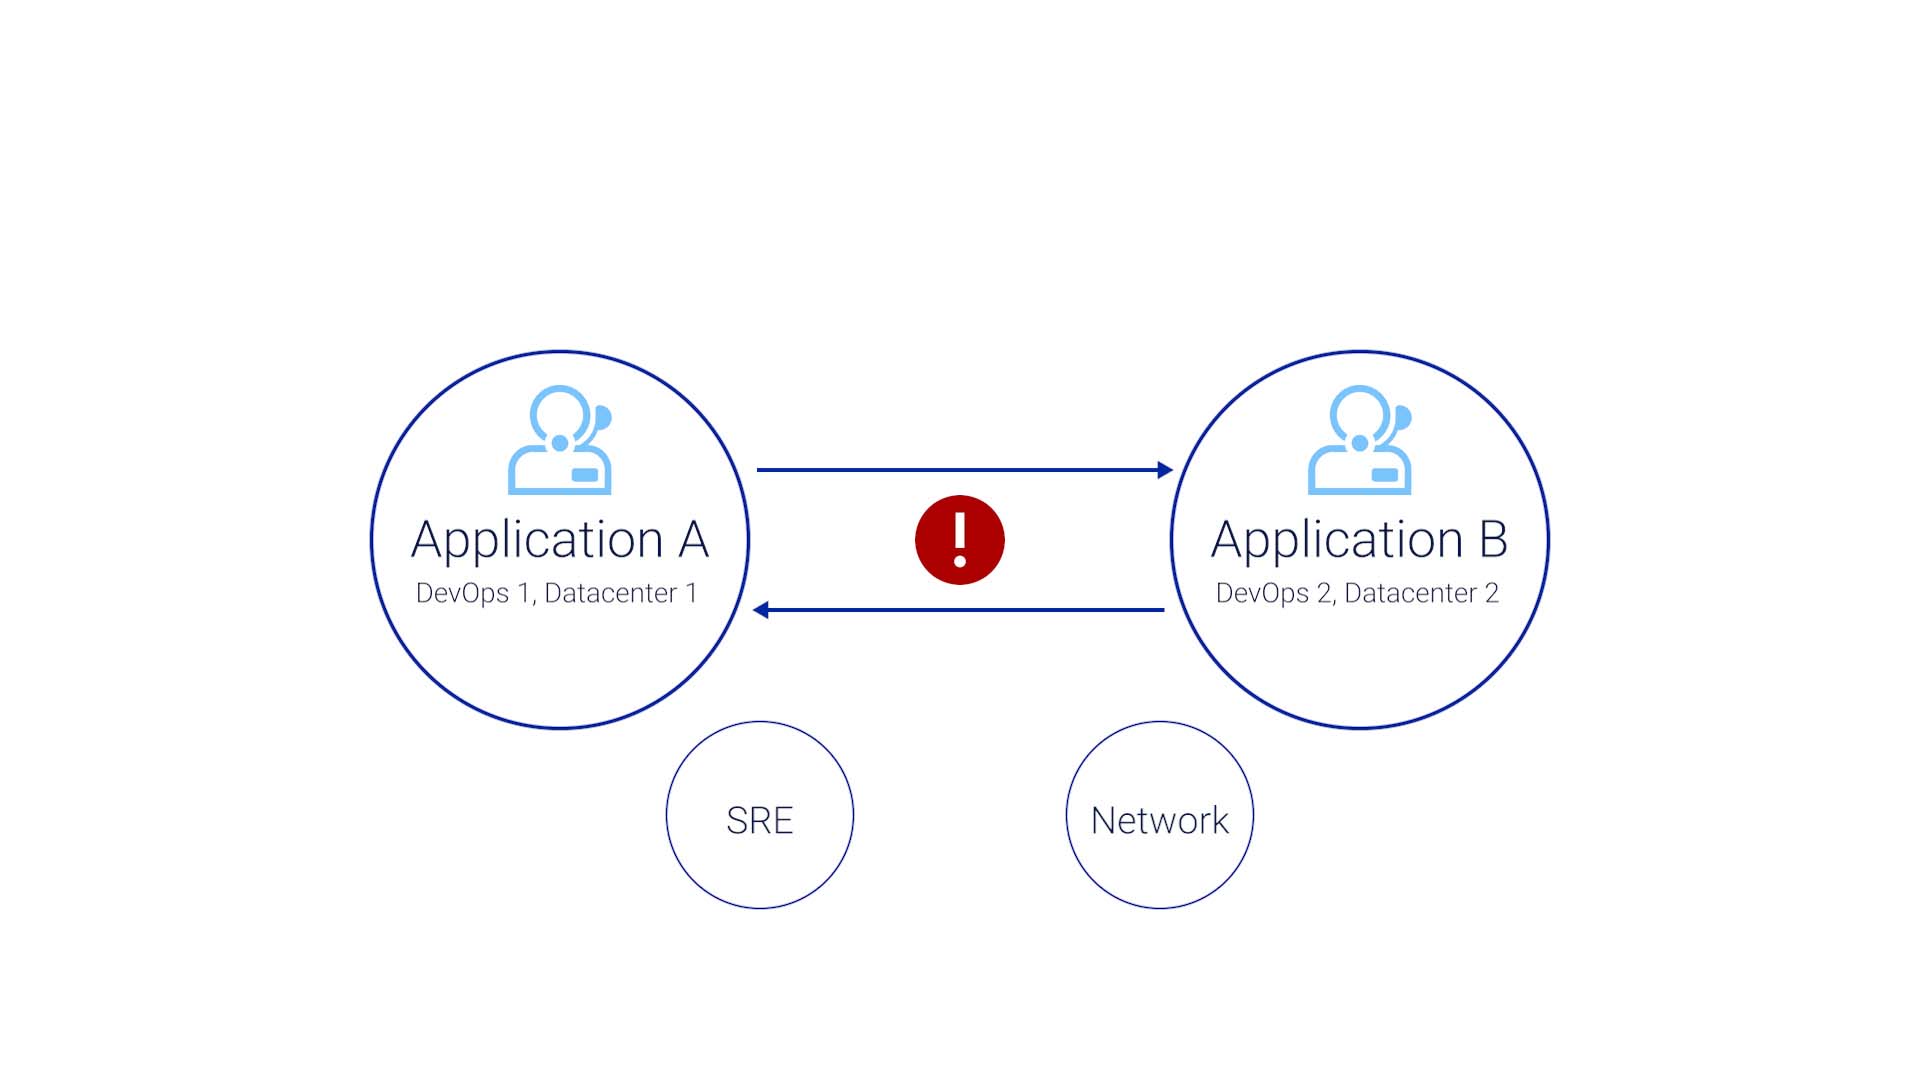
Eventually, they identify that the issue is outside of the application, and they bring in the SRE team and network team. By then, the issue has violated the SLA. But now all the teams are in the war room. So that’s progress, right?
Well, the next problem is, none of these teams use the same tools.
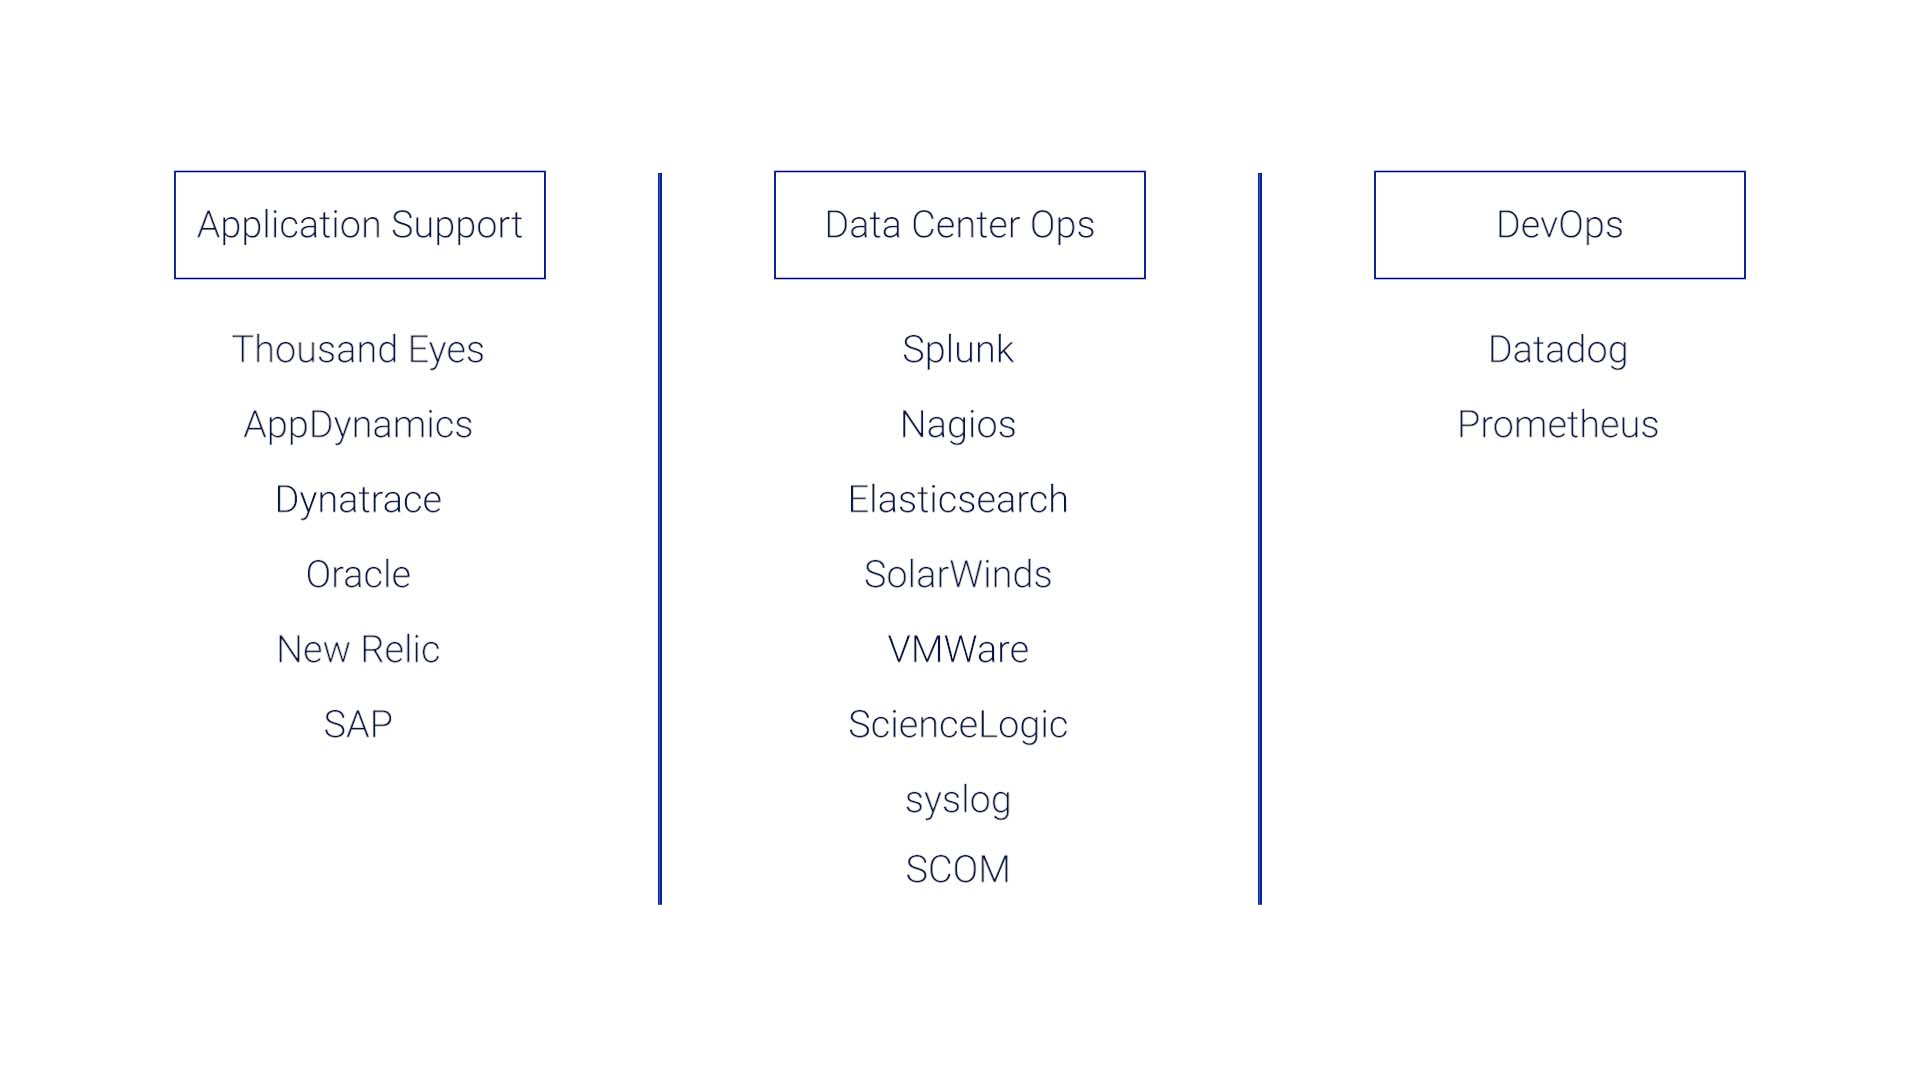
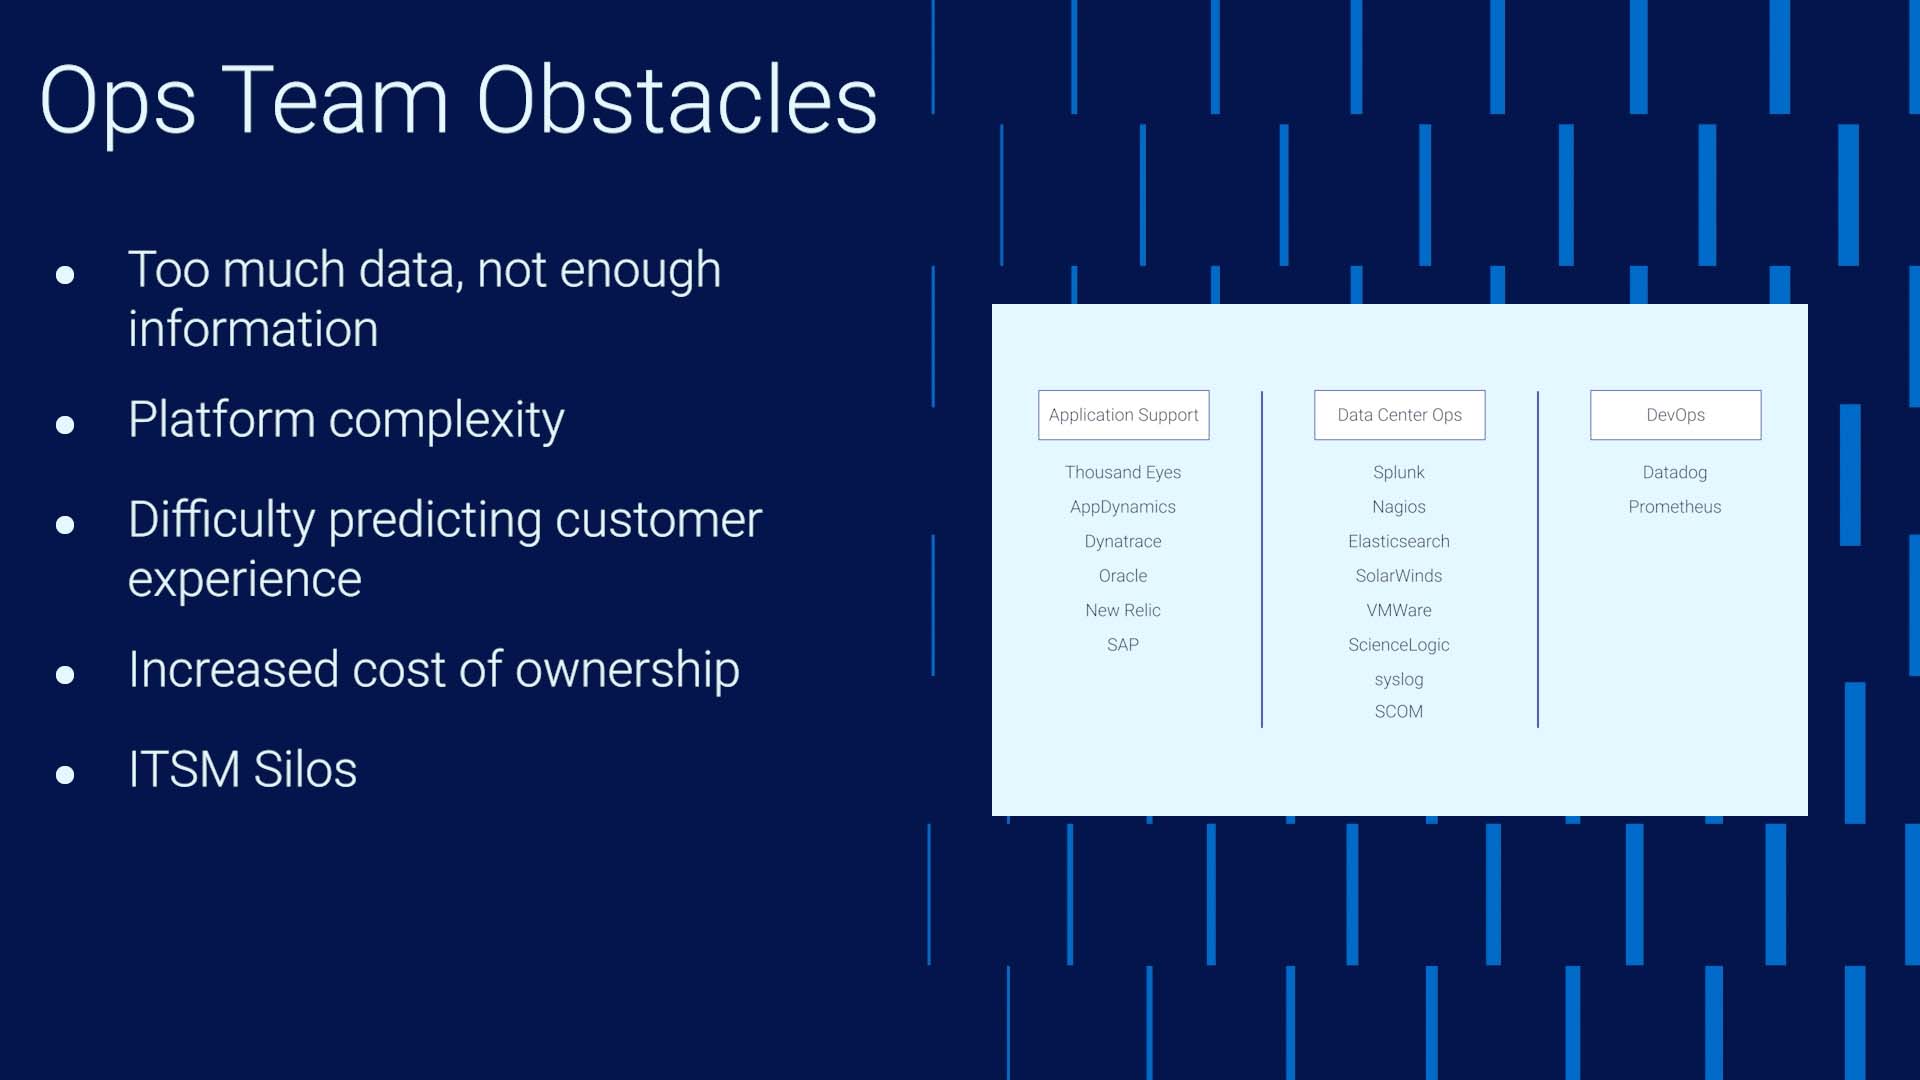
The application support teams are using tools such as Thousand Eyes, AppDynamics, Dynatrace, Oracle, New Relic, or SAP.
But the datacenter Ops teams are using tools like Splunk, Nagios, Elasticsearch, SolarWinds, VMware, ScienceLogic, syslog, or SCOM.
The DevOps team would be using yet another set of tools like Datadog and Prometheus.
And no one is familiar with how to look at the other teams’ tools, so correlating the insights from all those tools is not easy.
Sounds familiar? What's happening here?
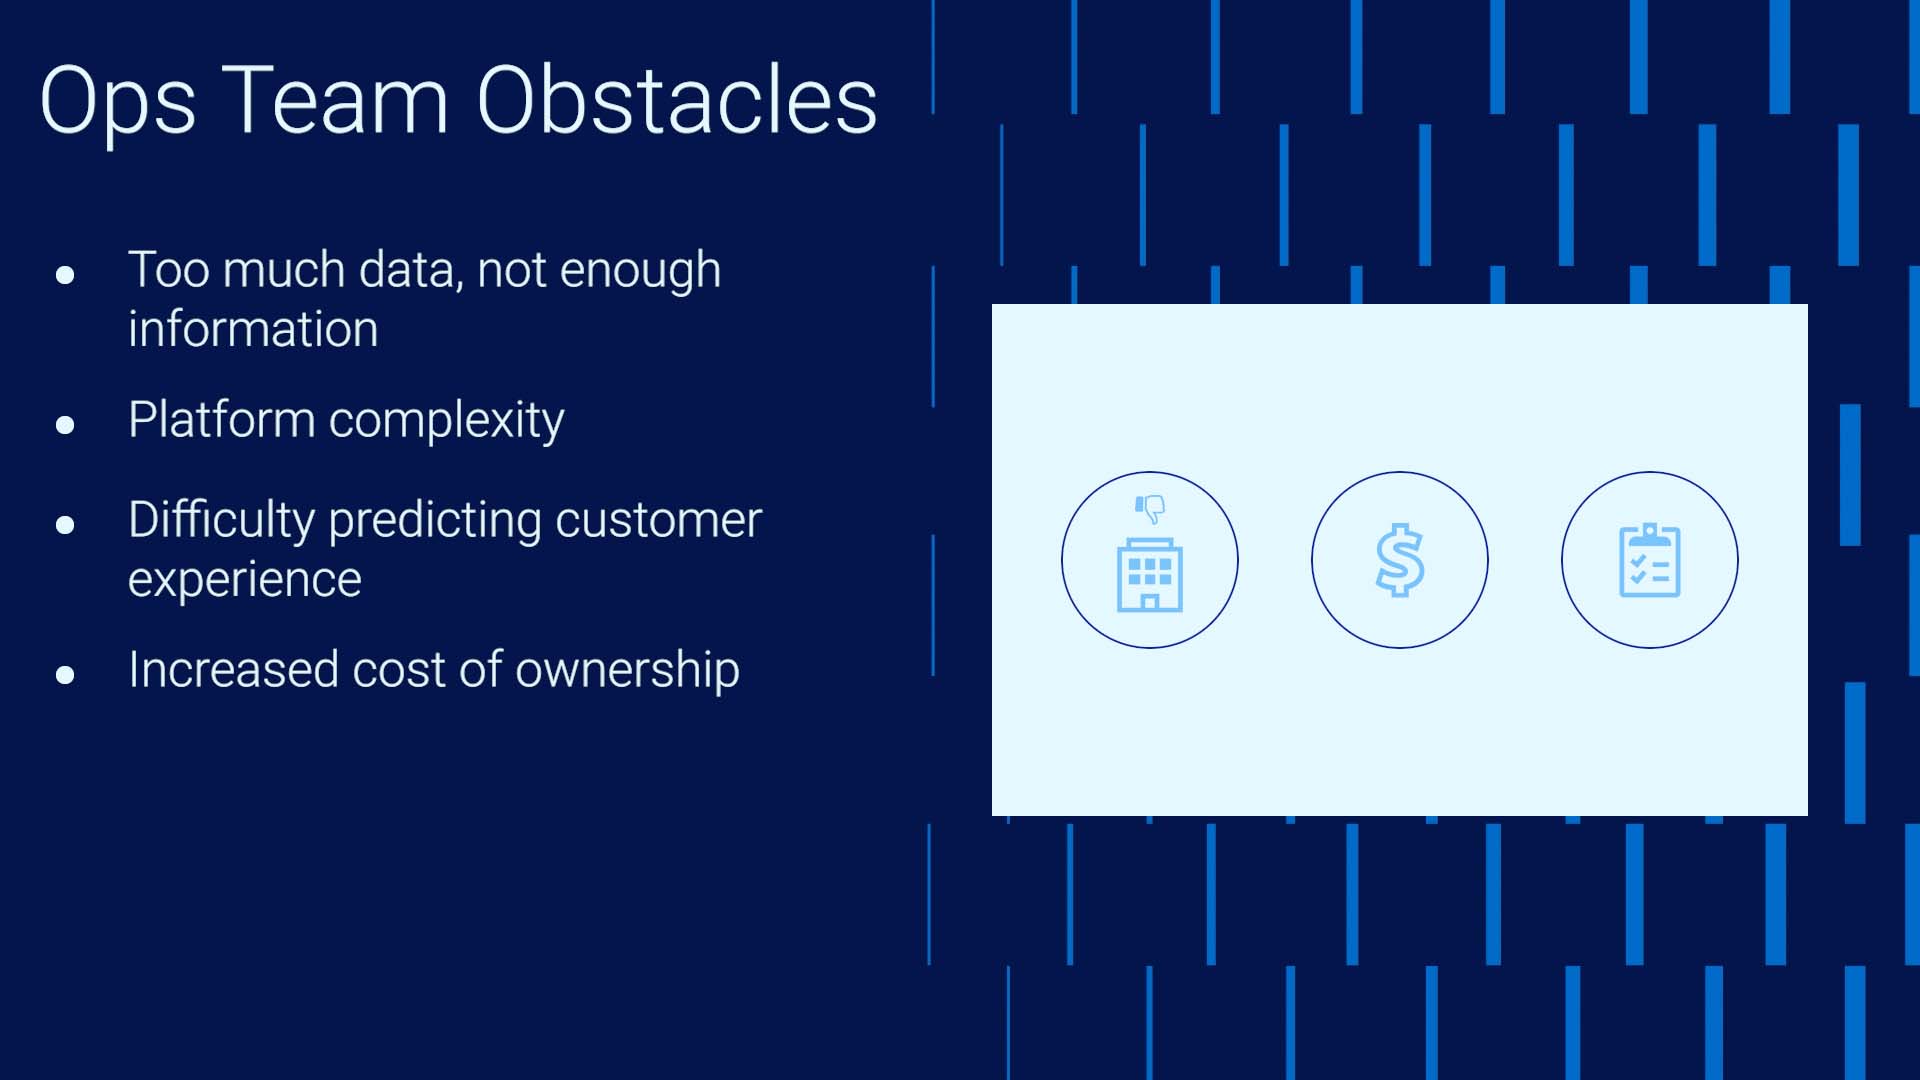
These are the typical obstacles that block today’s Ops teams from achieving operational efficiency.
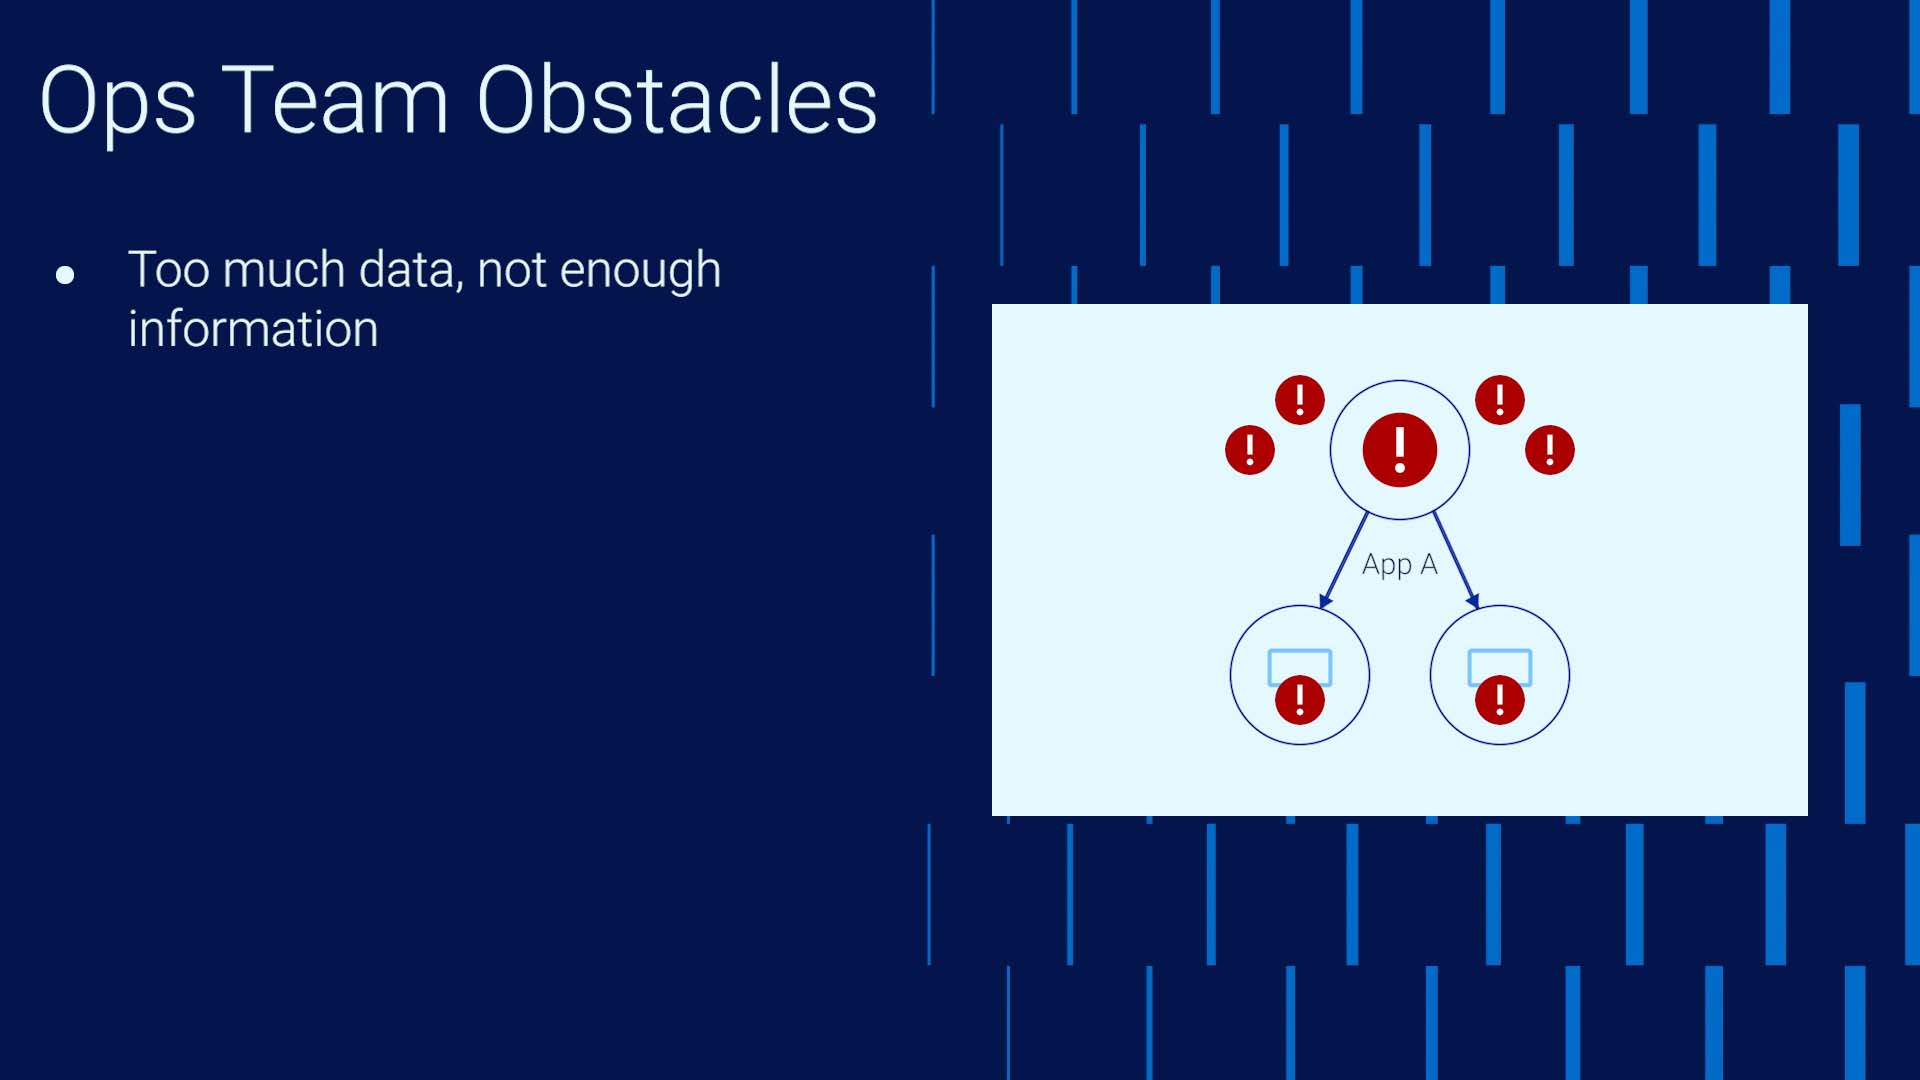
Number one, every team is flooded with data yet lacks information. In our example, if the Ops team could catch the error triggered by the config change with the load balancer, the whole cascading effect would have been avoided. But we are all overwhelmed by the noise.
Two is complexity. Platform complexity continuously increases. Networks used to be very simple, so identifying root cause and impact was easy. This is no longer true. Applications and services are heavily API-driven, everything is becoming cloud-based. As in our example, the root cause is often not the application you observe with the issues. Each affected party raises a ticket with whom they think is responsible for the cause, so the ticket count increases. Identifying all the relevant parties takes time. By the time you have everything you need in the war room, the issue has already gotten to the Sev 1 state.
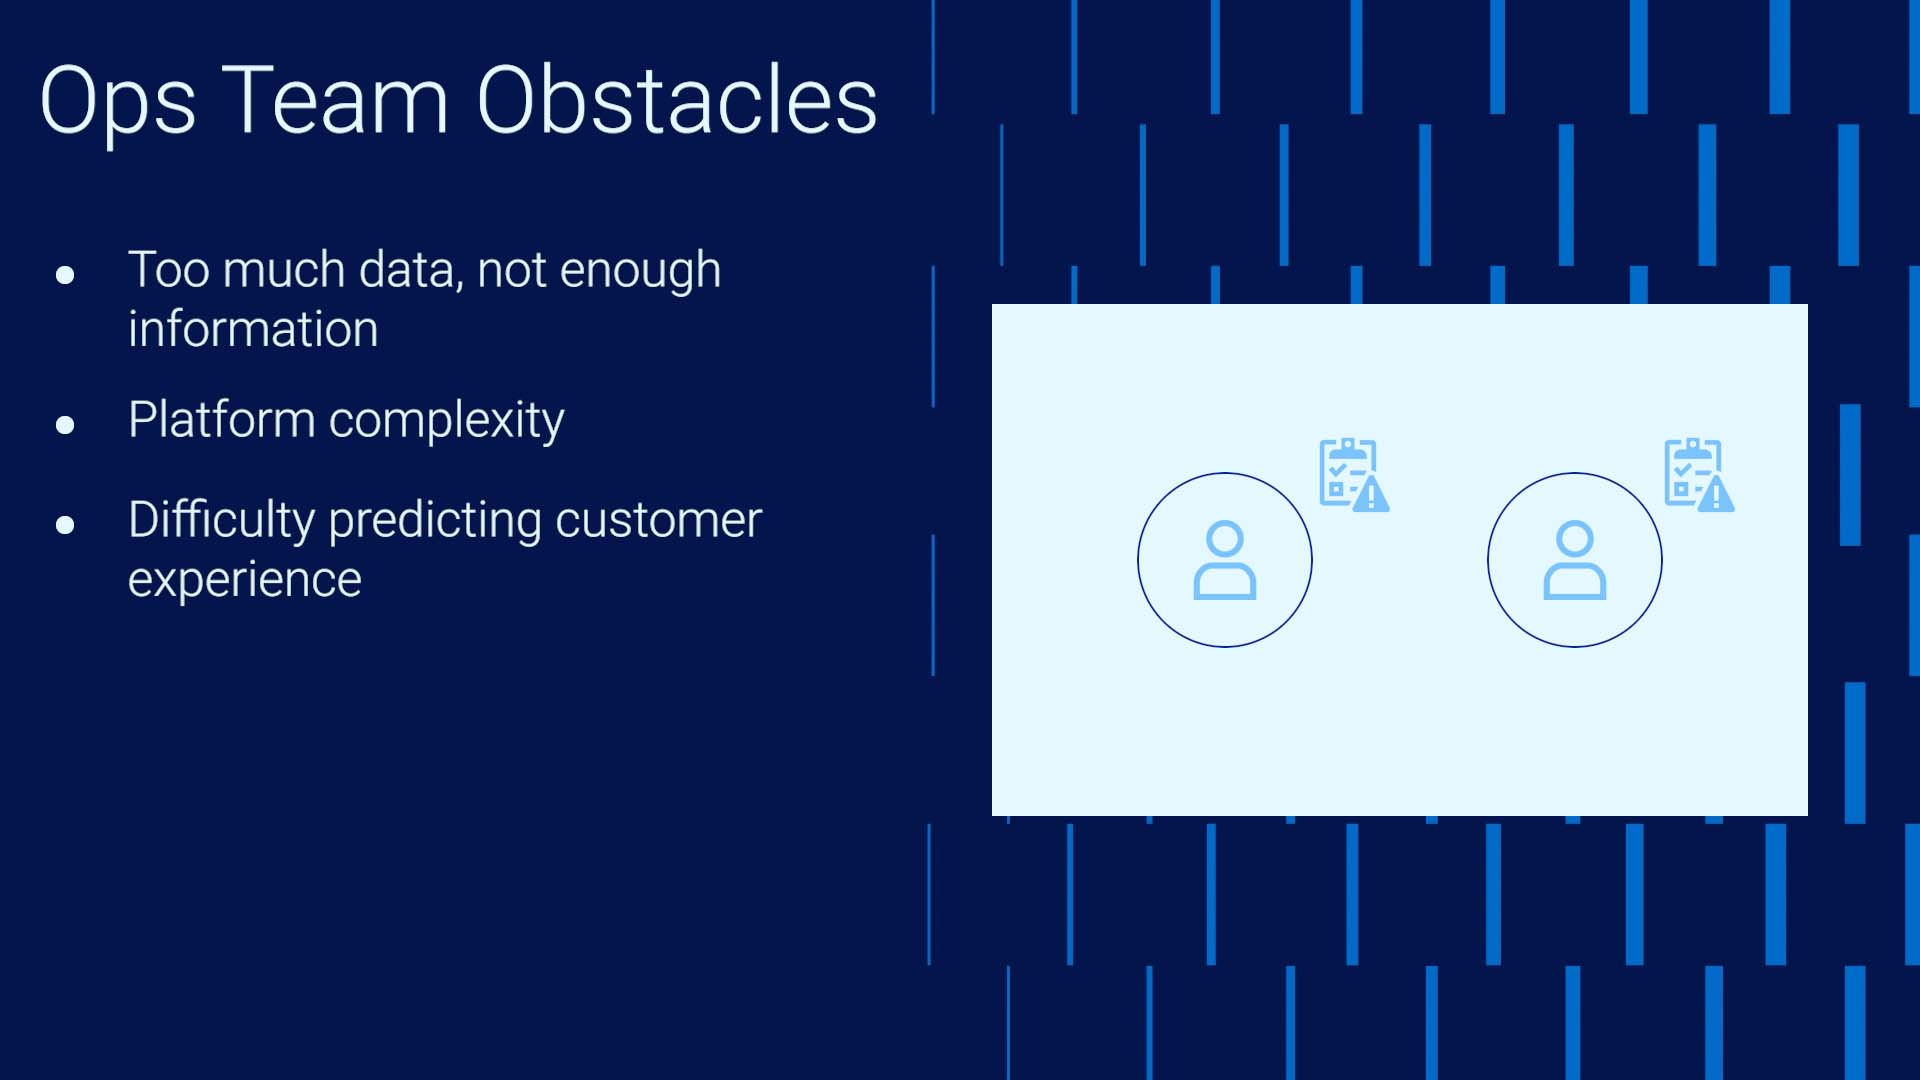
Three is difficulty predicting customer experience. Again, as in our example, the end users are often the incident detection system. This not only affects the MTTR but is also a huge CSAT issue.
Business change only increases the Ops team’s total cost of ownership. If you don’t respond to the changes demanded by the market, you will lose to the competition. Yet constant changes in business practices cost the Ops teams who must support them. Rules must be re-written often to accurately detect problems.
ITSM silos delay response. The teams are not talking to each other until things are critical. Also, the toolsets they use don’t match. In our example, they all see the problem, but they don’t know how to read what the other team’s tools are saying. There’s also a human factor that is an added obstacle.
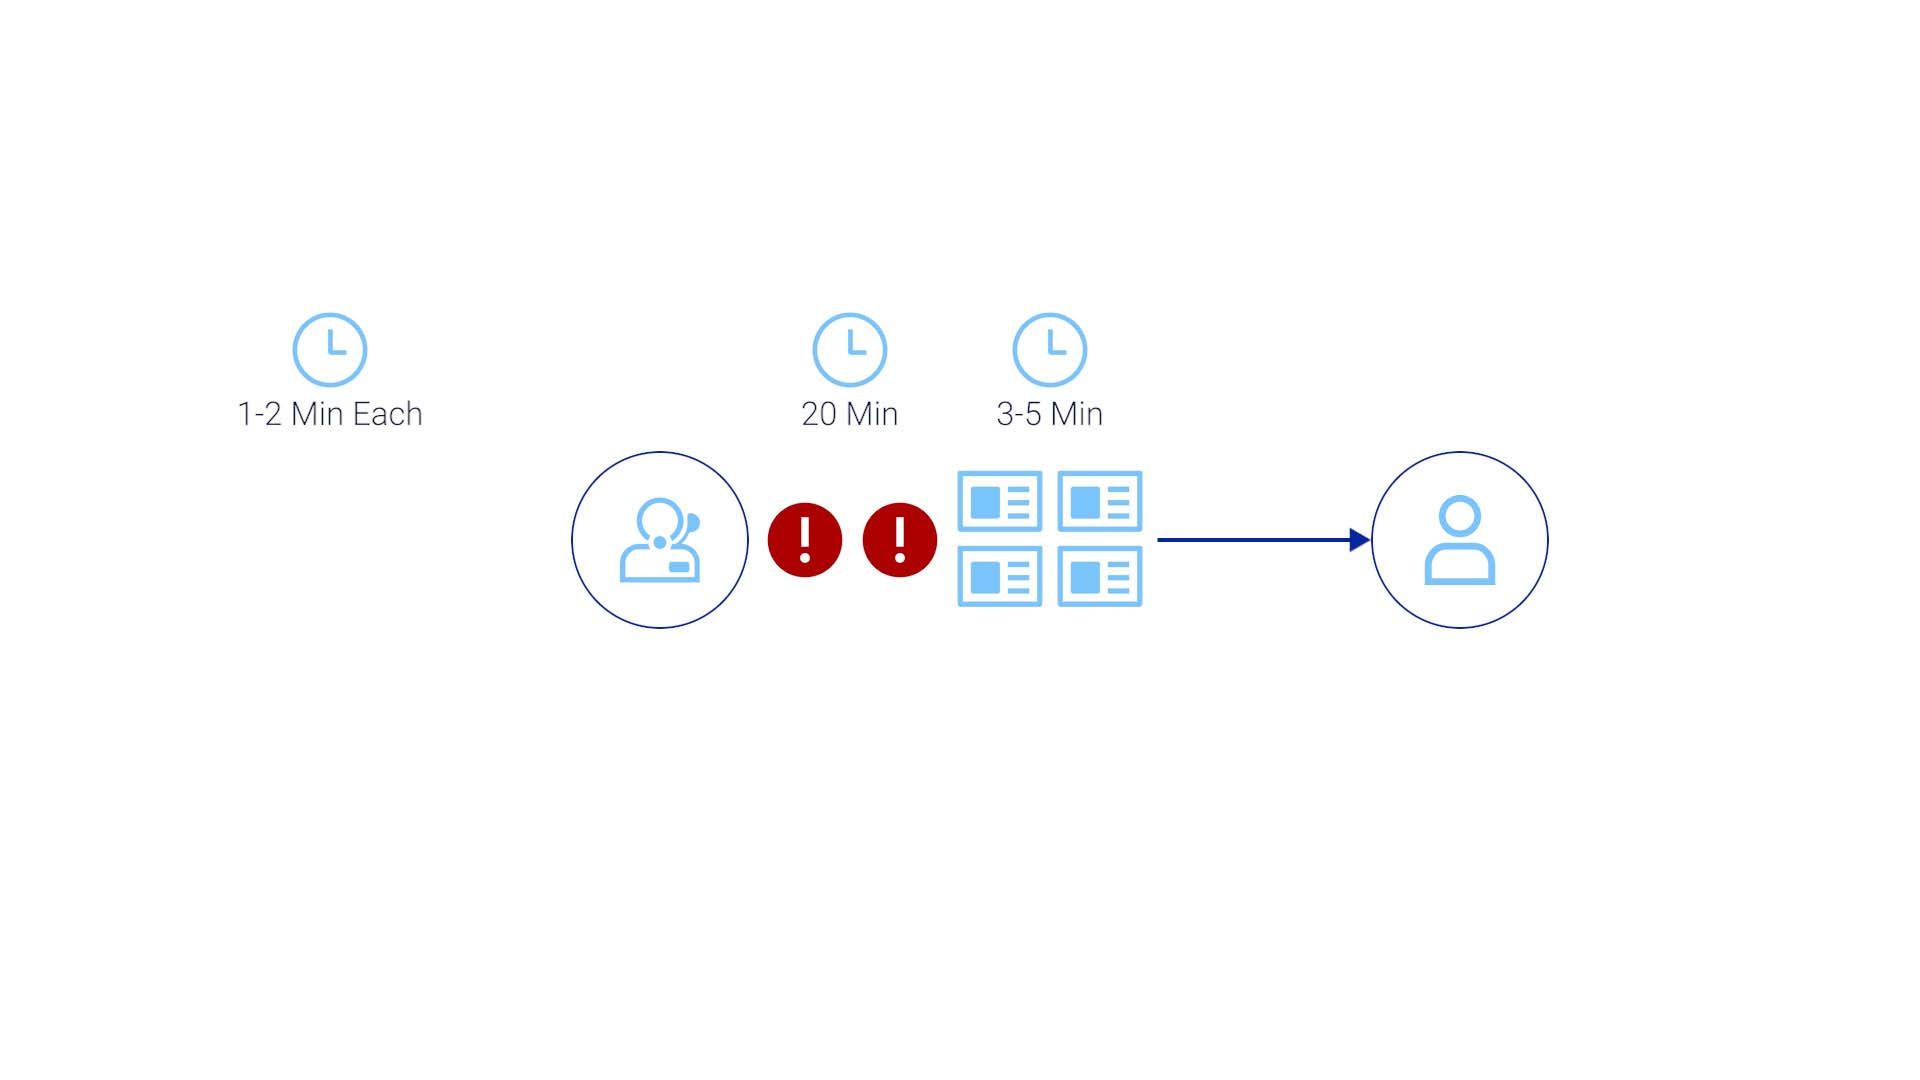
The fact is, despite the best effort to set up the most accurate thresholds and policies to trigger alarms, you still get too much noise. So, you must filter these alerts and identify the ones that truly require attention. And in most cases, to do this accurately requires human eyes. From the data we gathered, it typically takes 1.2 minutes to assess one alarm

And the operators typically go through 16-20 alerts before finding something that requires a ticket. That’s already 20 minutes.

And, of course, there’s always a possibility of multiple operators identifying the same issue and creating duplicate tickets.
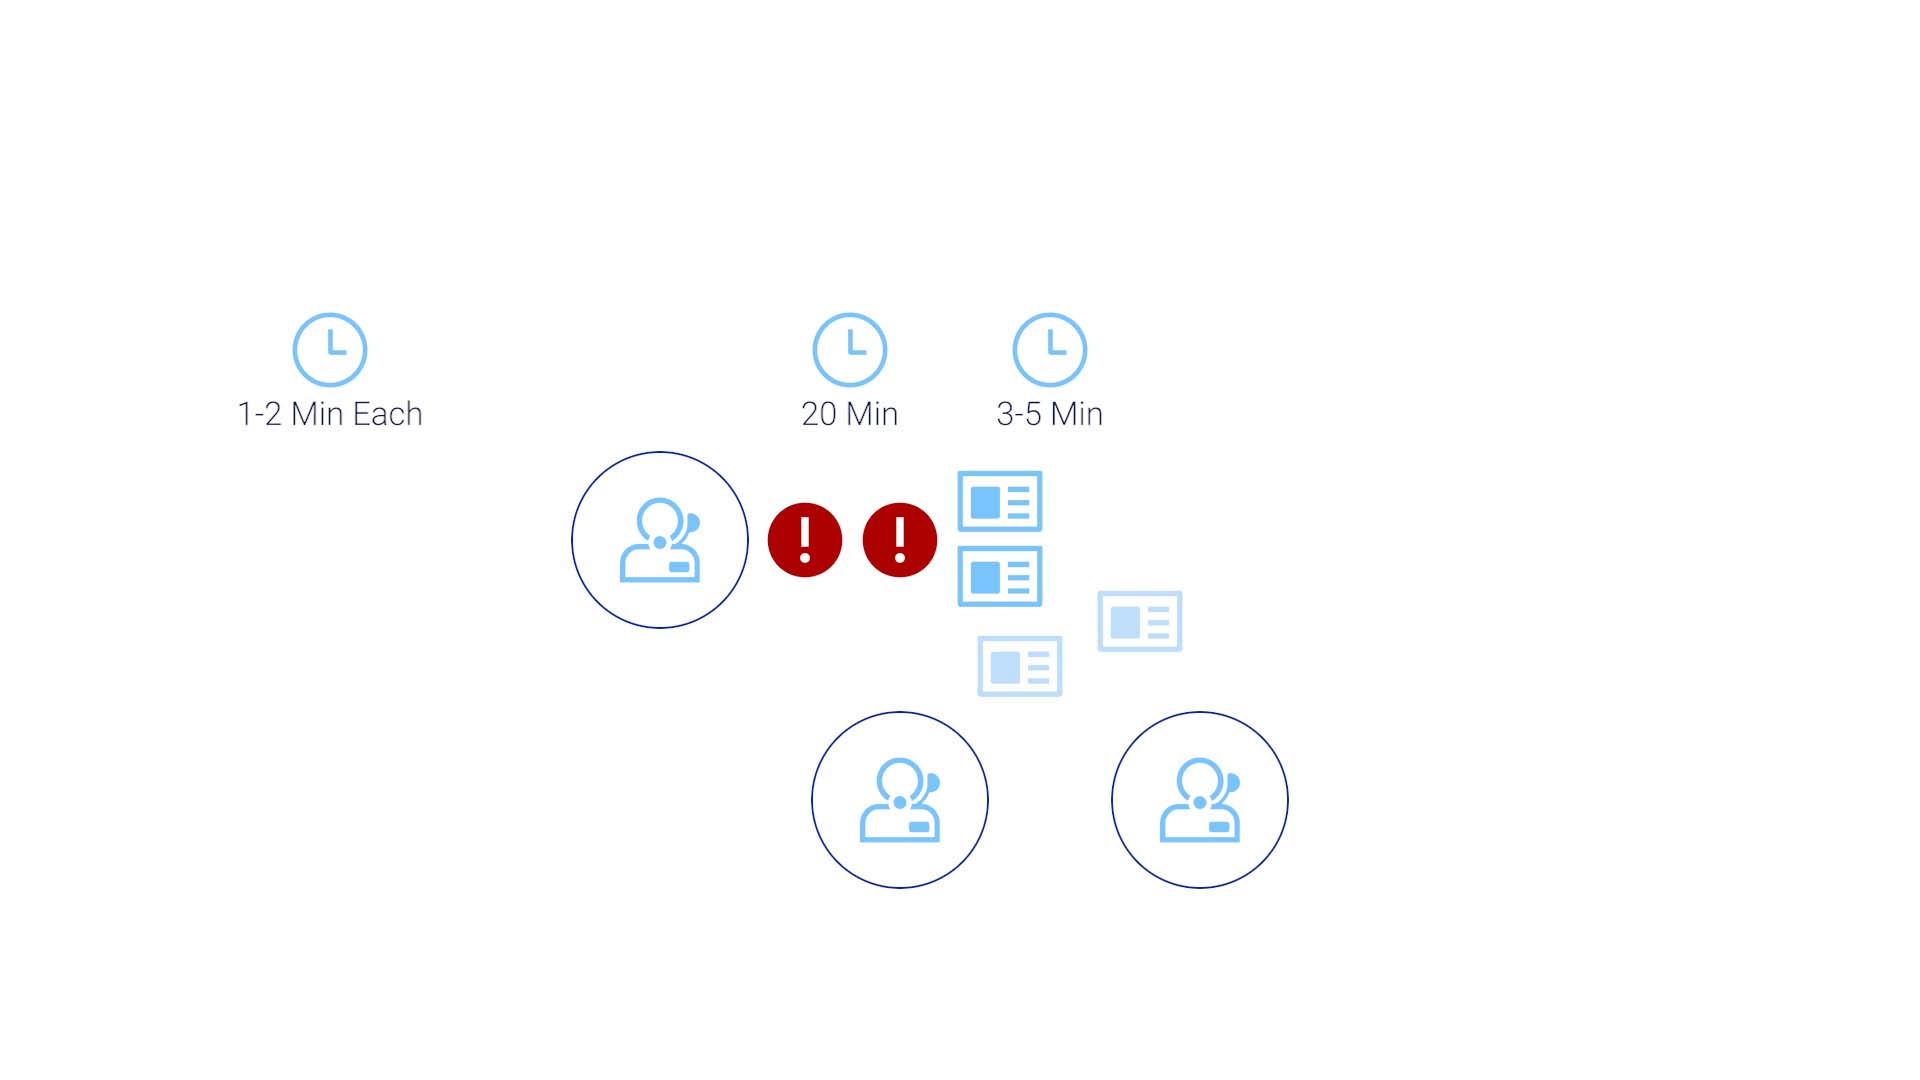
So, it’s possible that before the true investigation starts, you are already out of the SLA time frame. Then it takes a few minutes to identify the assignee.
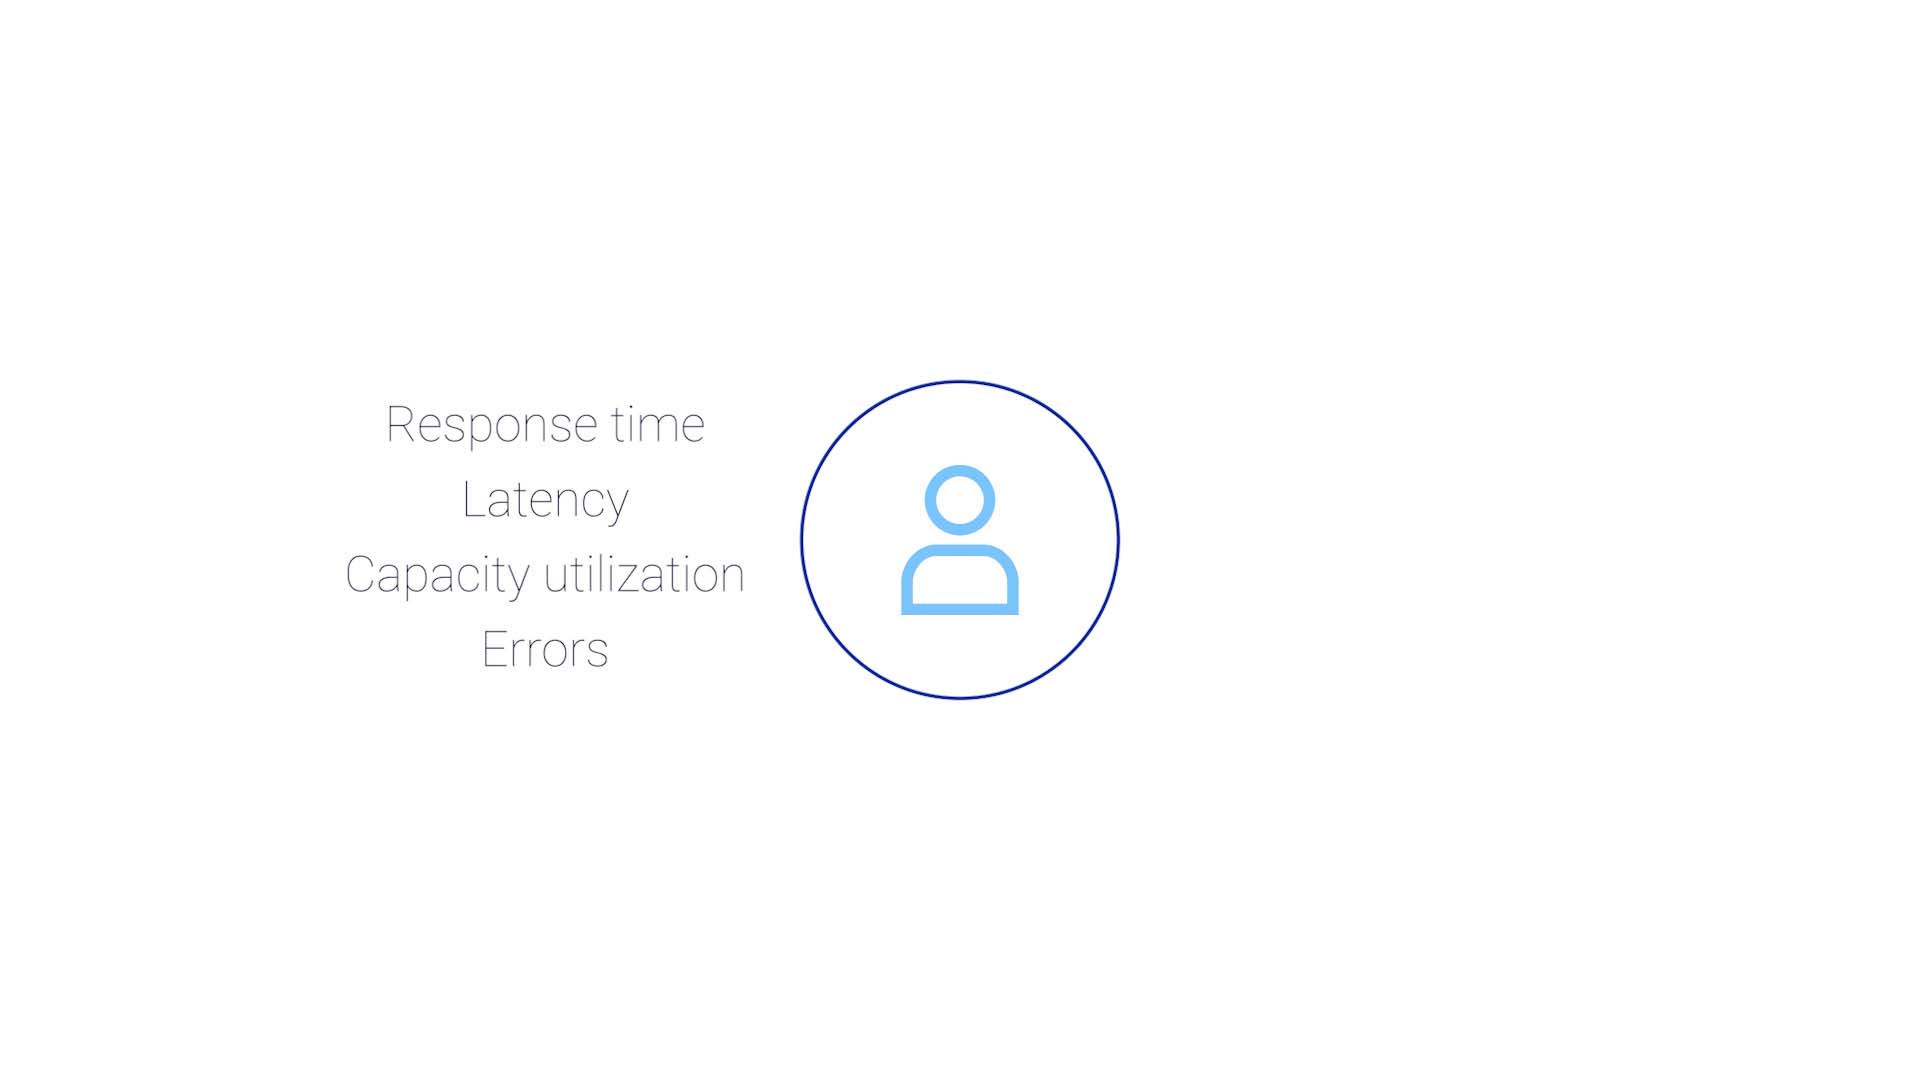
Then, suppose you are a network operator. You'll go to your monitoring tool, and check response time, latency, capacity utilization, and errors to first assess if the issue is truly a problem.
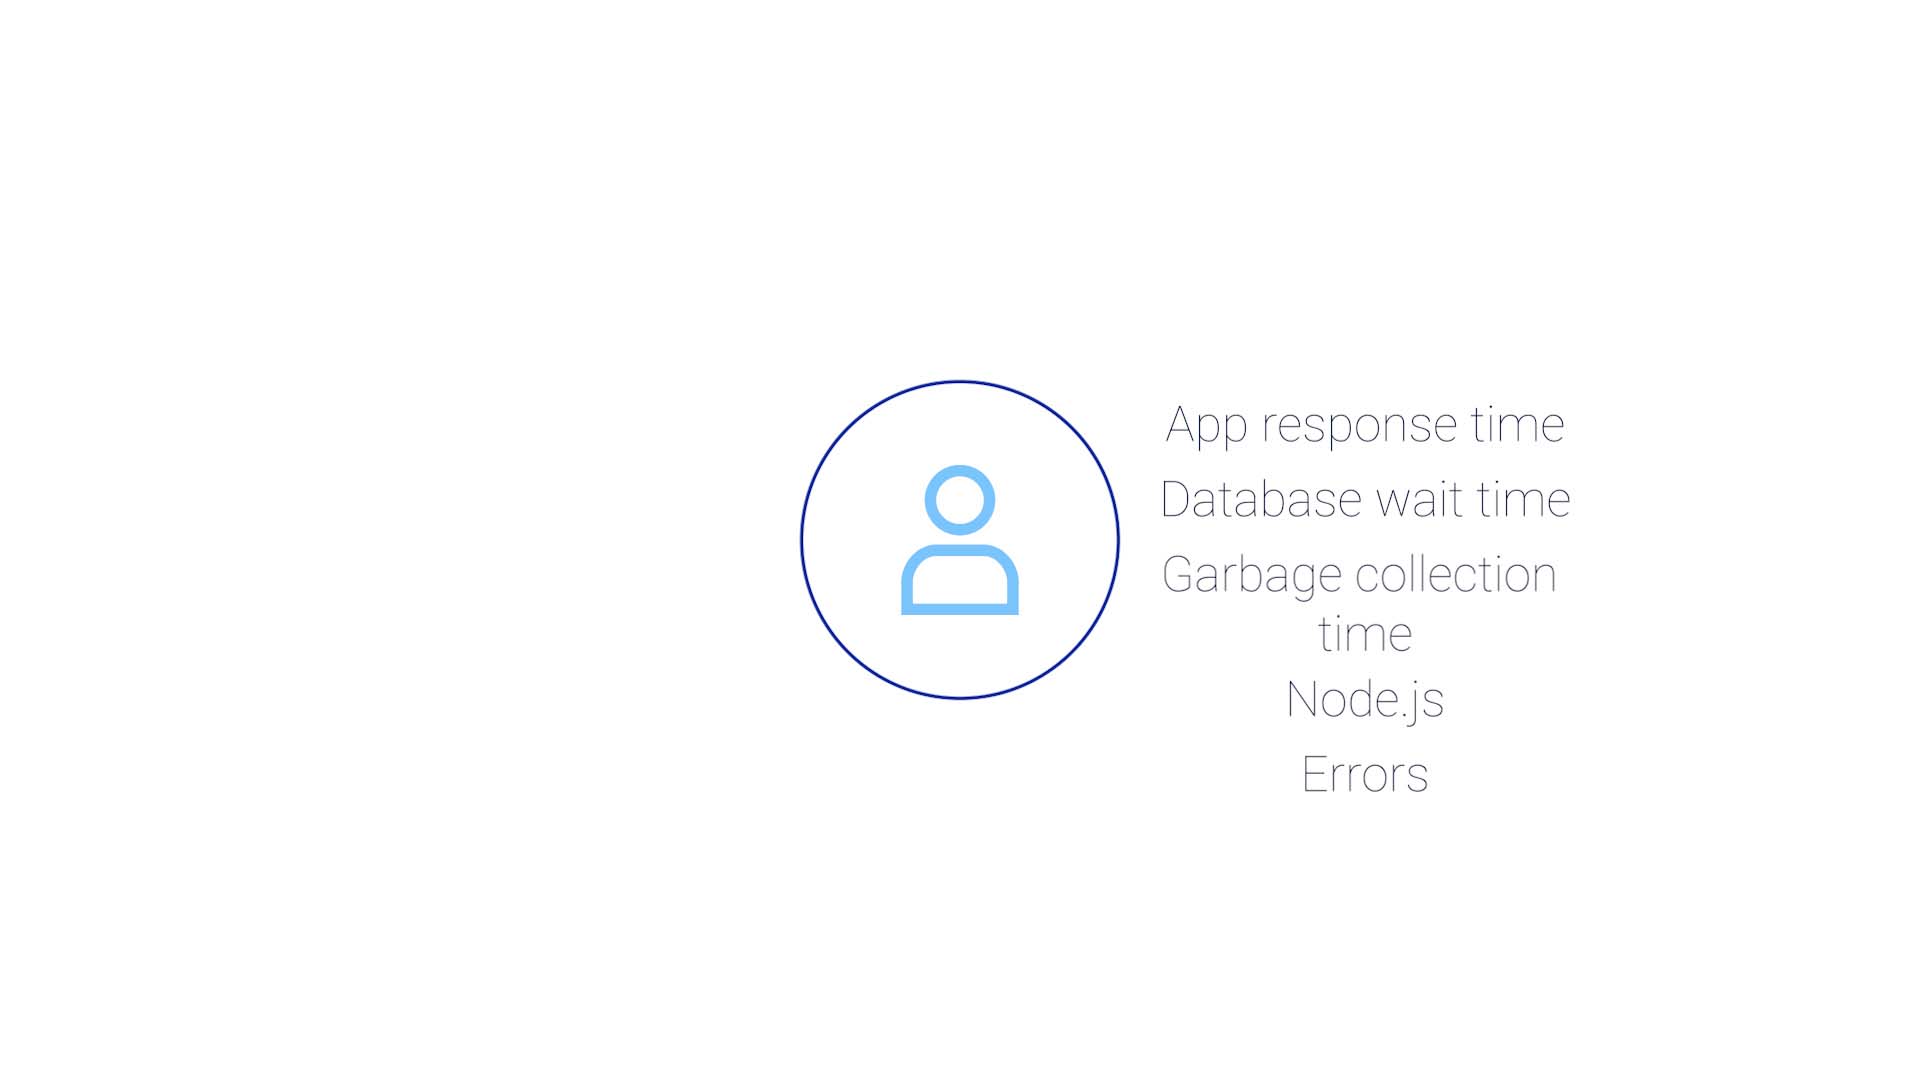
If you are an app ops engineer, you’ll look at application response time, database wait time, garbage collection time, a bunch of node dot JS things maybe, and errors.
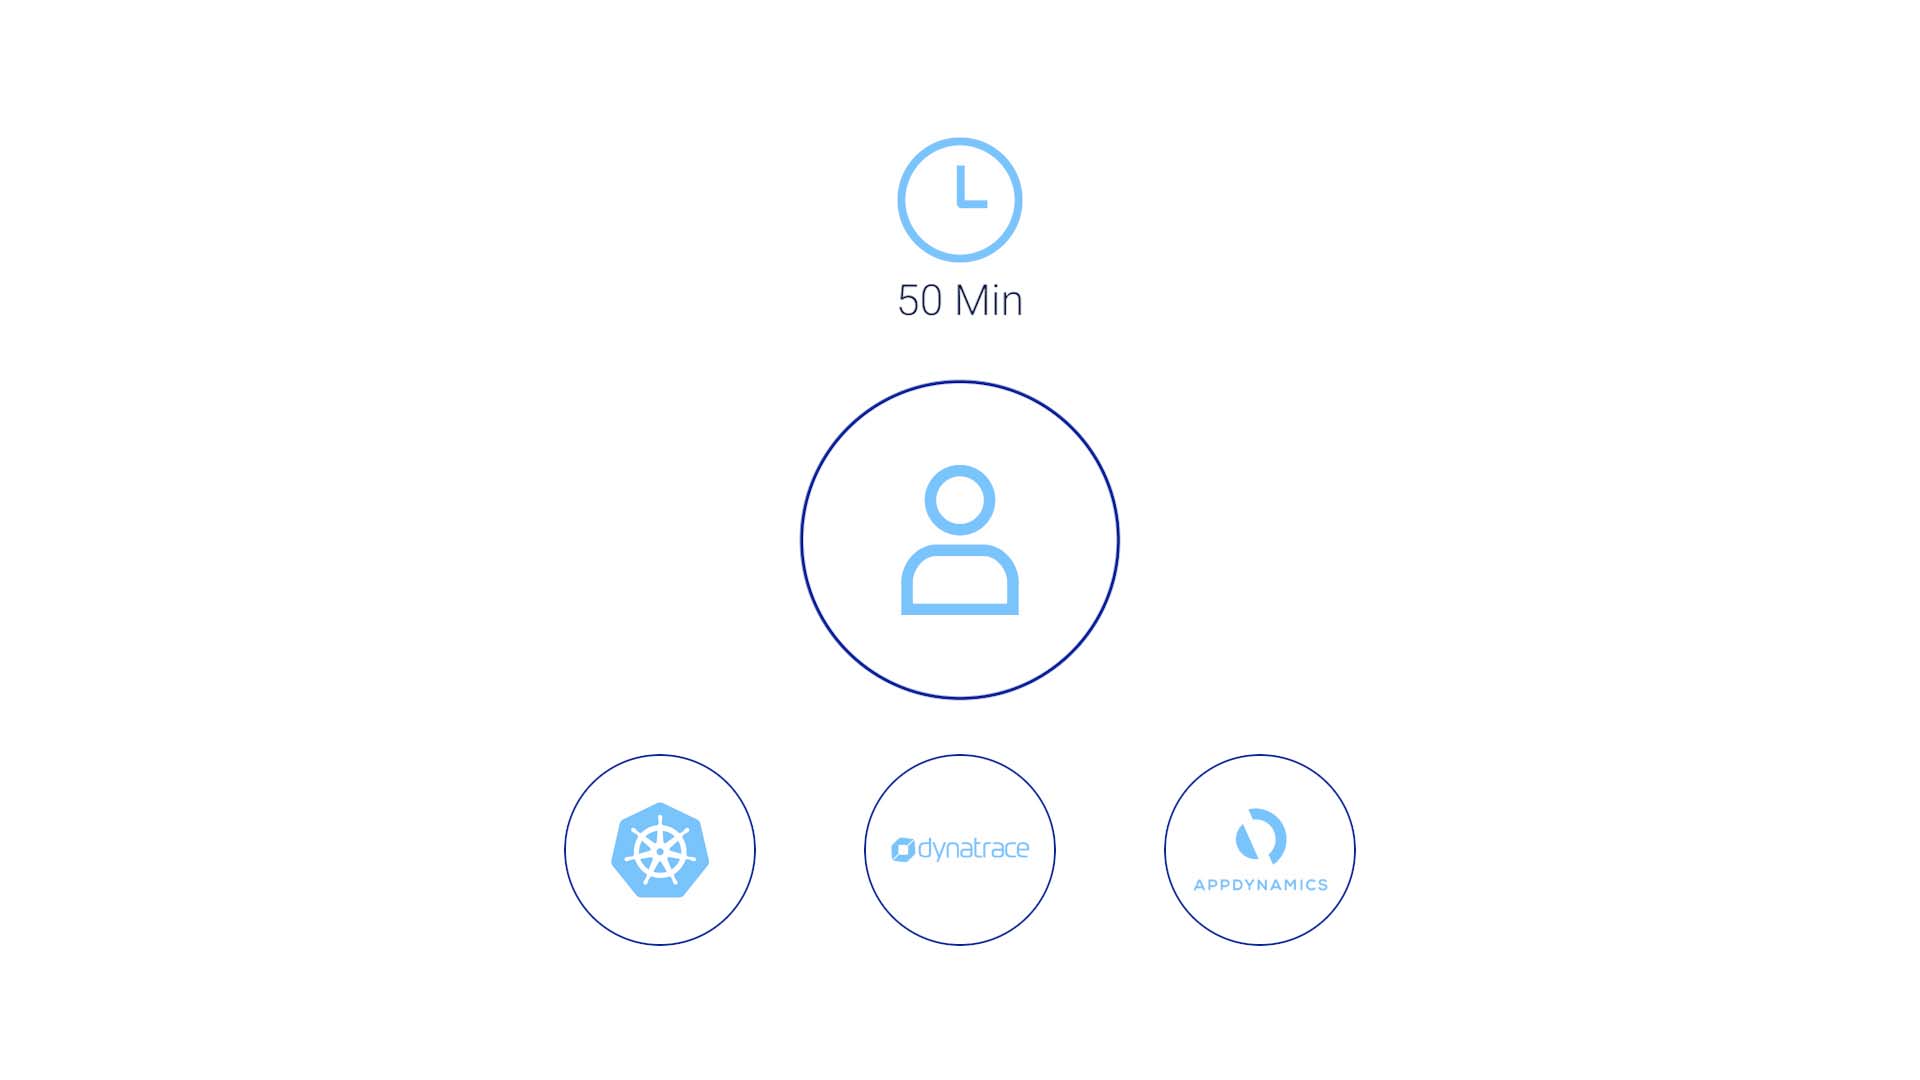
You must look at that across all the app servers in the Kubernetes cluster, in the Dynatrace tool, and in the AppDynamics tool. This part typically takes 50 minutes.
And let’s say you identify that it’s a real problem. If I'm the causal stakeholder, I would try to remediate the issue.

If I’m the impact stakeholder, I need to notify the causal stakeholder with what I know and work through them to implement a solution. How much time did it take to get to this point? How much money are we spending to support this process?
How automatic is your automation? You may say, “we create tickets automatically, so this is not applicable to us.”
But let's verify we are talking about the same thing. You might have a rule in your settings to create a ticket automatically when a certain alert comes in.
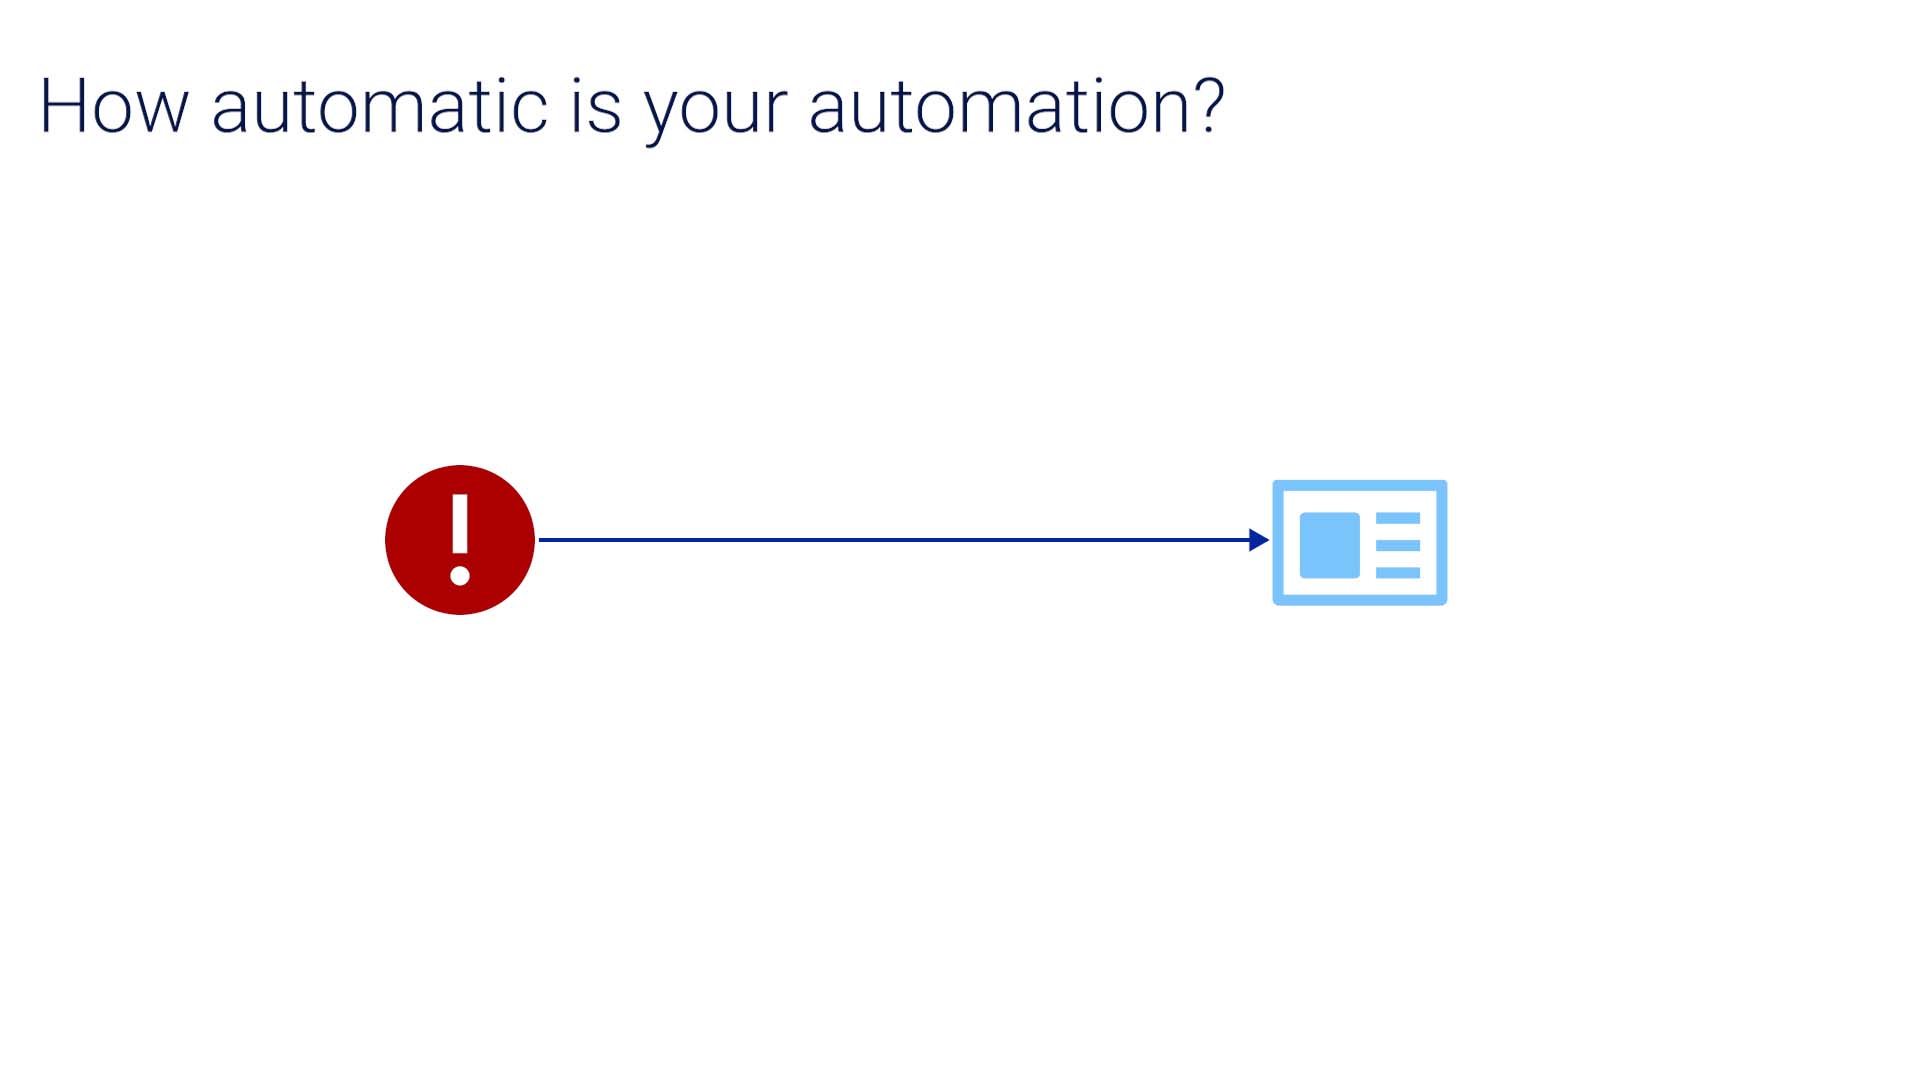
But if you’ve followed along thus far, you realize that only automates a small part of the process and the rest remains manual.
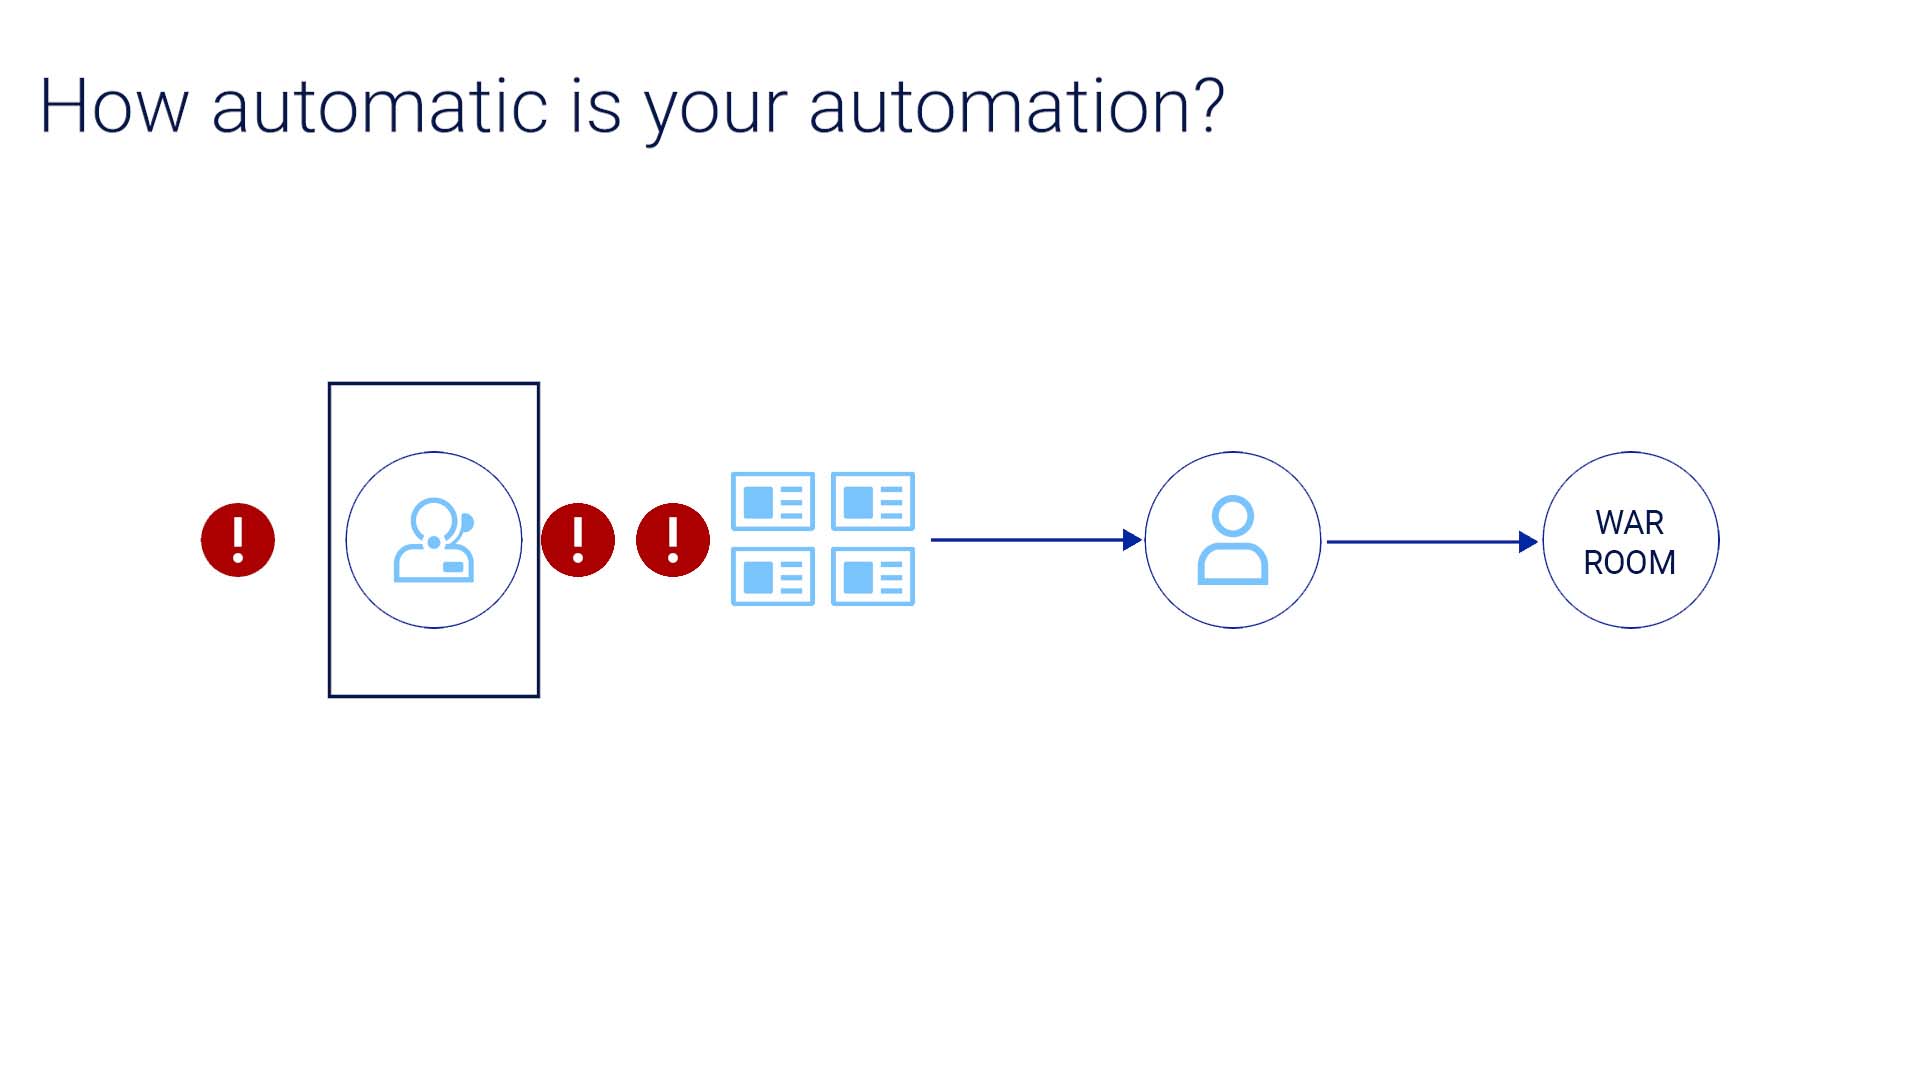
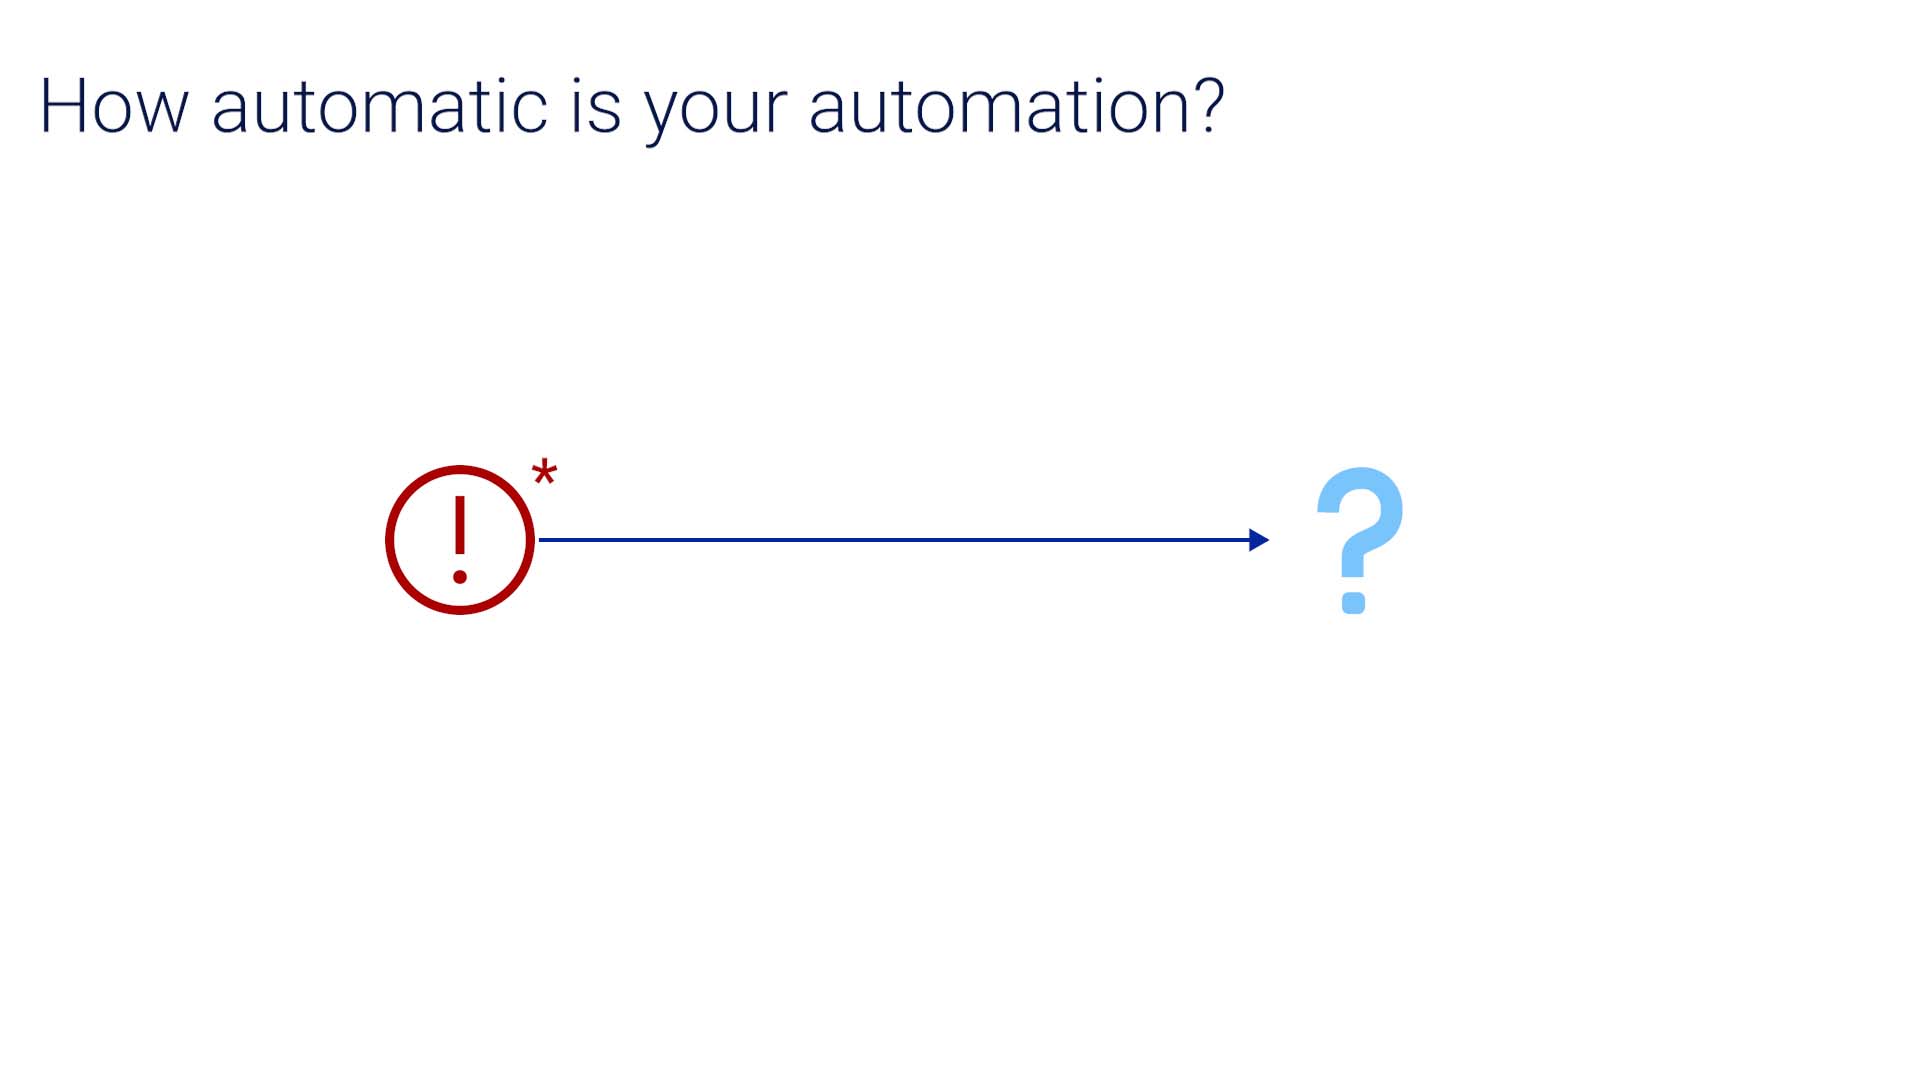
Also, these manually set rules are unable to catch newly arising issues.
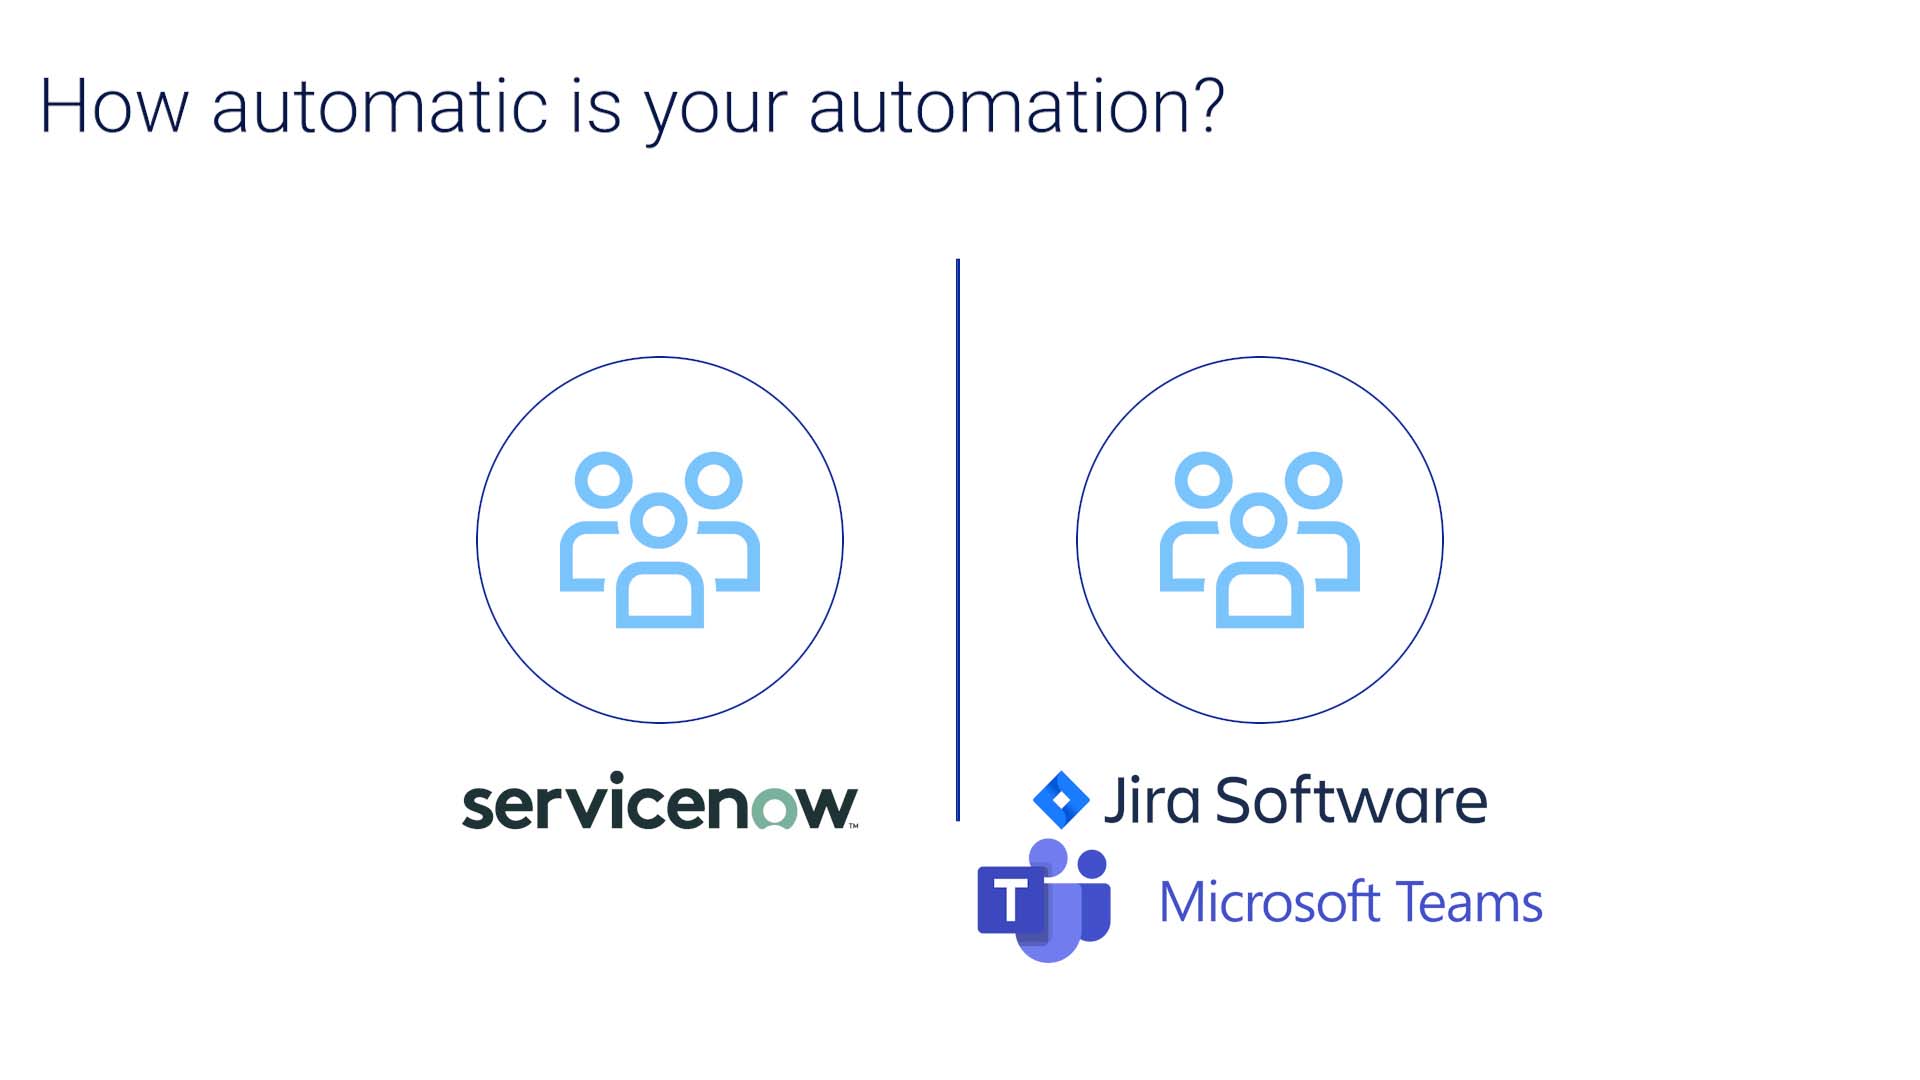
Lastly, the difference in tools and processes is another obstacle for operational efficiency. Some of your teams may use ServiceNow, others may use Jira and MS Teams... If there is a solution to unite the siloed teams to tackle the complex incidents, it must not disrupt the existing process and ecosystem.
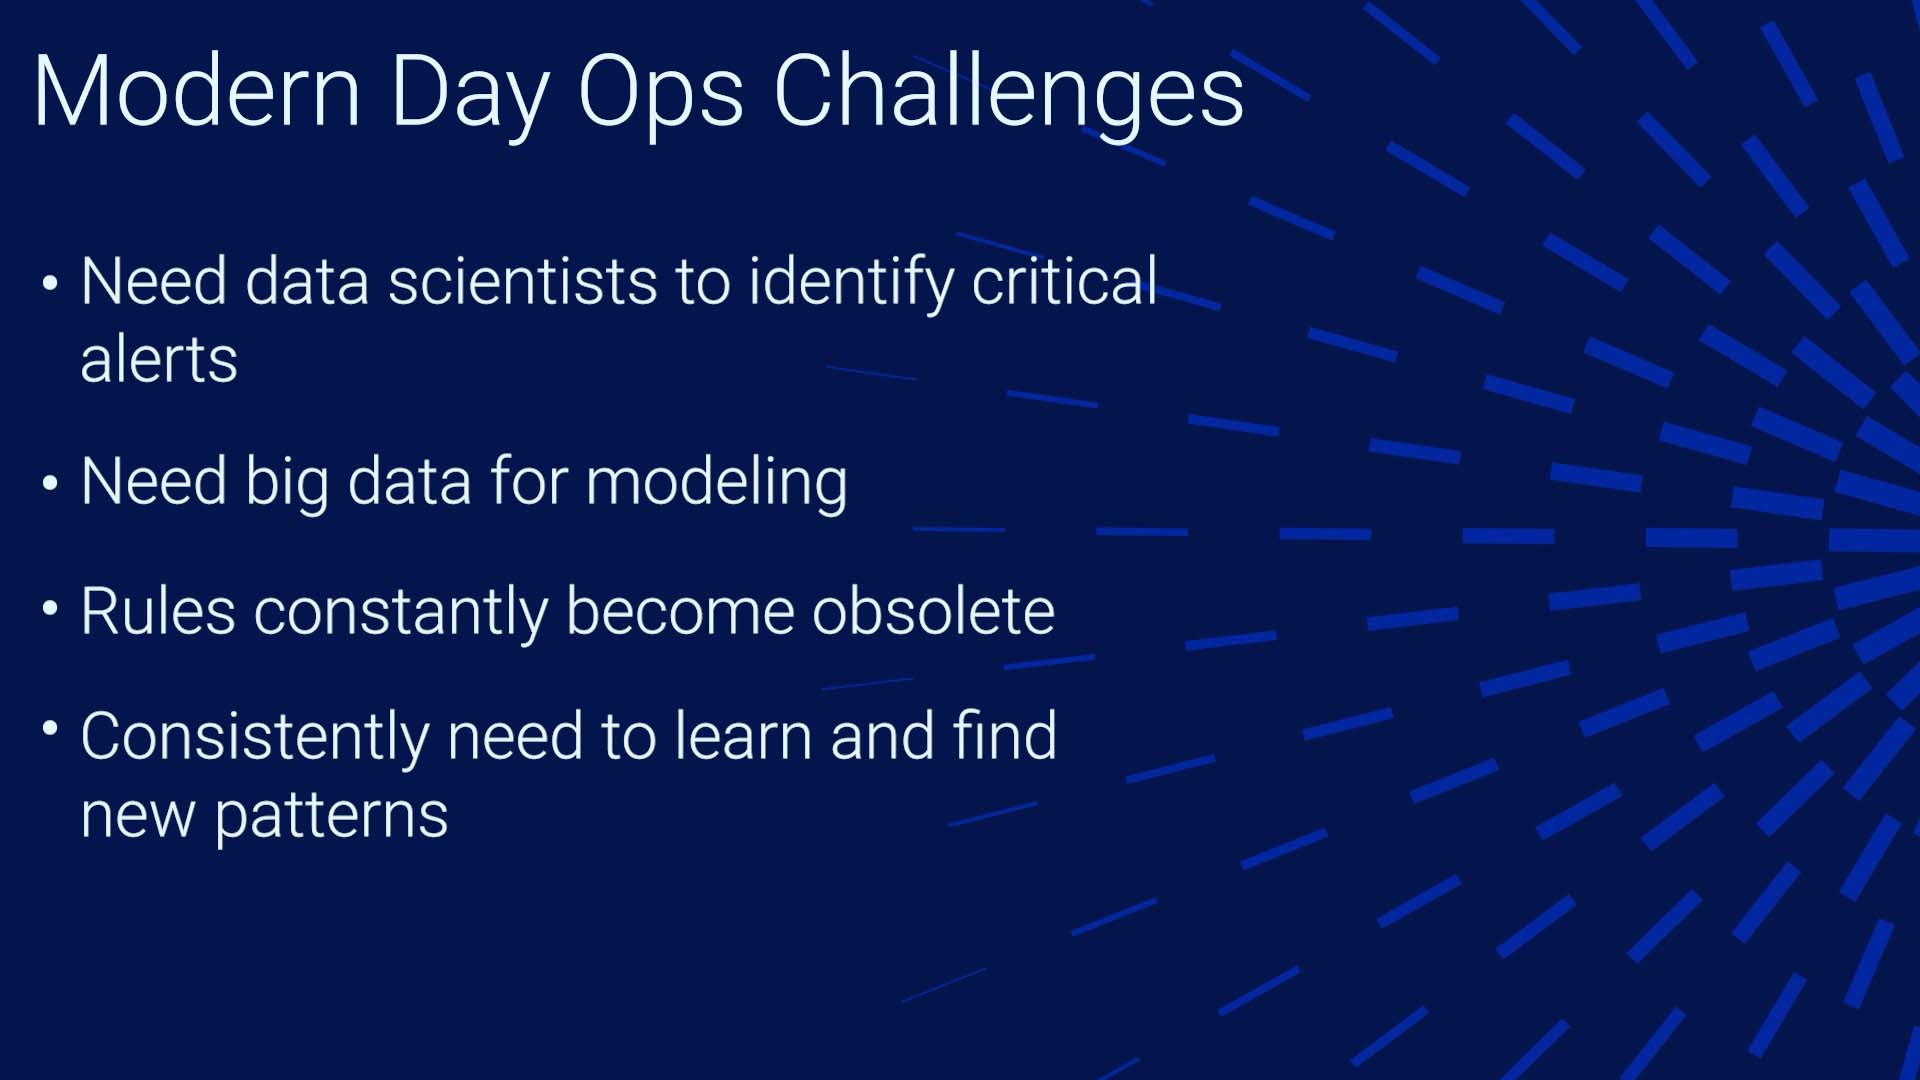
So to summarize, the modern operations face these challenges, and all of them are quite costly.
So what to do? This is where AIOps products step in to address these challenges. Learn more about AIOps Incident Management and see how. Thanks for watching!