Situation Room overview
The Situation Room provides an area where you and your team can review and collaborate on a single incident, its member alerts, and all related information.
The vertical view provides a full page of space dedicated to viewing the information for a single incident. Because you can see more of the incident context at once, you can more quickly get a full understanding of the issue without having to scroll or resize windows.
Access the Situation Room from the Incidents page:
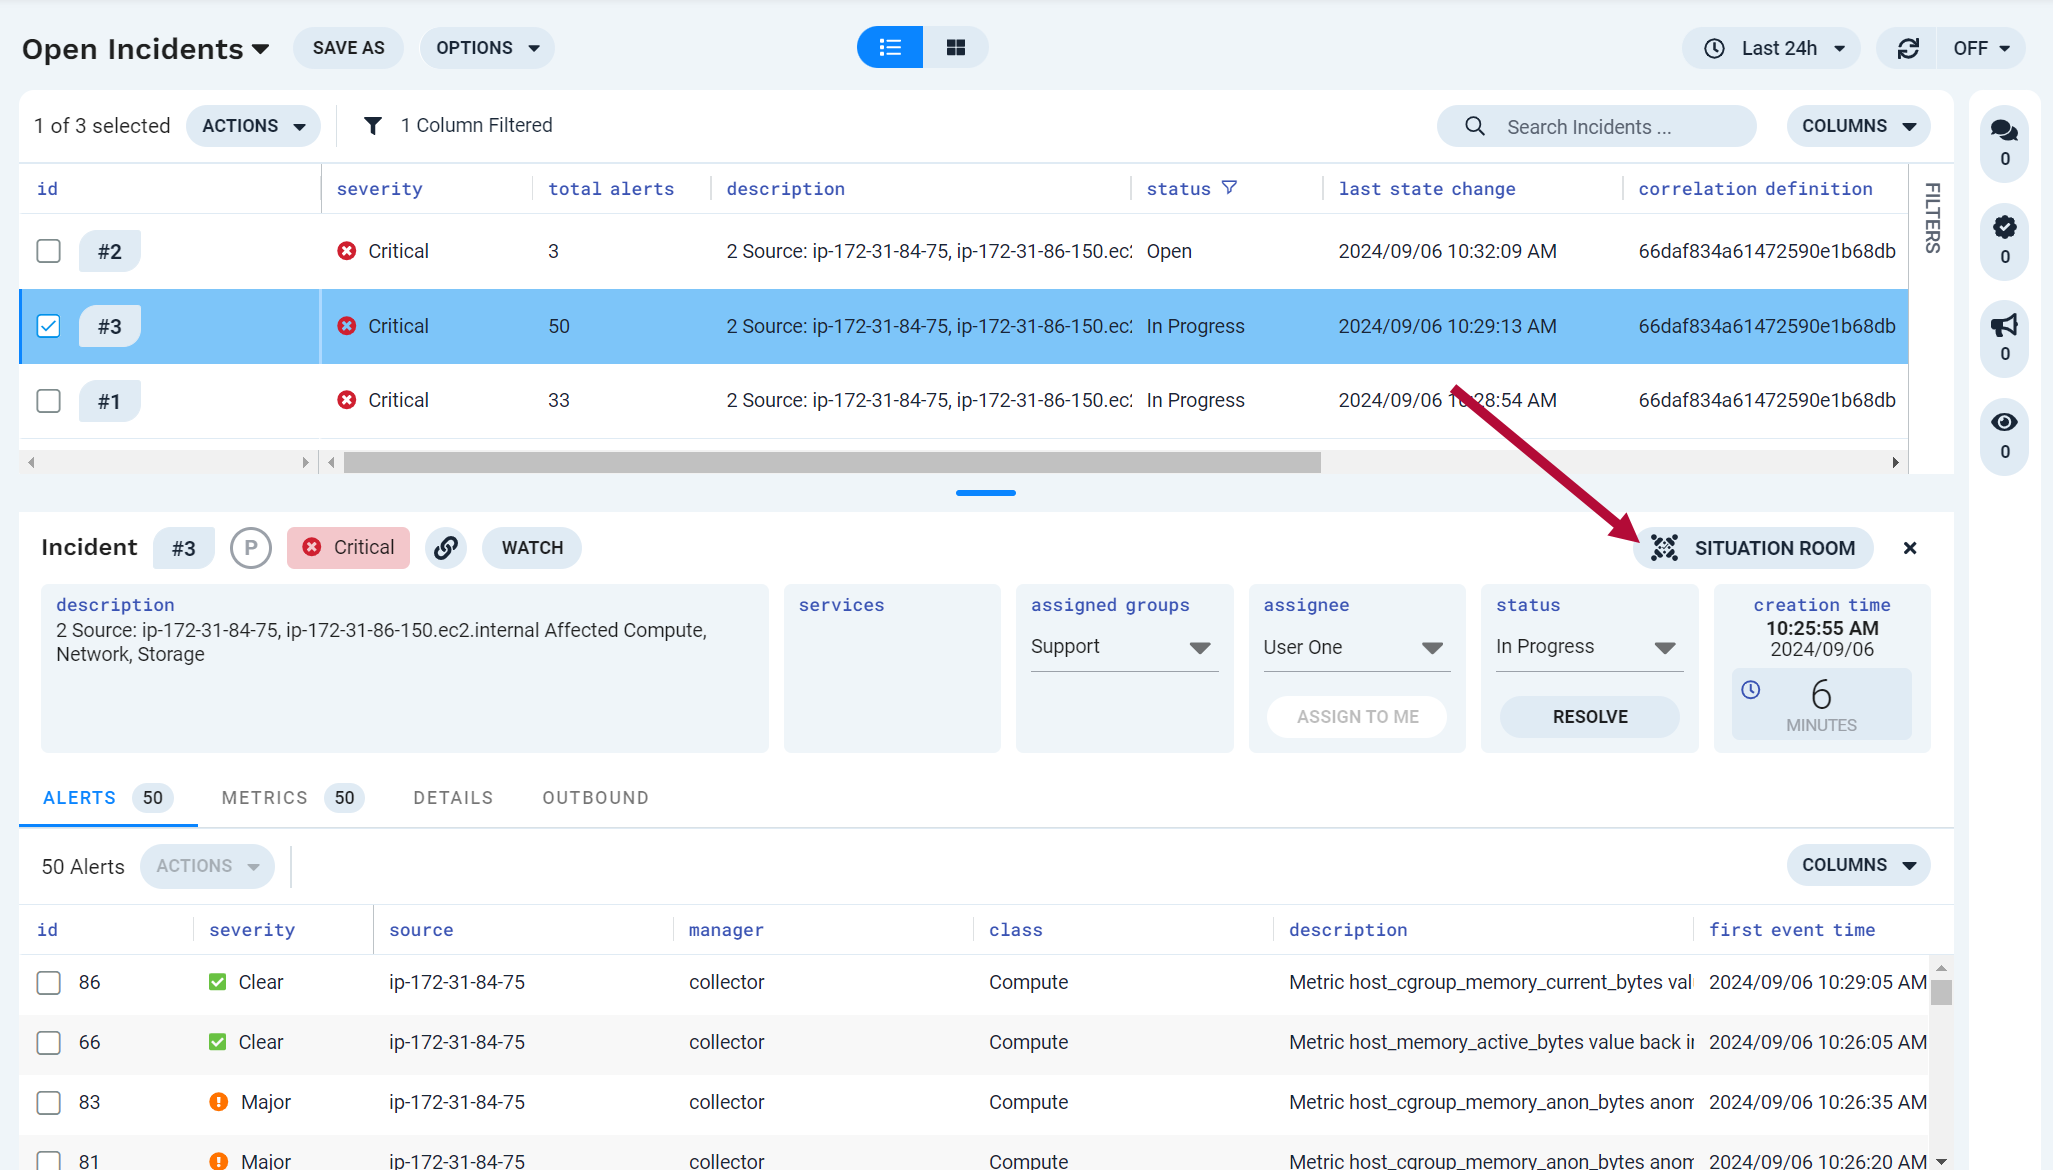 |
Navigate to Incidents > Incidents.
Select an incident from the list of incidents.
In the incident details in the bottom pane, click Open Situation Room.
Situation Room opens with focus on the selected incident and displays the included alerts.
In addition to viewing detailed information about an incident, you can share the incident URL with users. Just copy the URL displayed in your browser location bar and send to other APEX AIOps Incident Management users. When recipients open the URL, they will see the same Situation Room view, with the focus on the same incident.
You can also access an incident's Situation Room from the incident dashboard view. See Incidents dashboard for more information.
Situation Room interface
The Situation Room shows incident information plus details on the member alerts in the incident. You can interact with incidents and alerts as you can in other areas of Incident Management.
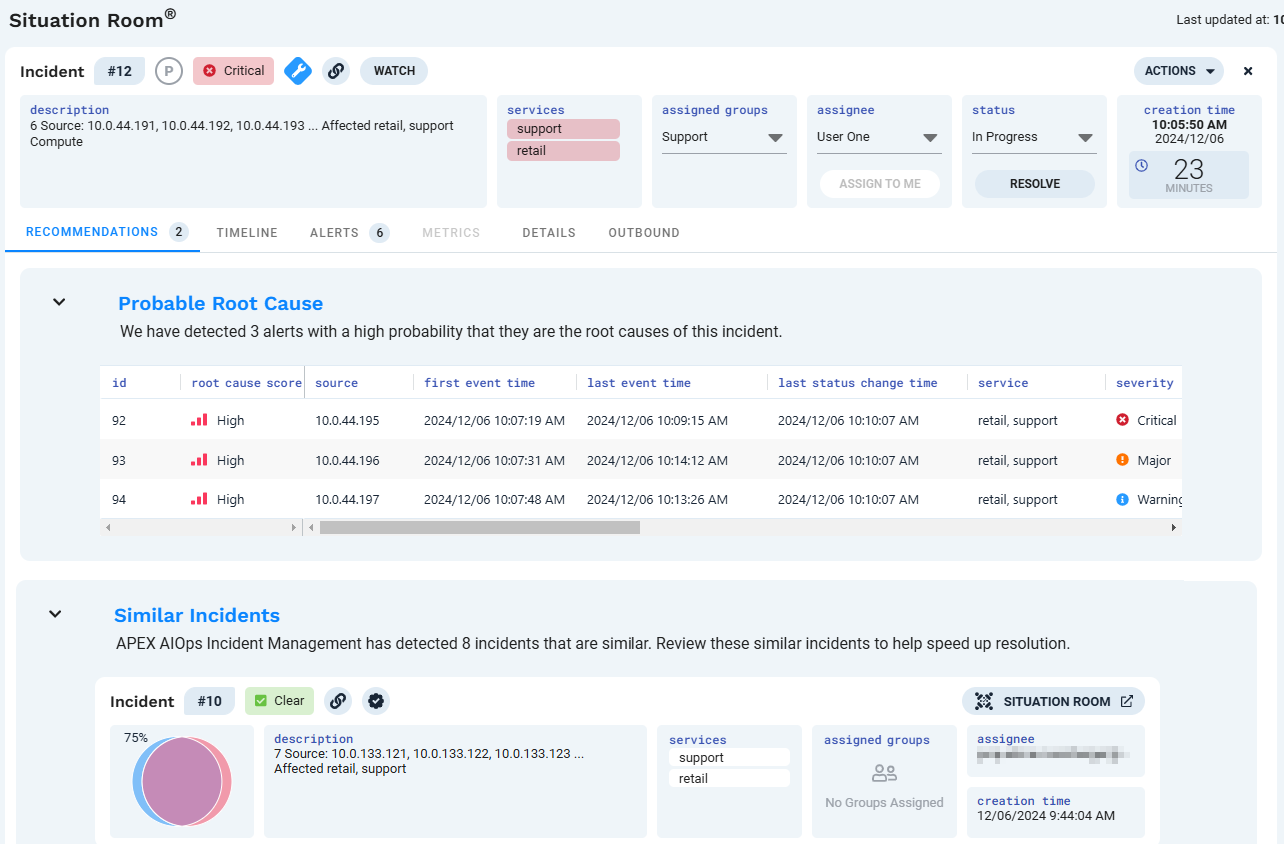
Situation Room opens to the Recommendations tab by default:
 |
Incident information
The top pane displays an overview of the selected incident (from left to right, top to bottom)
Element | Meaning |
|---|---|
Priority | Click the P icon to set or change the priority of this incident. |
Severity | Severity of the incident. The incident severity is the highest severity of any alert in that incident. |
Maintenance Window icon | For users with scheduled maintenance windows: Displays when an incident viewed in the Situation Room includes alerts that may have been affected by an active maintenance window. Hovering over the icon displays the number of maintenance windows potentially affecting the incident. Clicking the icon displays details about the maintenance window. |
Copy link to Incident | Click the chain link to copy the URL of this incident to your clipboard. |
Watch | Click Watch to add yourself to the the list of watchers. If you are already in the list of incident watchers, Watching displays instead, with a check mark beside it. |
Description | Auto-generated description of the incident, based on the TipThe description is user editable. Click inside the description to add a different description or edit the existing one, then click the check mark to save. Click Copy to copy the description for use elsewhere. Note that incident descriptions are limited to 1024 characters and are trimmed when they exceed this limit. |
Services | List of services related to the incident. This list is created from information in the alerts in the incident. If the list is abbreviated, click inside the services box to display the full list. |
Assigned Groups | Lists the groups assigned to this incident, if any. To assign a group to the incident, click inside the field under assigned groups and select one or more groups from the list. |
Assignee | Displays the name of the user assigned to the incident, if any. To assign a user to the incident, click inside the field under assignee and select a user to assign to the incident. |
Status | Current incident status. Click the button under the status field to change it. |
Creation Time | Timestamp which indicates when the correlation engine created this incident. Under the timestamp, the amount of time elapsed since the incident creation time displays. |
Recommendations
The Recommendations tab offers suggestions for ways to improve the resolution time for incidents. Prompts on this tab include:
A reminder to assign a user to incidents with no user assignment
Up to five alerts in the incident with system-estimated "high" root cause scores, determined to be the most likely root causes by Probable Root Cause model
For more information on using Probable Root Cause, see Probable Root Cause overview.
Up to 10 resolved incidents similar to the one you are currently viewing
For more information on using similar incidents, see Review Situation Room recommendations. You can configure the criteria used to determine if incidents are similar using the Similar Incidents feature.
For resolved incidents, a reminder to add resolving steps and root cause feedback, if these items are missing
Recommendations can help Incident Management users resolve issues more quickly by identifying related issues sooner.
Reminders to add missing information help to ensure users include a complete incident history to use when resolving future incidents. The root cause and similar incident suggestions help you to resolve the current incident more quickly using this information.
Timeline tab
The incident timeline is a visual list of all changes to an incident, whether directly to the incident or indirectly through changes to alerts.
There are two parts to the Timeline:
Chart
The chart portion of the timeline gives you an at-a-glance visualization of when updates occurred within an incident in relation to each other.
List
The list portion of the tab corresponds to the items in the chart, but with greater detail. For any resource (such as alerts, and correlation definitions) you can click the external link icon to view more details about the item.
For detailed information on the Timeline tab, see Analyze incidents with the Situation Room Timeline.
Alerts, Metrics, Details and Outbound tabs
Other tabs include:
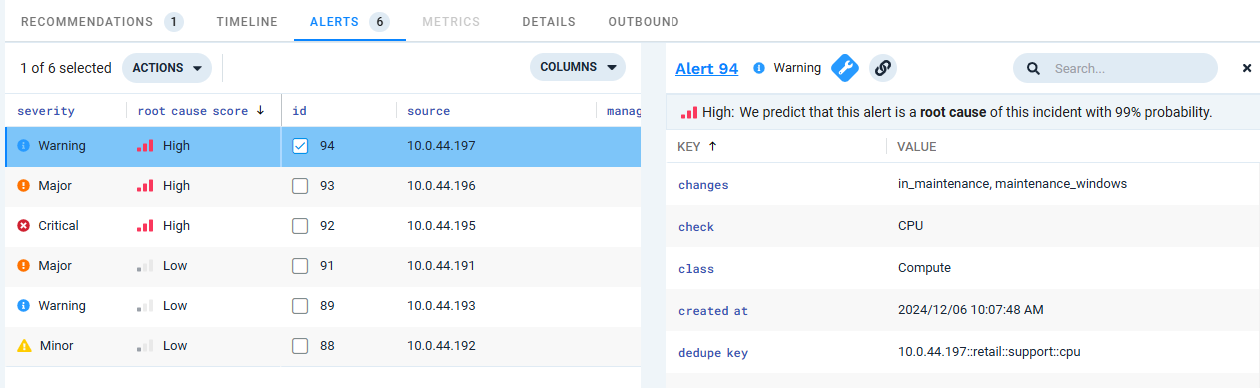
Alerts
A list of alerts which are part of the incident and their details. Clicking an alert in the list opens the details for that alert to the right:
You can use the right-click menu to perform the same actions on alerts in this pane that you can perform on the Alerts page. For details, refer to Use right-click alert actions and the Actions menu.
The Actions menu on the Alerts tab additionally has options for working with root cause feedback labels. This option is only available for the Actions menu on the Situation Room Alerts tab. See Provide root cause feedback.
Notes
The Situation Room Alerts tab is always sorted on the
root cause scorecolumn. Sorting additional columns will add additional column sorts, but one of the sorts will always be theroot cause scorecolumn.You can multi-sort up to 5 columns.
Change the sort priority of a column by using SHIFT+Click on the sort direction arrow.
The
root cause scorecolumn cannot be removed from the displayed columns.
Metrics
Charts showing the anomalies responsible for creating the alerts on the Alerts tab. For metrics data only.
Details
The fields and values from the incident payload.
Outbound
Applicable for outbound events only—information relating to each alert from an outbound integration displays.
See Understand alerts and alert details and Understand incidents for further explanation of alert and incident fields and their meanings.