Collector plugins
APEX AIOps Incident Management includes multiple plugins for the collector. You can view all of the available plugins on the Integrations page, or on the Plugins tab of a collector.
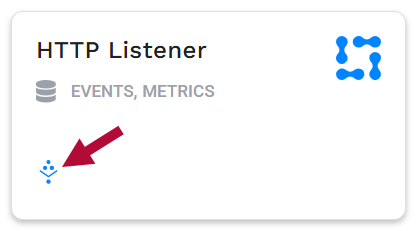
Collector plugins are identified by this icon:
To enable a collector plugin, you must first install a collector. See Install a Linux or MacOS collector or Install a Windows OS collector for instructions on setting up a new collector.
To enable a new plugin on a collector:
Navigate to the Inbound Integrations > Collectors.
Select the target collector in the list, and then click the Plugins tab.
All of the available collector plugins are listed on the Plugins tab.
Click the plugin in the list you want to add.
The configuration dialog appears. View the related plugin documentation pages following this topic for help completing plugin configurations.
You can set up a collector plugin when you download a new collector, or any time thereafter when configuring an existing collector.
The Incident Management Collector supports a number of plugins for ease of integration with AIOps software platforms. These plugins include: AppDynamics, Docker, HTTP Listener, MongoDB, New Relic, Prometheus Scrape, and Redis. Locate and click the plugin name in the left-hand navigation of this documentation for instructions on configuring these plugins.
The System plugin instructions are included here as it is currently the only plugin that will be configured and enabled by default immediately after installing a collector. All other plugins must be configured and enabled to begin collecting metrics.
System plugin
The System plugin observes server performance by collecting metrics for resources such as CPU, memory, disk, and network utilization.
This plugin is based on the vector.dev Host plugin. See Host metrics.
Note
By default, the System plugin is enabled for all new downloaded Incident Management Collectors.
Parameter configuration:
From the System plugin Configuration tab, define the following System plugin parameters:
Metrics — Define the set of metrics Incident Management collects by selecting option(s) from the dropdown menu: CPU | Disk | Filesystem | Load | Host | Memory
Scrape Interval (sec): — Set the frequency with which Incident Management monitors and ingests metrics; the default is every 15 seconds.
Toggle on the Enable option on when you are ready to start plugin data ingestion.