Install a Windows OS collector
The APEX AIOps Incident Management Collector is an agent that observes time-series metrics and sends the metrics to Incident Management. You can install the collector on Windows, Linux, or MacOS. With the installation of an Incident Management Collector on the system of your choice, you can quickly gather relevant metrics about your systems.
You can use a Windows collector in combination with enabled plugins to collect a variety of metrics on a Windows system. You can quickly collect general system metrics using the System plugin, which is installed and enabled by default when you install a collector.
See Install a Linux or MacOS collector for information on installing on Linux or MacOS.
Before installing an Incident Management Collector
Before you begin, you must:
Be familiar with Windows Services.
Set up your Windows system environment variables.
NOTE: You can do this either before or after installation.
Have a Windows administrator account.
Enable all Windows disk counters to get Windows disk metrics.
To do this:
You need to be a member of the Administrators local group. See your Windows OS documentation for more information.
Open a command prompt or PowerShell terminal on your Windows system.
Run the
diskperf -ycommand.
Install the Incident Management Collector on a Windows OS
To install a collector on a Windows system:
Navigate to Integrations > Inbound Integrations.
If necessary, click Add Integration to display all the integrations.
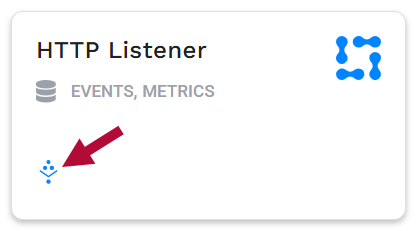
Click a collector plugin tile.
Note that collector plugins are identified by the collector ingestion method symbol.
In the dialog that appears, click the download a new collector link.
Click the Installation tab and select the Windows platform from the installation options on the left.
The Incident Management Collector runs on the following Windows versions:
Windows OS version 7, 8.1, 10, and 11.
Windows Server 2019 and Windows Server 2022.
Click Download to download the
collector-0.20.1-x64.msi(or later) file on your Windows system.Proceed to the next section and run the Collector Startup Wizard.
Run the Collector Startup Wizard in Windows
To run the Collector Startup Wizard:
On your target Windows system, navigate to the location where you saved the
.msifile, then click it to run the wizard.The default user for the
.msifile is set as a Windows administrator, so you must have a Windows administrator role to run the installer.In the wizard, read and accept the License Agreement. Then, select a custom destination folder, or use the default.
The default Destination Folder is
C:\Program Files\Moogsoft\.You can select a different destination folder; however, you can only install one Incident Management Collector per system.
On the Windows installer page in Incident Management, click the API keys link.
The API Key Management page opens.
Generate an API key and copy it to an accessible location.
Assign the following permissions to the key:
Credentials: Full access
Integrations: Full access
User: Full access
Copy the Base URL from the Windows installer page and the API Key that you generated and paste them into the corresponding fields in the installation wizard.
Click Install, Next, and Finish to complete the installation.
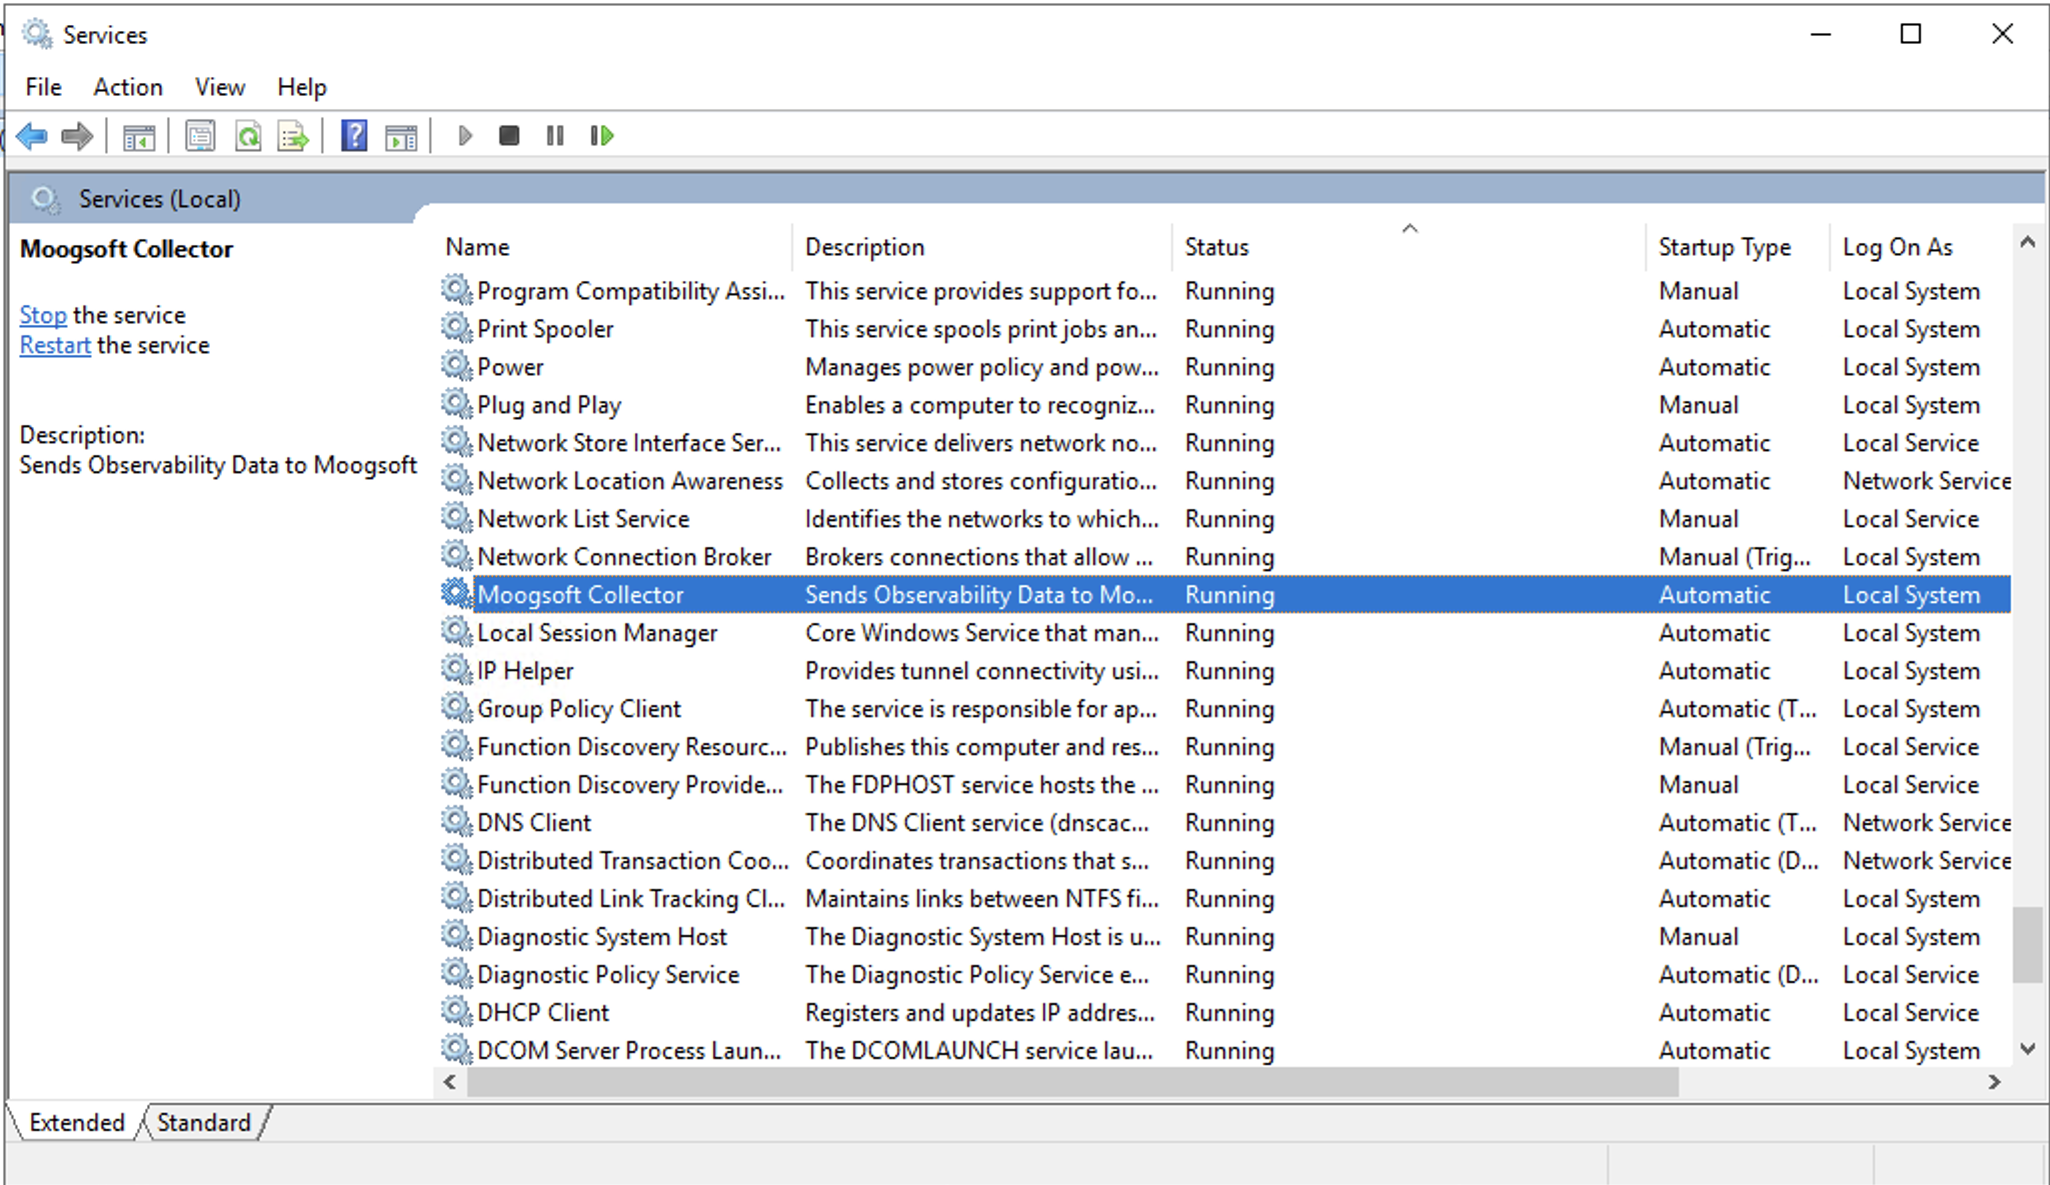
Use the Windows Control Panel, or any of the other Windows methods, to access Windows Services. Find Moogsoft Collector in the list of services, and confirm the Status for the collector is Running.
The following image shows the Windows Services > View > Details option.
After it is installed and running on Windows, the collector name appears in the Collectors list. Since the Incident Management System plugin is enabled by default on all collectors, Incident Management Metrics will also display selected Windows metrics.
Note
You can access the list of collectors by navigating to Integrations > Inbound Integrations > Collectors. The list of collectors displays, plus the collector OS types, advanced configurations, and plugins.
Start, stop and remove a Windows collector
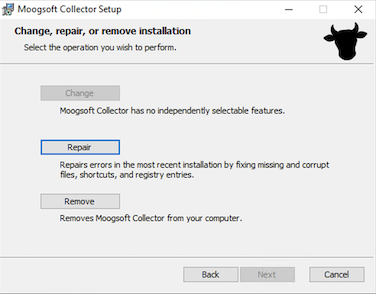
You can start or restart, stop, and remove a Windows collector using Windows system sc commands. For detailed instructions, refer to Collector Operations. As shown in the following image, you can also run the Windows Collector wizard to repair or remove the Windows collector.
 |
Validate your Windows collector installation
Check the Collectors list and verify the Windows Collector is listed.
View the collector logs by navigating to Integrations > Inbound Integrations > Collectors > specific collector > Collector Logs. Local logs are not available for the Windows collector.
Check Incident Management metrics to validate that you are receiving Windows data. The System plugin is enabled by default for all Incident Management Collector installations, so you should get system metrics such as
host_boot_timefrom your Windows system.
Troubleshoot your Windows collector installation
In some rare cases, the collector service can enter a starting state that never completes. To check if this is happening on your server, run the sc.exe query vector command. The following example shows a vector process in a START_PENDING STATE.
1 PS C:\Program Files\Moogsoft> sc.exe query vector
2
3 SERVICE_NAME: vector
4        TYPE               : 10  WIN32_OWN_PROCESS
5        STATE              : 2  START_PENDING
6                                (NOT_STOPPABLE, NOT_PAUSABLE, IGNORES_SHUTDOWN)
7        WIN32_EXIT_CODE    : 0  (0x0)
8        SERVICE_EXIT_CODE  : 0  (0x0)
9        CHECKPOINT         : 0x0
10       WAIT_HINT          : 0x7d0
When this occurs, you should use the following steps to remove the task and allow you to uninstall/reinstall or restart the service.
Open a Windows command prompt or PowerShell terminal.
Run the command
taskkill /IM "collector.exe" /F.This command ends any running process with a name that matches that of the collector.
Configure a collector plugin
To enable a specific plugin for your Windows collector:
Go to Integrations > Inbound Integrations > Collectors.
Click one of the collectors in the list.
On the Plugins tab, click the plugin to install.
Use the default configuration, or change the configuration for that plugin, and then click Enable.
Note
You can find detailed instructions on configuring specific plugins in Configuring a Collector plugin.
Incident Management Collectors can be started or restarted, stopped, and deleted. Plugins can be enabled or disabled. For detailed instructions, refer to Collector Operations.