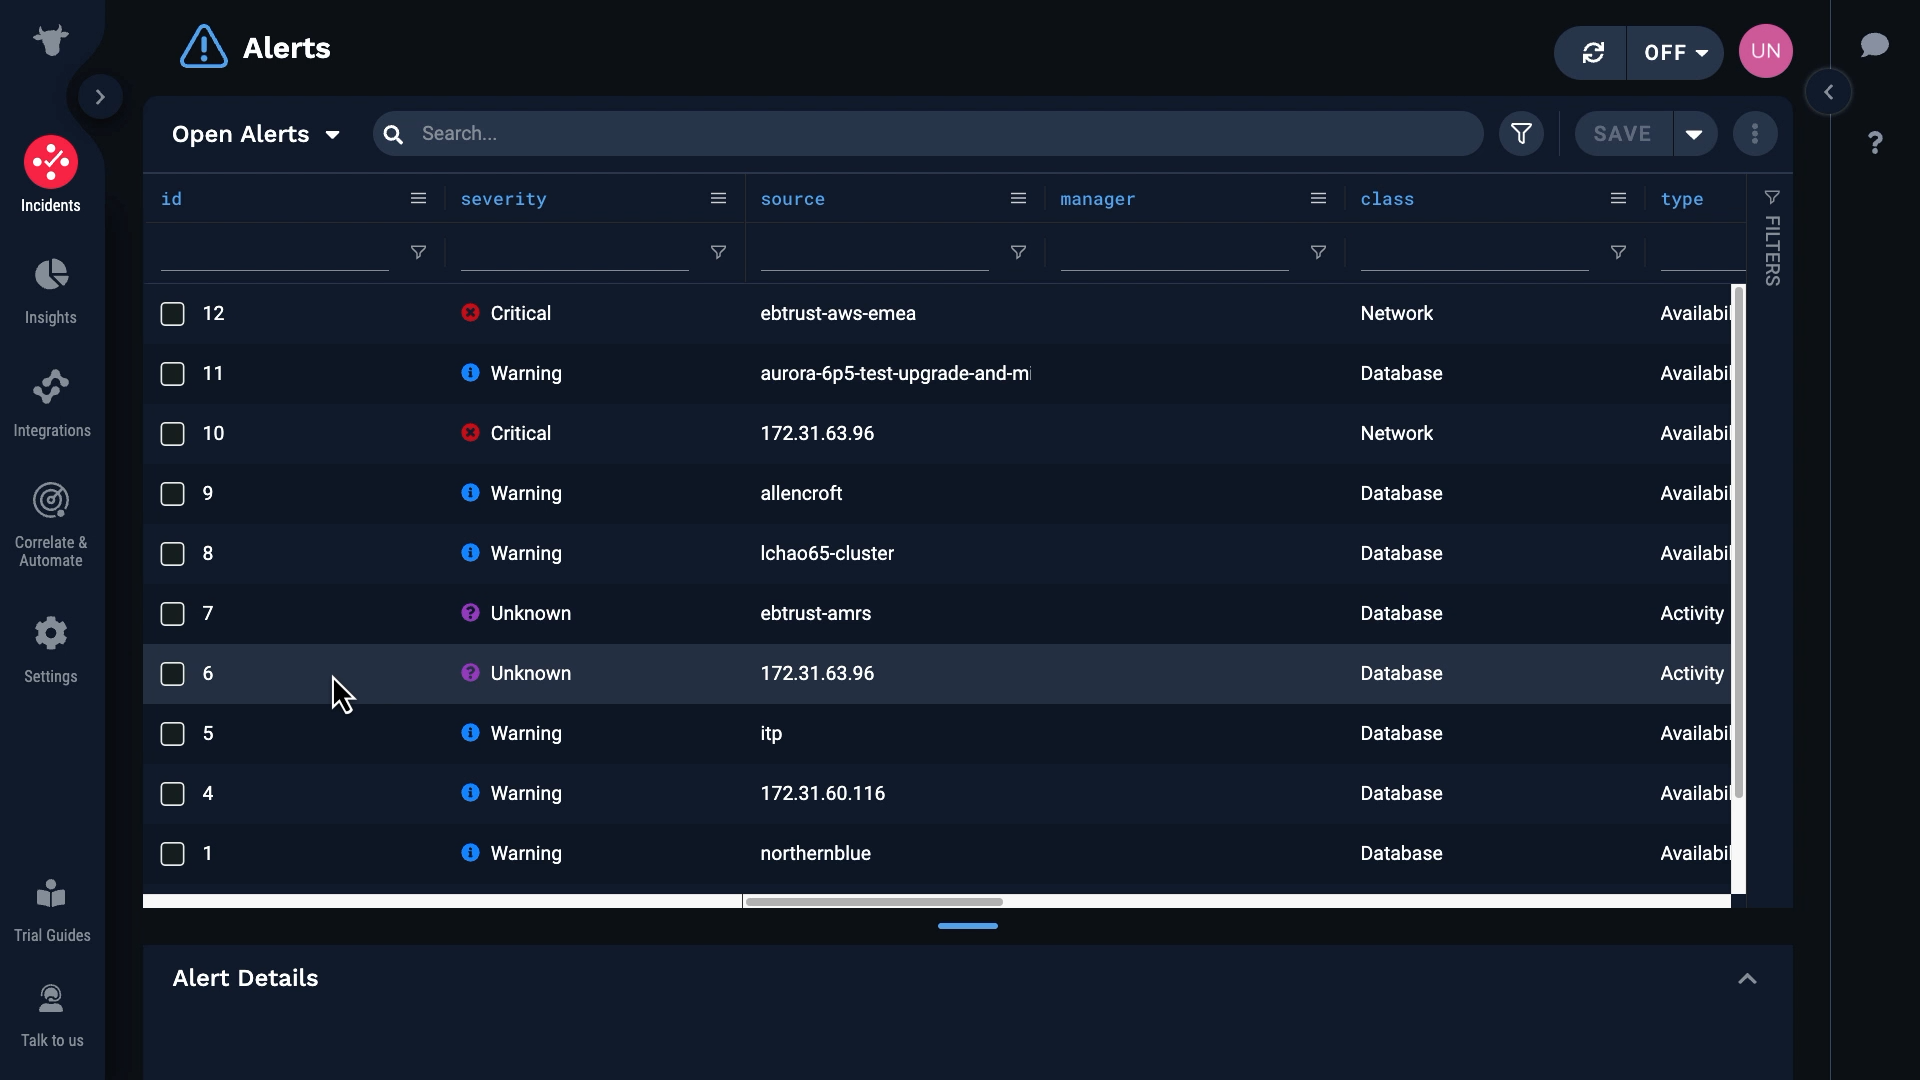
Demo video: Create a custom integration ►
*Please note Moogsoft is now part of Dell's IT Operations solution called APEX AIOps, and changed its name to APEX AIOps Incident Management. The UI in this video may differ slightly but the content covered is still relevant.
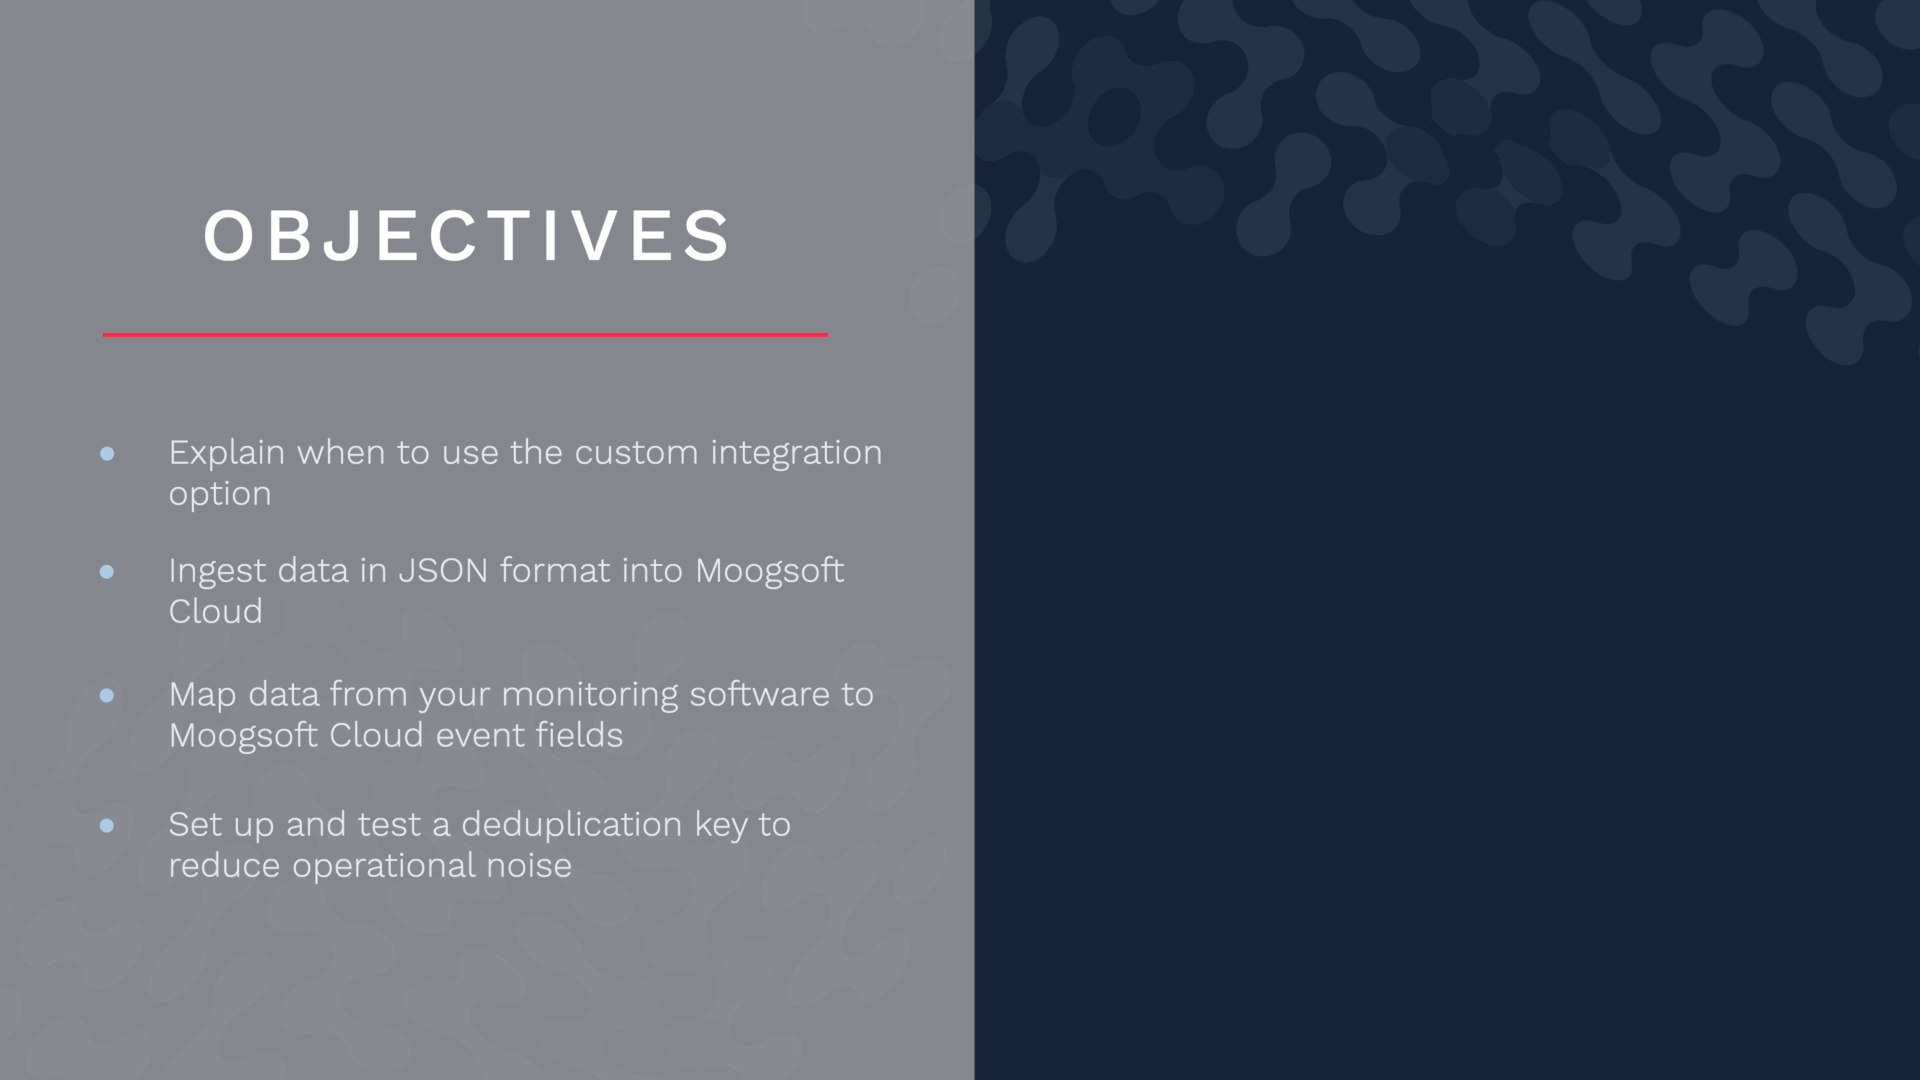
After watching this video, you will be able to configure a custom integration to bring data from your monitoring source into Incident Management. You will be able to identify when to choose this over other integration options, ingest data in JSON format into Incident Management, map data from your monitoring software to Incident Management event fields, and set up and test a deduplication key to reduce operational noise.
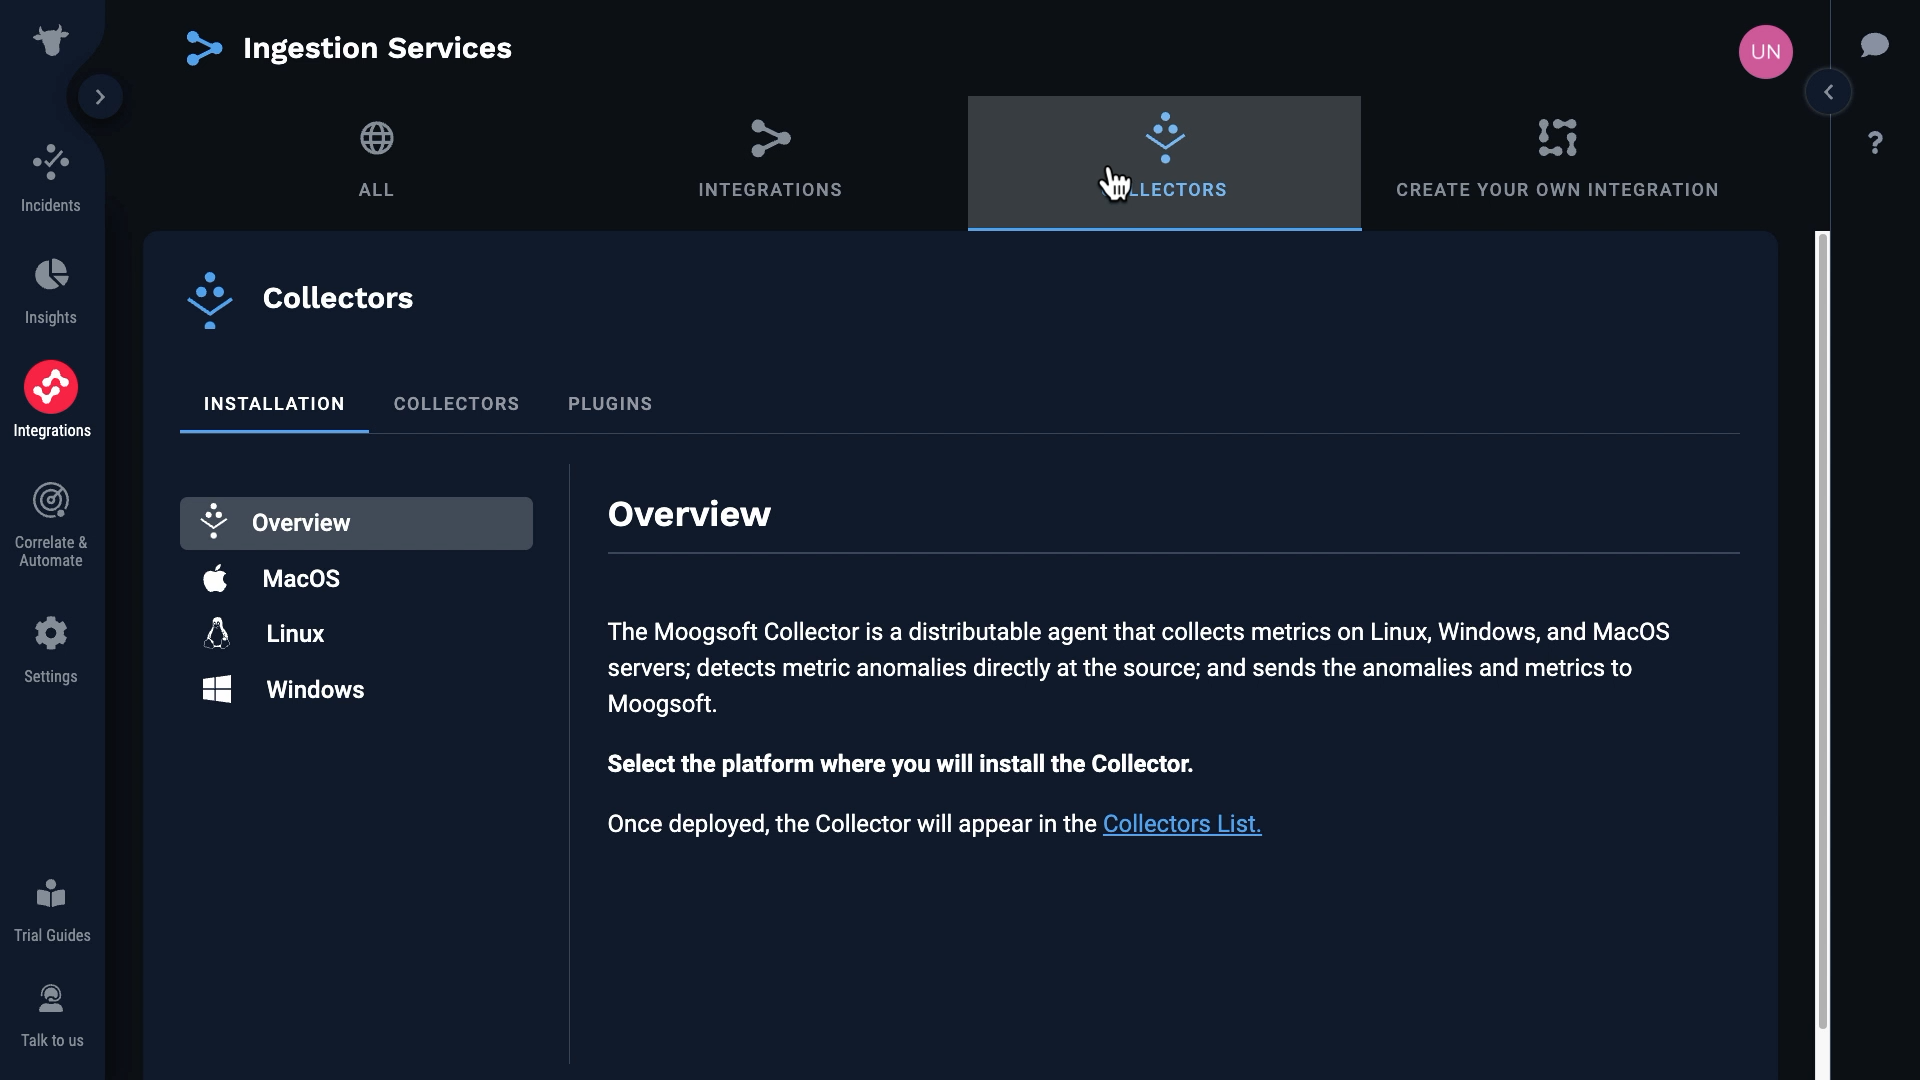
Incident Management offers a few different ways to ingest source data. You can install a data collector to the system you want to monitor...
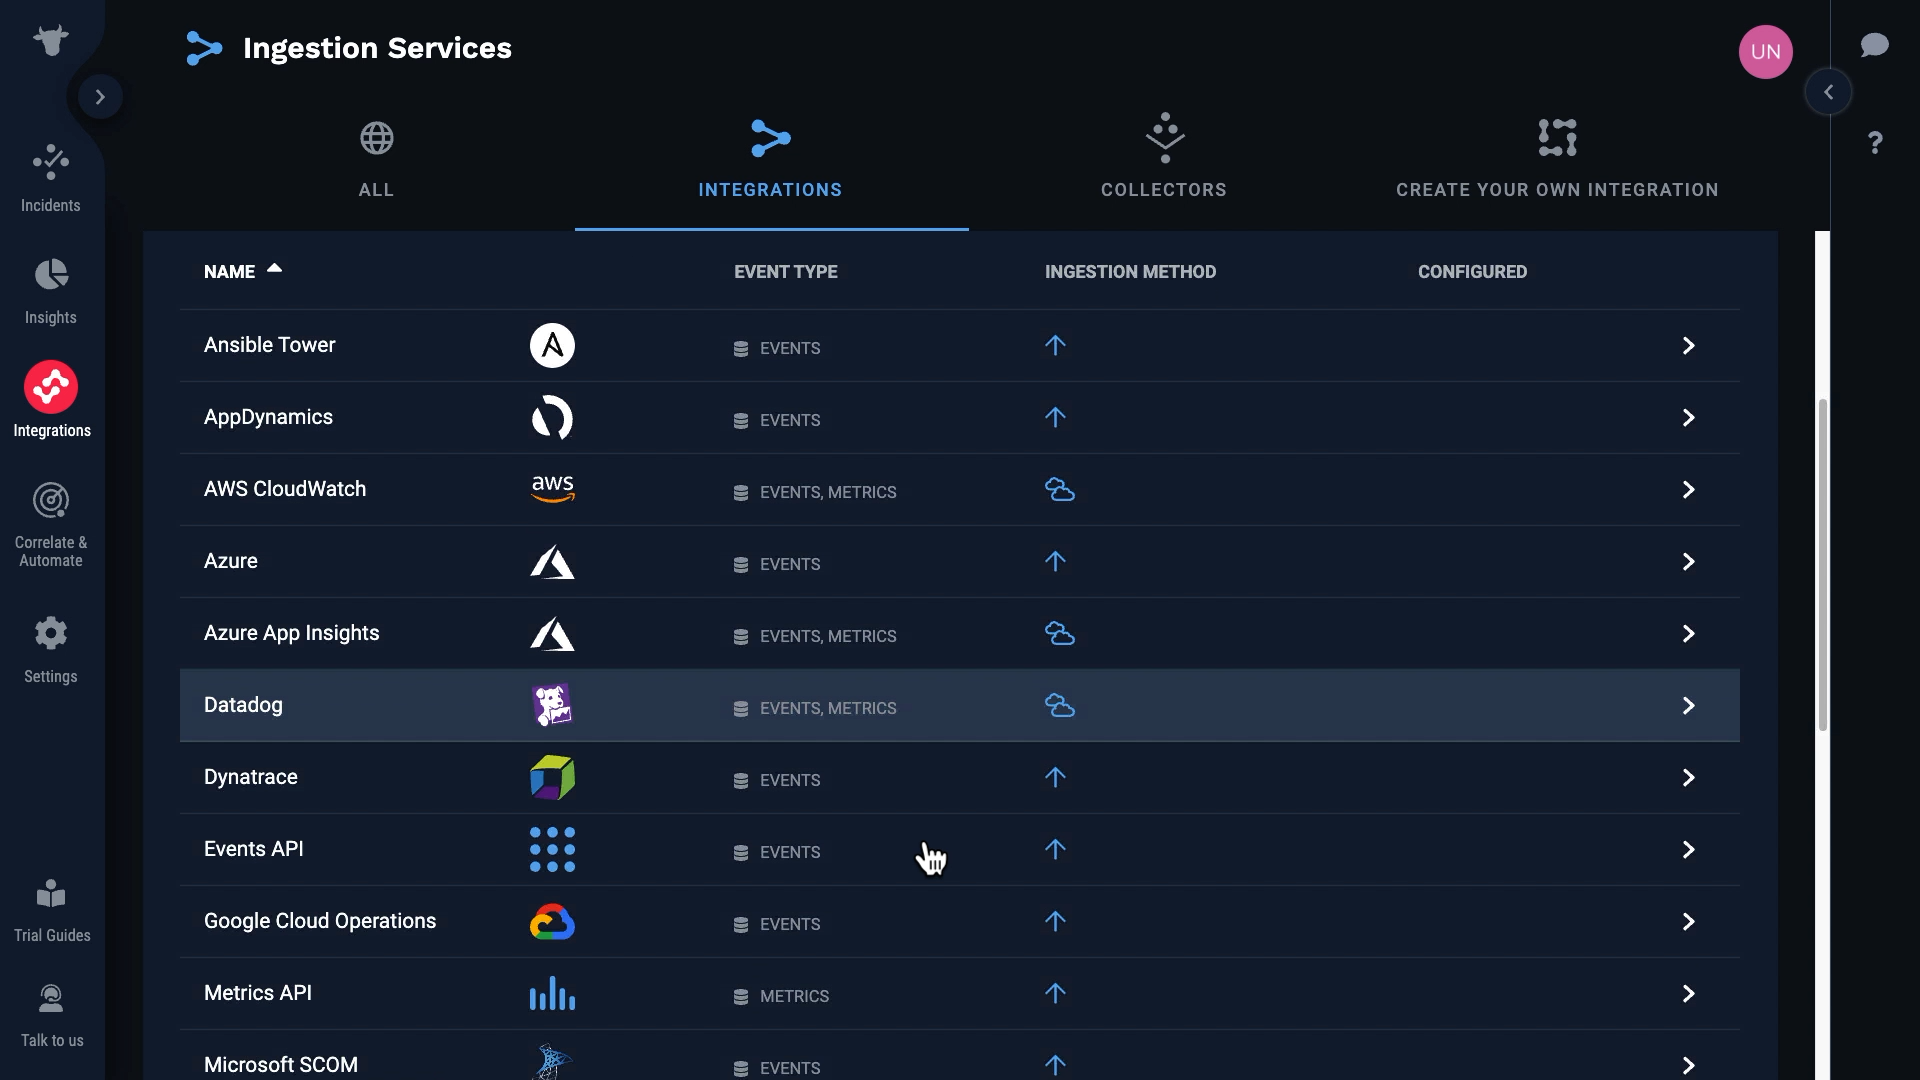
...or integrate with specific monitoring tools.
Or you can build your own custom integration. You should choose a custom integration when there is no collector for your environment, and there is no specific integration available for your monitoring tool.
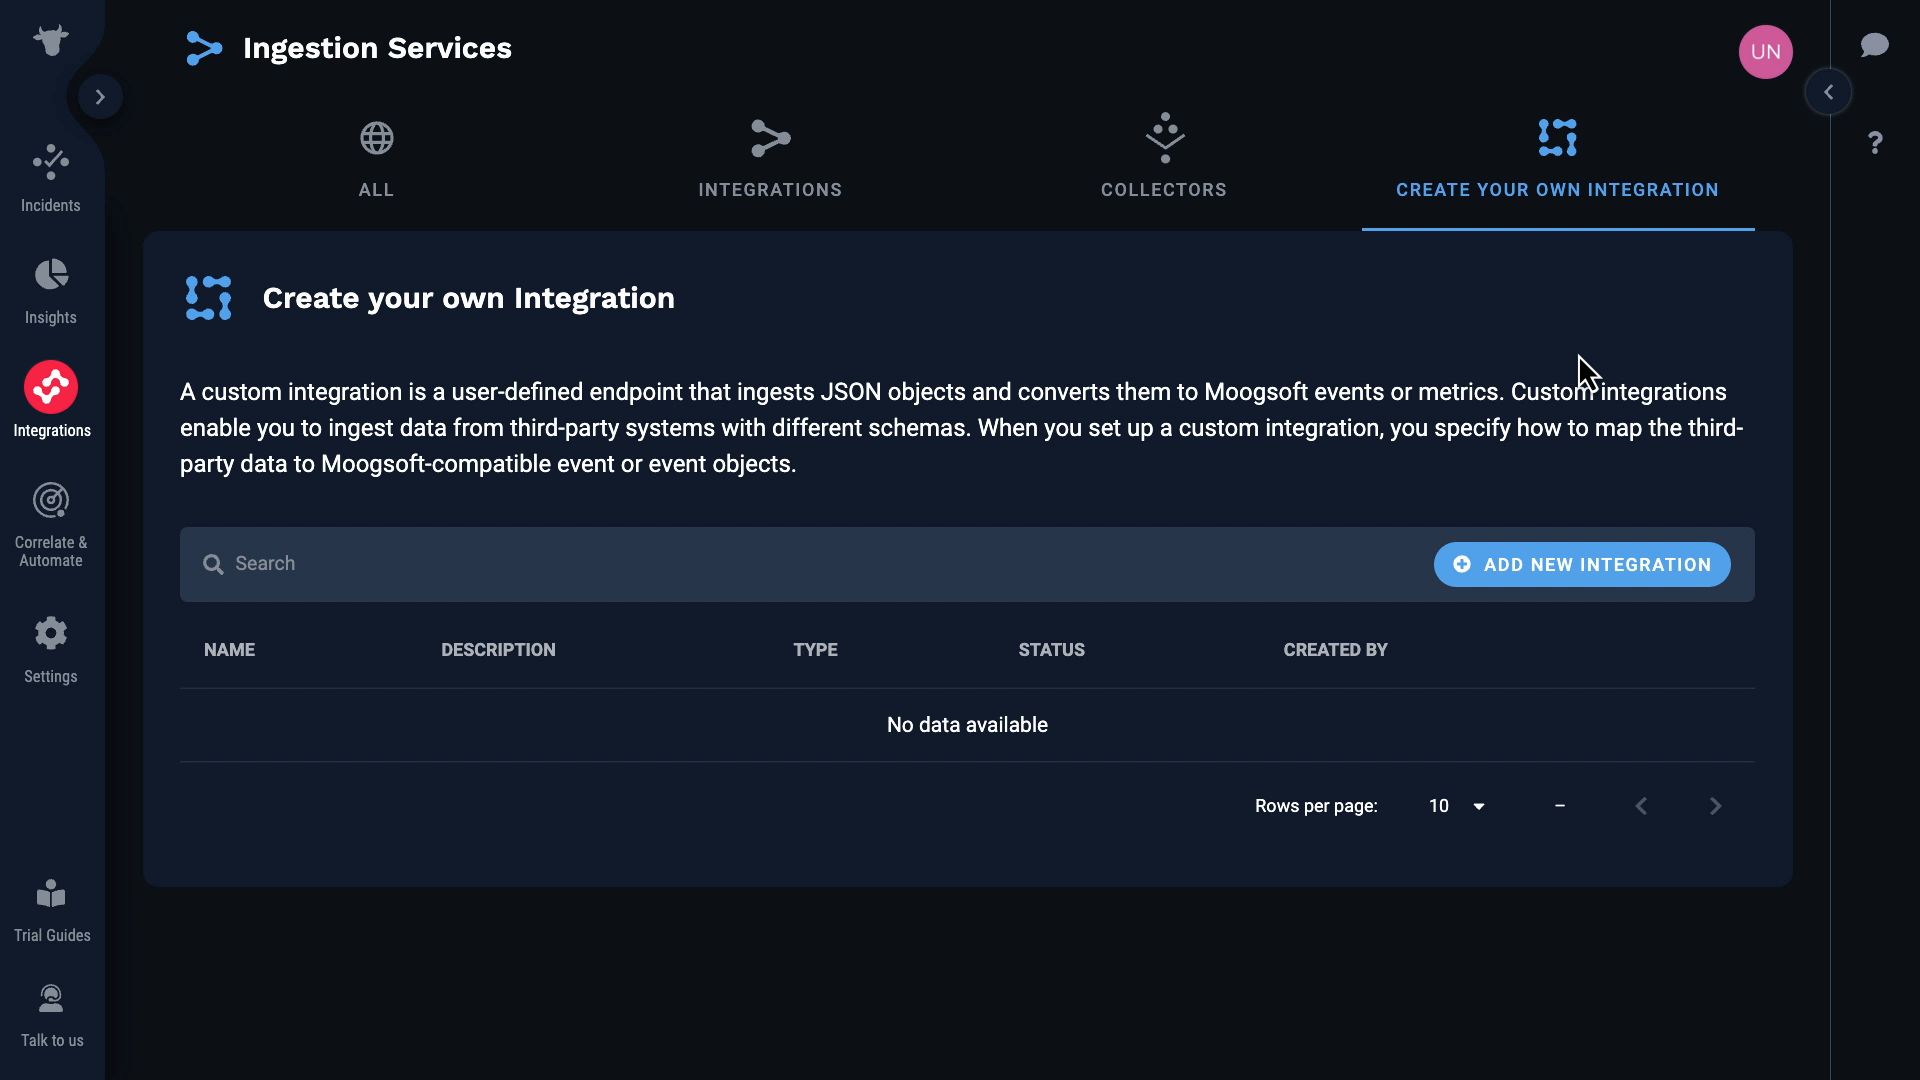
Creating your own integration has several benefits. First, you are not limited to particular monitoring tools. You can set up a custom integration with any monitoring source that can send data in JSON format.
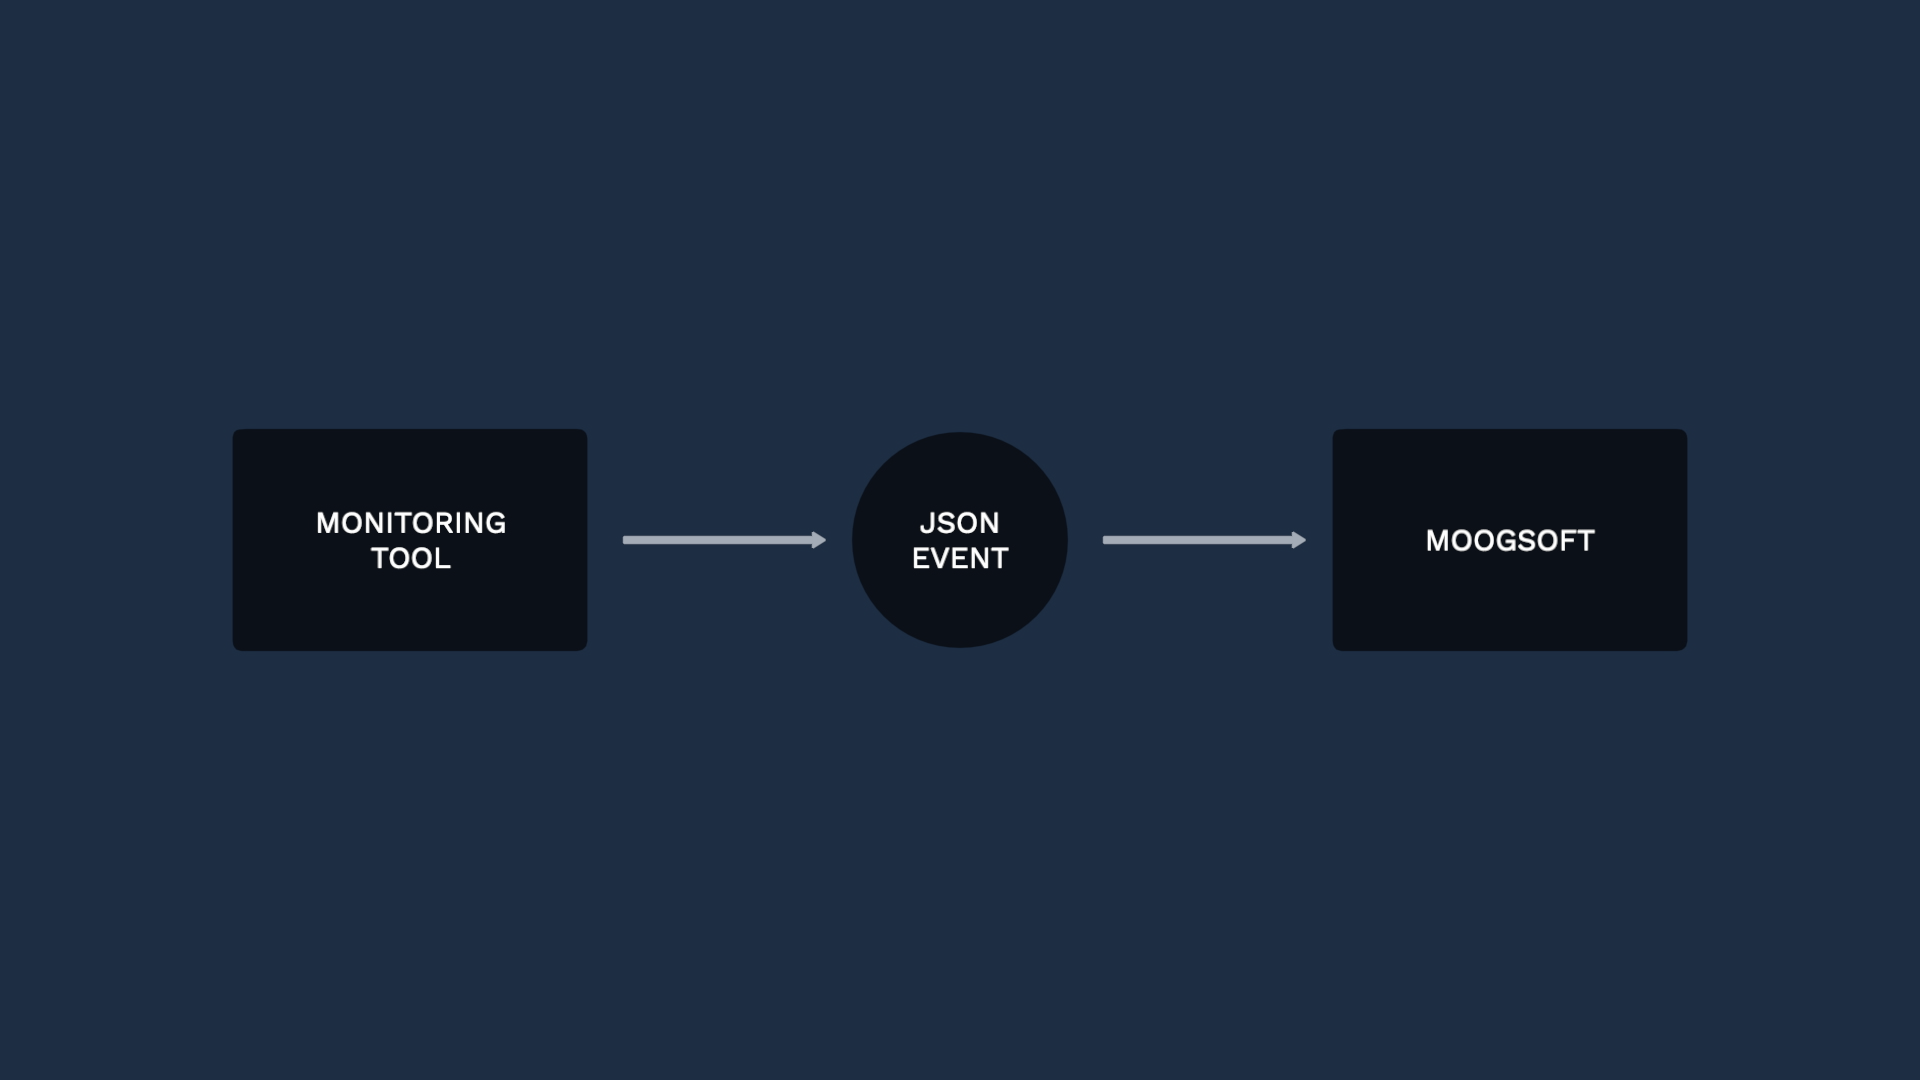
Second, you will use real data to design and test your integration. The Create Your Own Integration feature makes it easy to inspect source data before you map it.
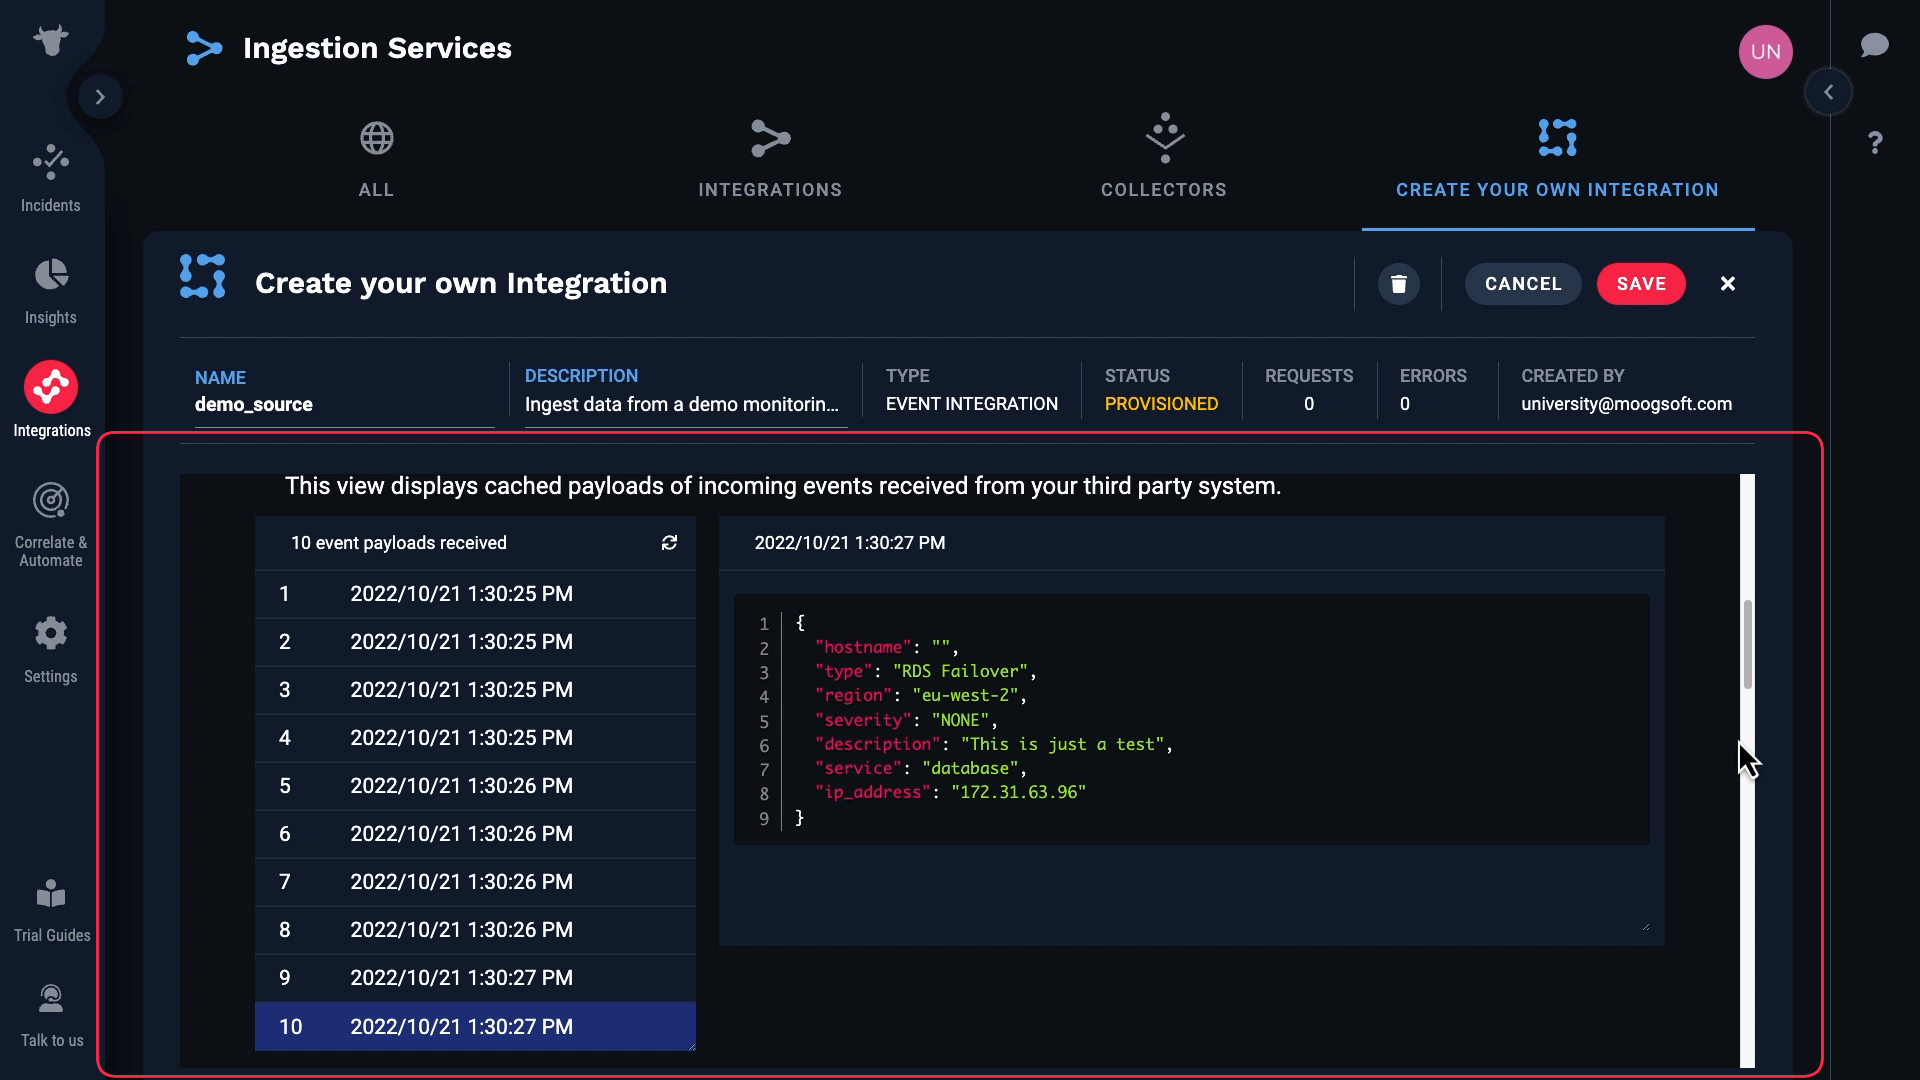
And finally, creating a custom integration is simple. When you configure a webhook in a monitoring tool, you usually have to write code to modify the outgoing data payload. The Create Your Own Integration feature does all the mapping right in the Incident Management user interface, with no code.
After you have ingested data using a custom integration, you can transform and enrich it using the Incident Management Workflow Engine. Still without writing any code.
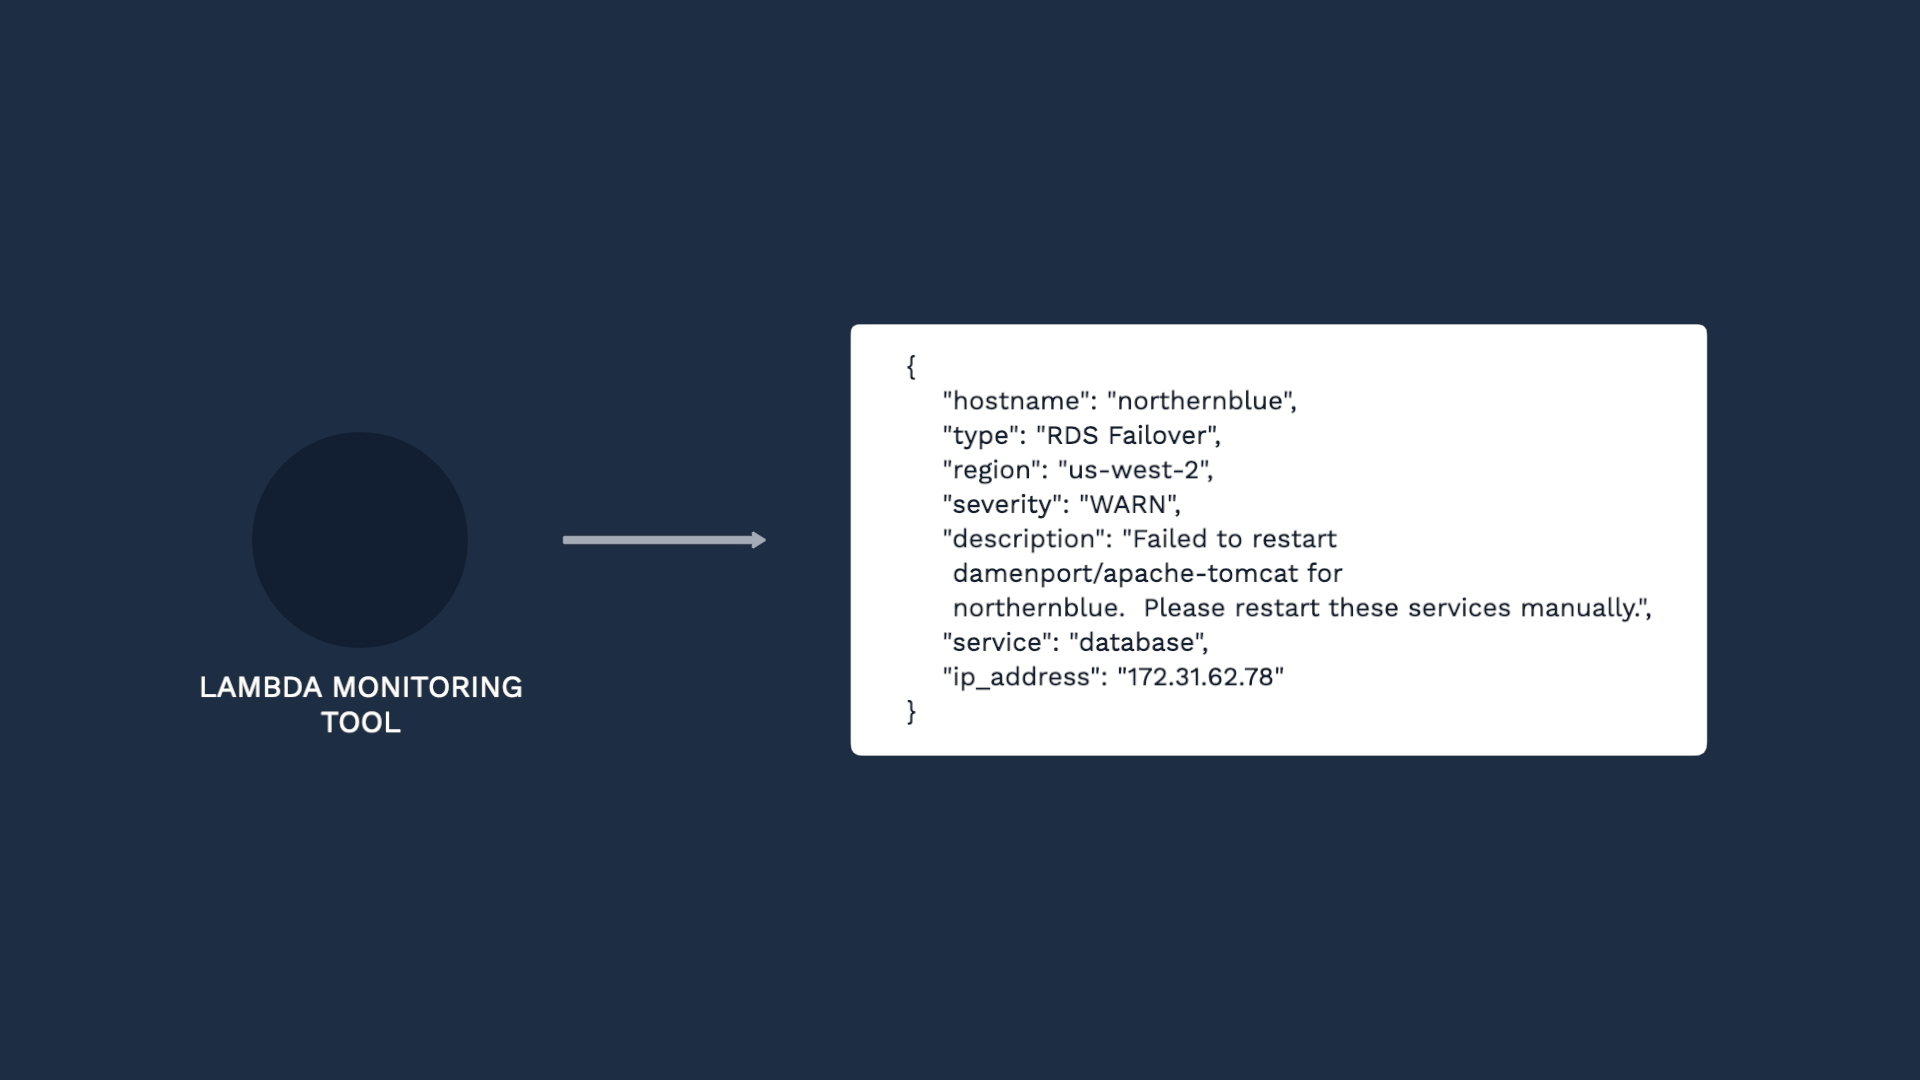
Let’s step through setting up a custom integration together. Let’s say we have source data in JSON format that’s structured like this:
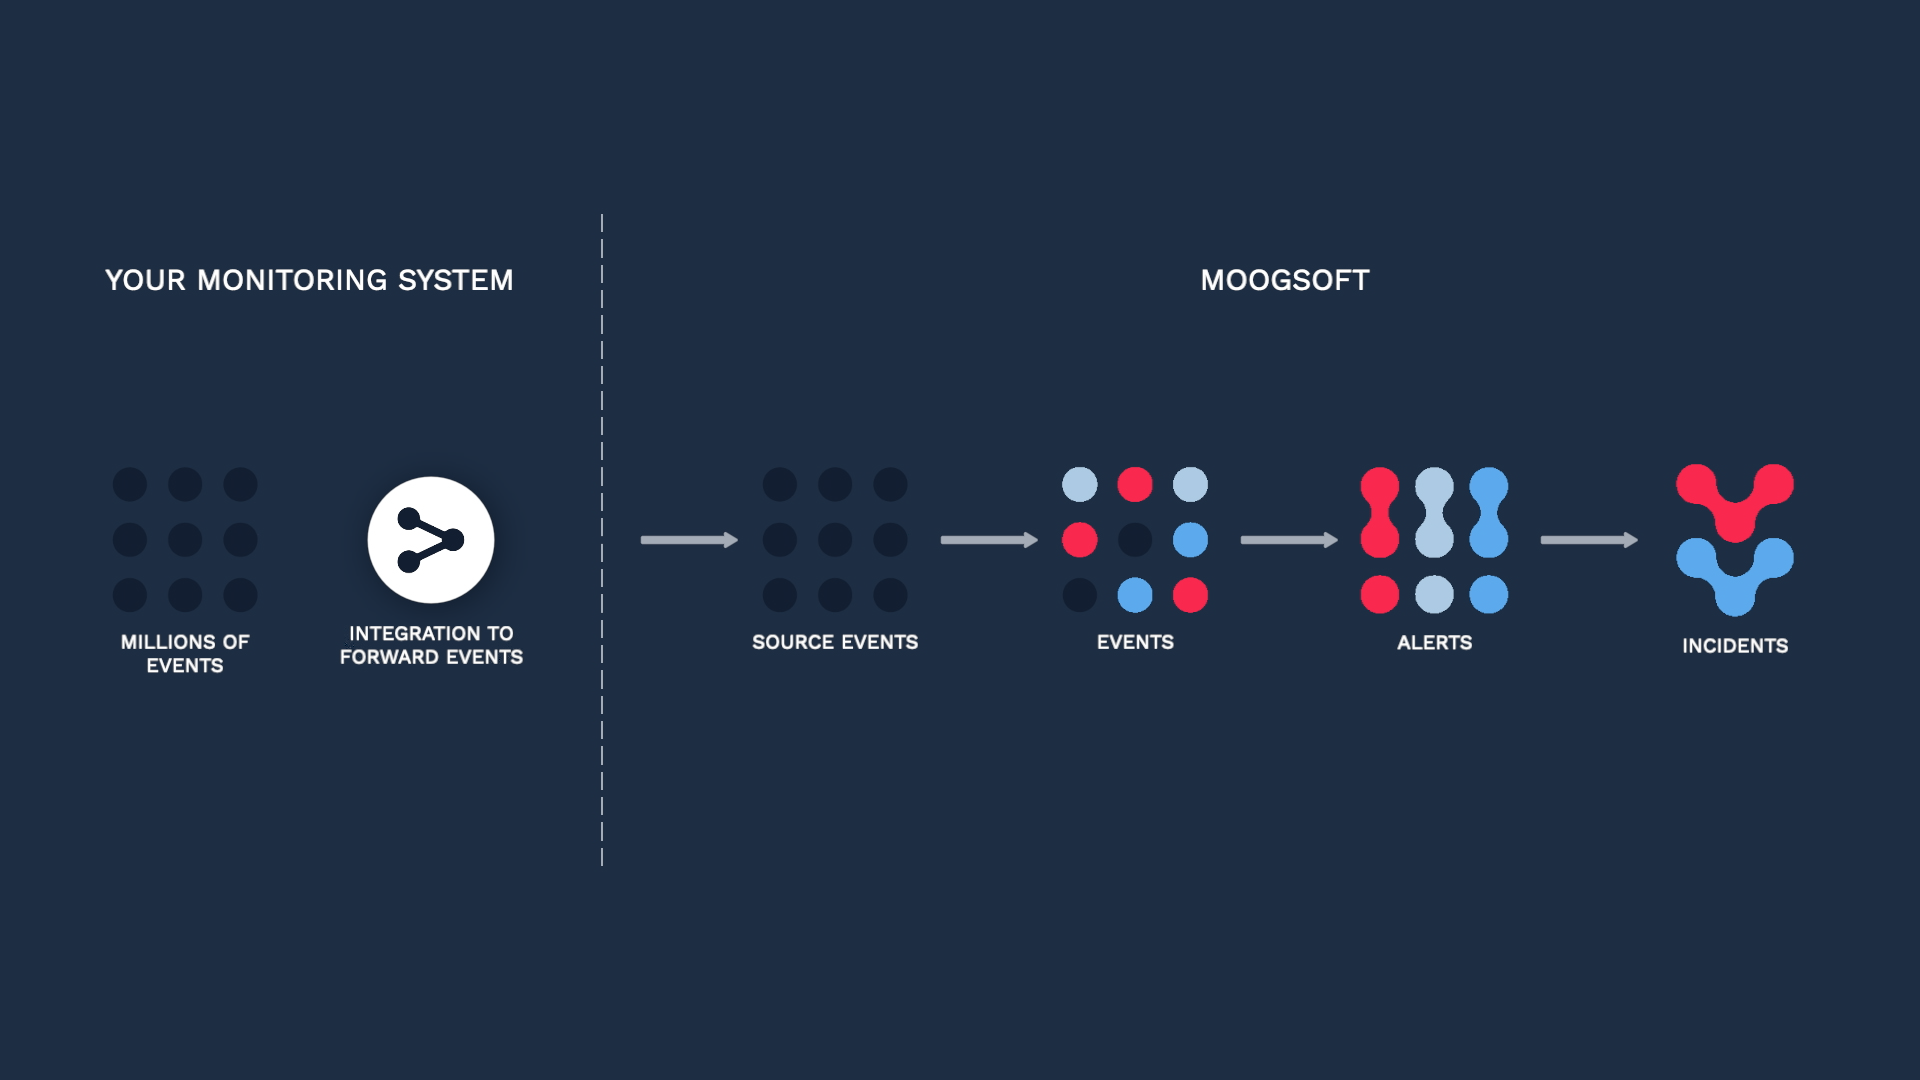
We want to ingest the events so we can deduplicate and correlate them in Incident Management.
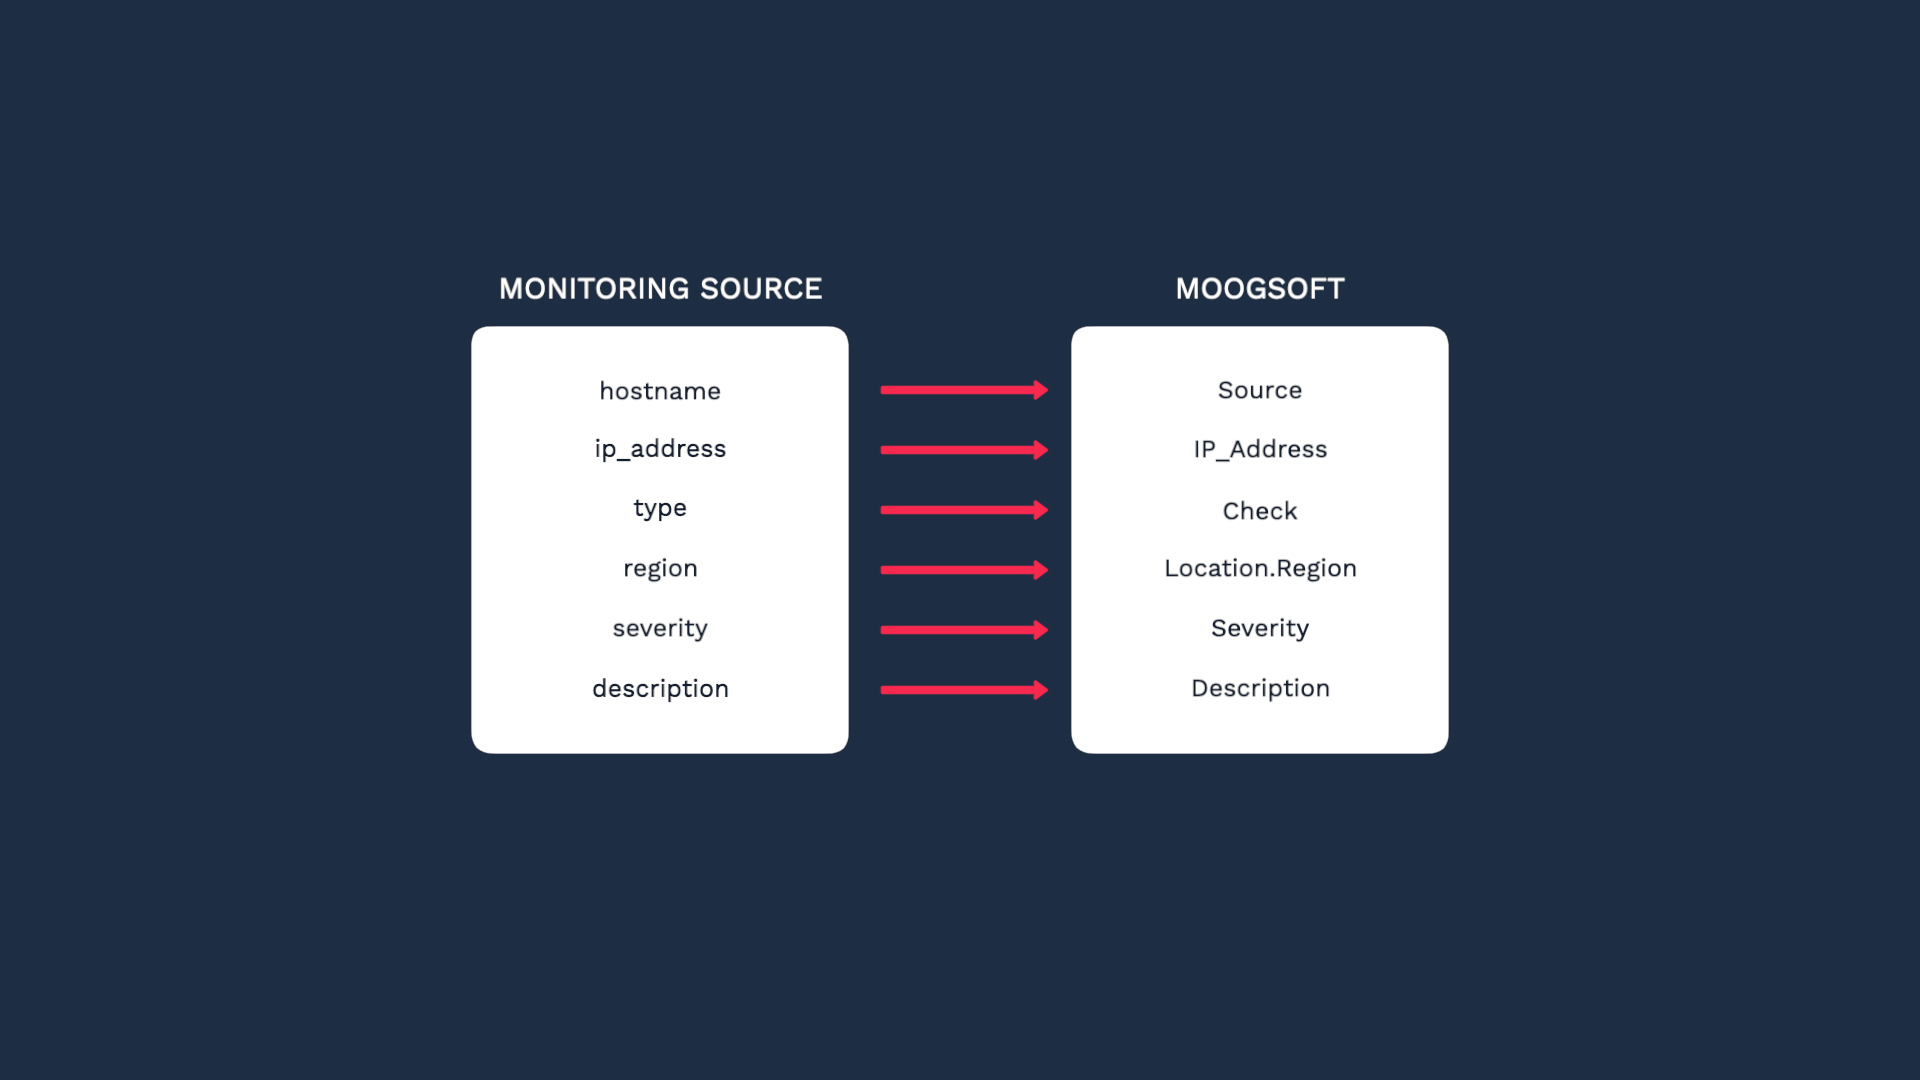
And we need to map them to the Incident Management event fields.
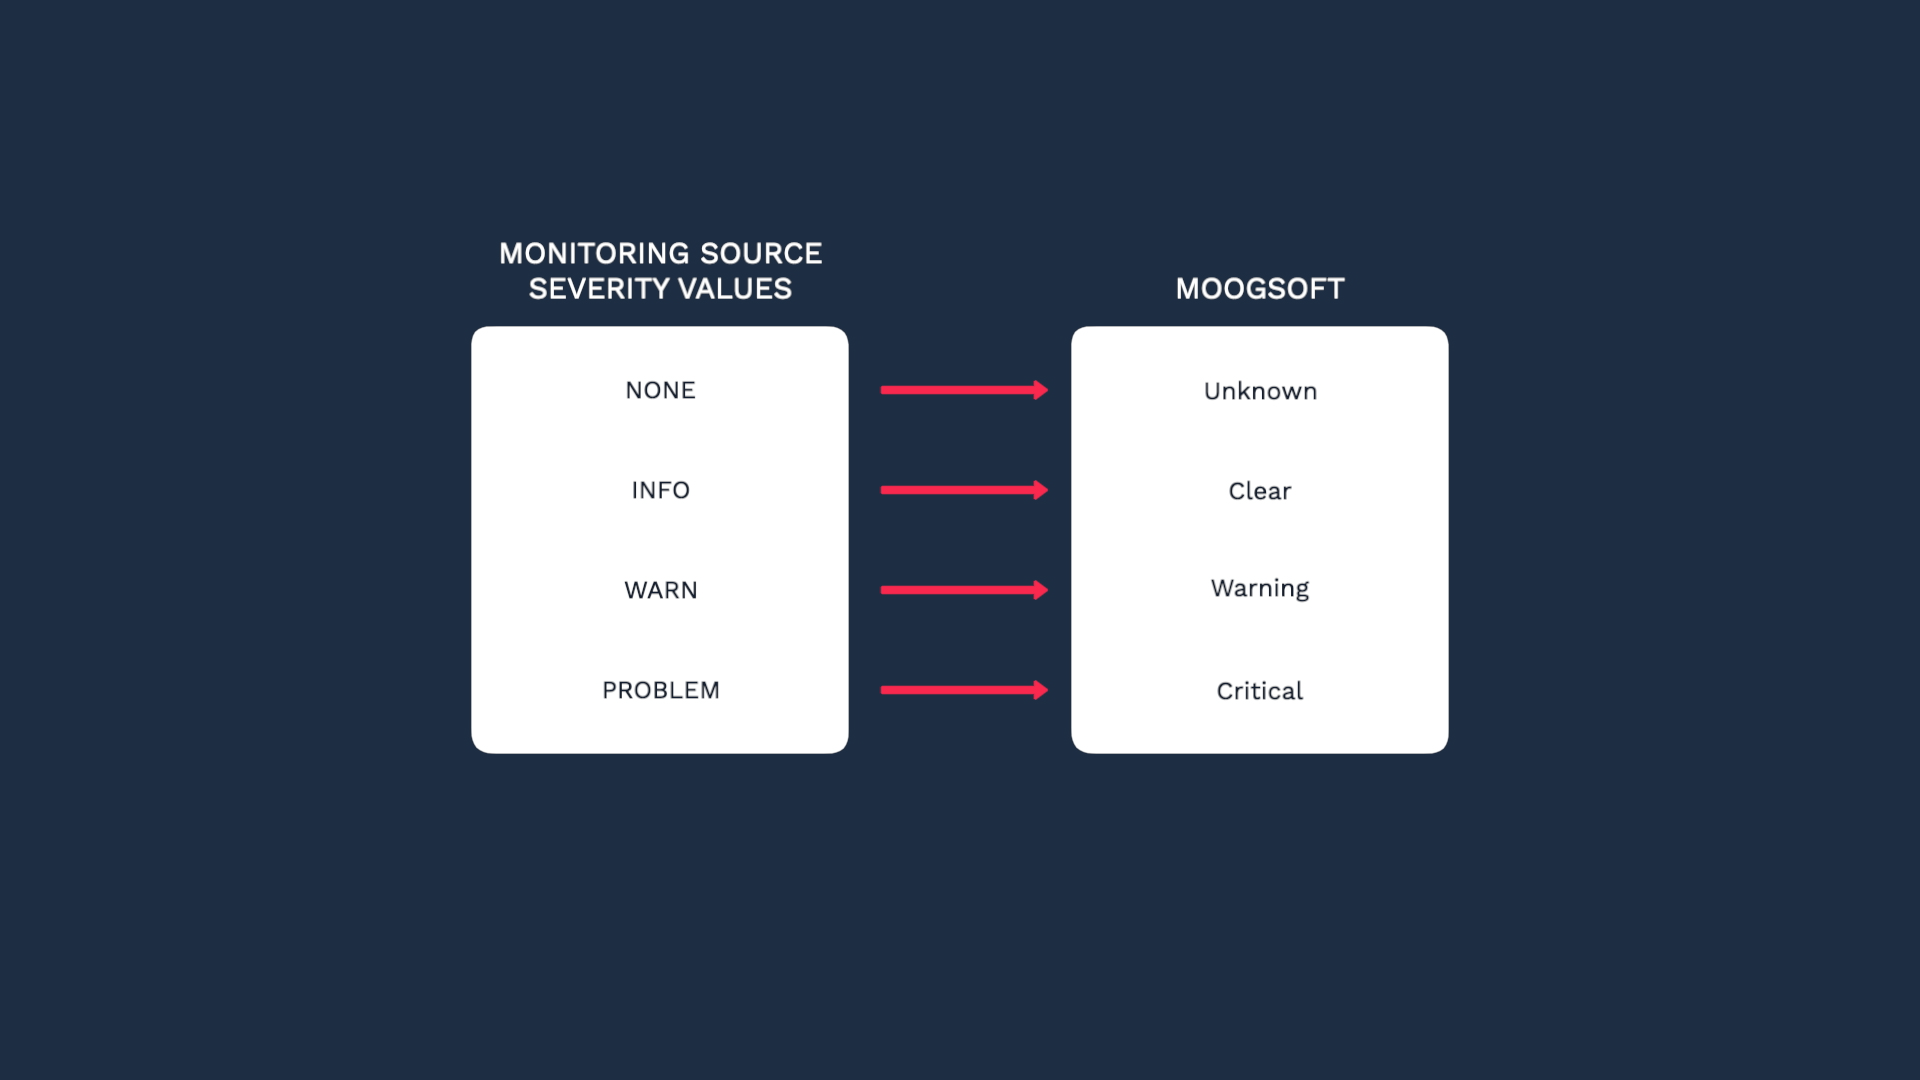
We also want to map the values for severity. Our source events only have four severity levels: NONE, INFO, WARN, and PROBLEM. We want to map these values to Incident Management severity levels like this.
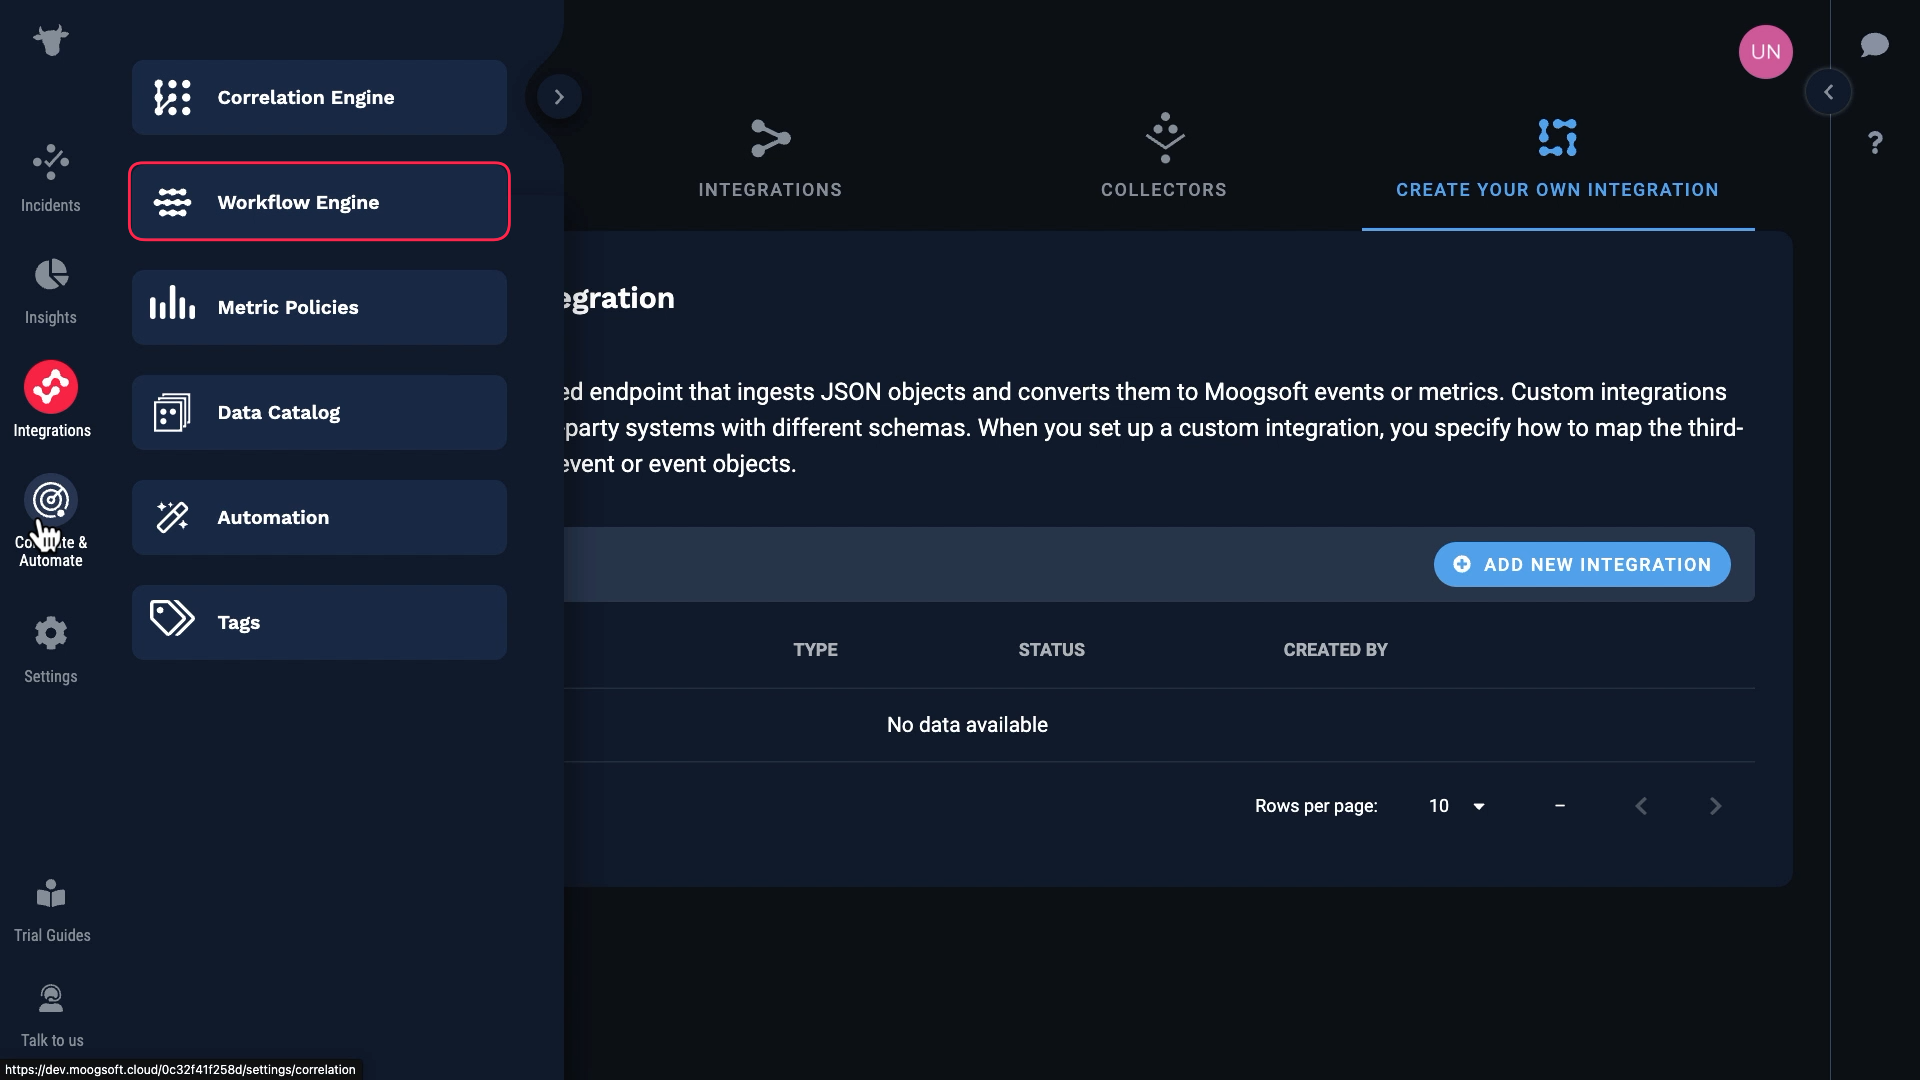
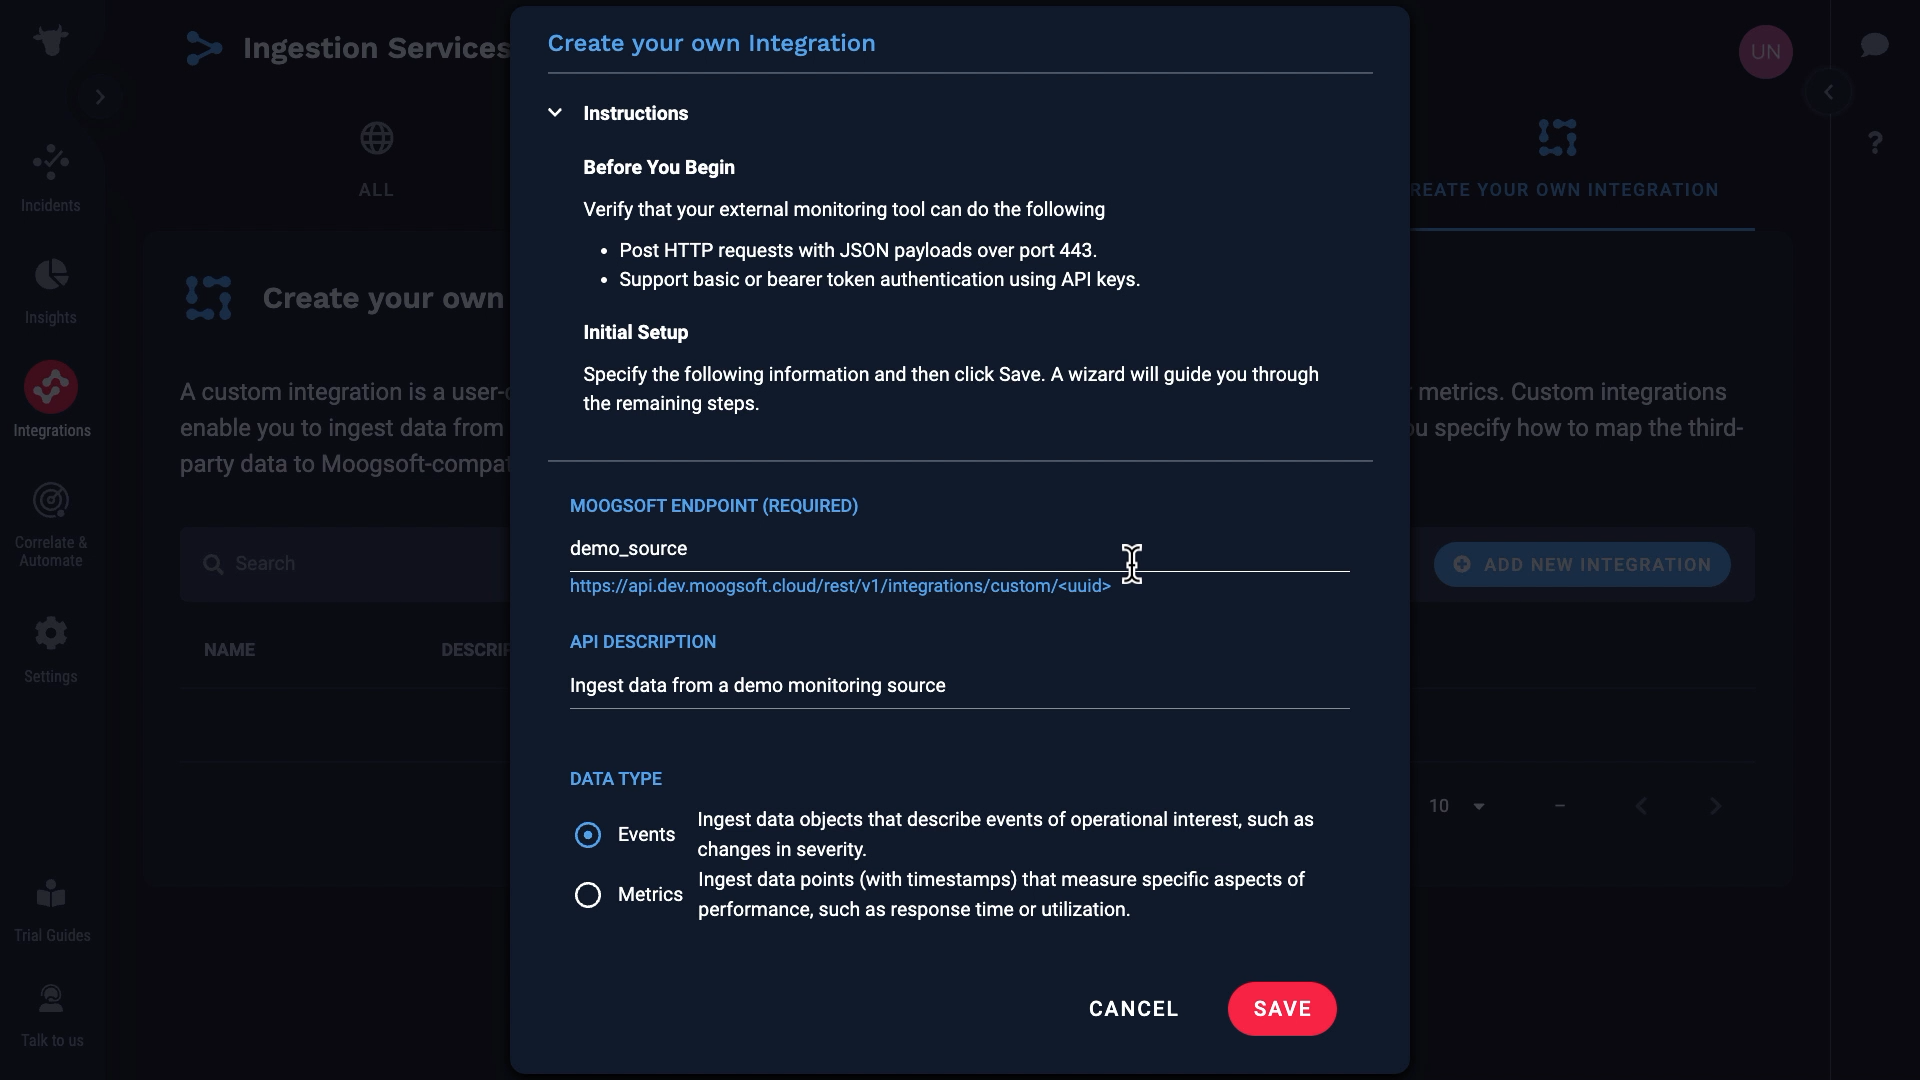
This is where you can set up a custom data ingestion. We are going to set up a new integration. Our source data in this example events, but note that we support metrics also.
We just created a custom endpoint for our integration.
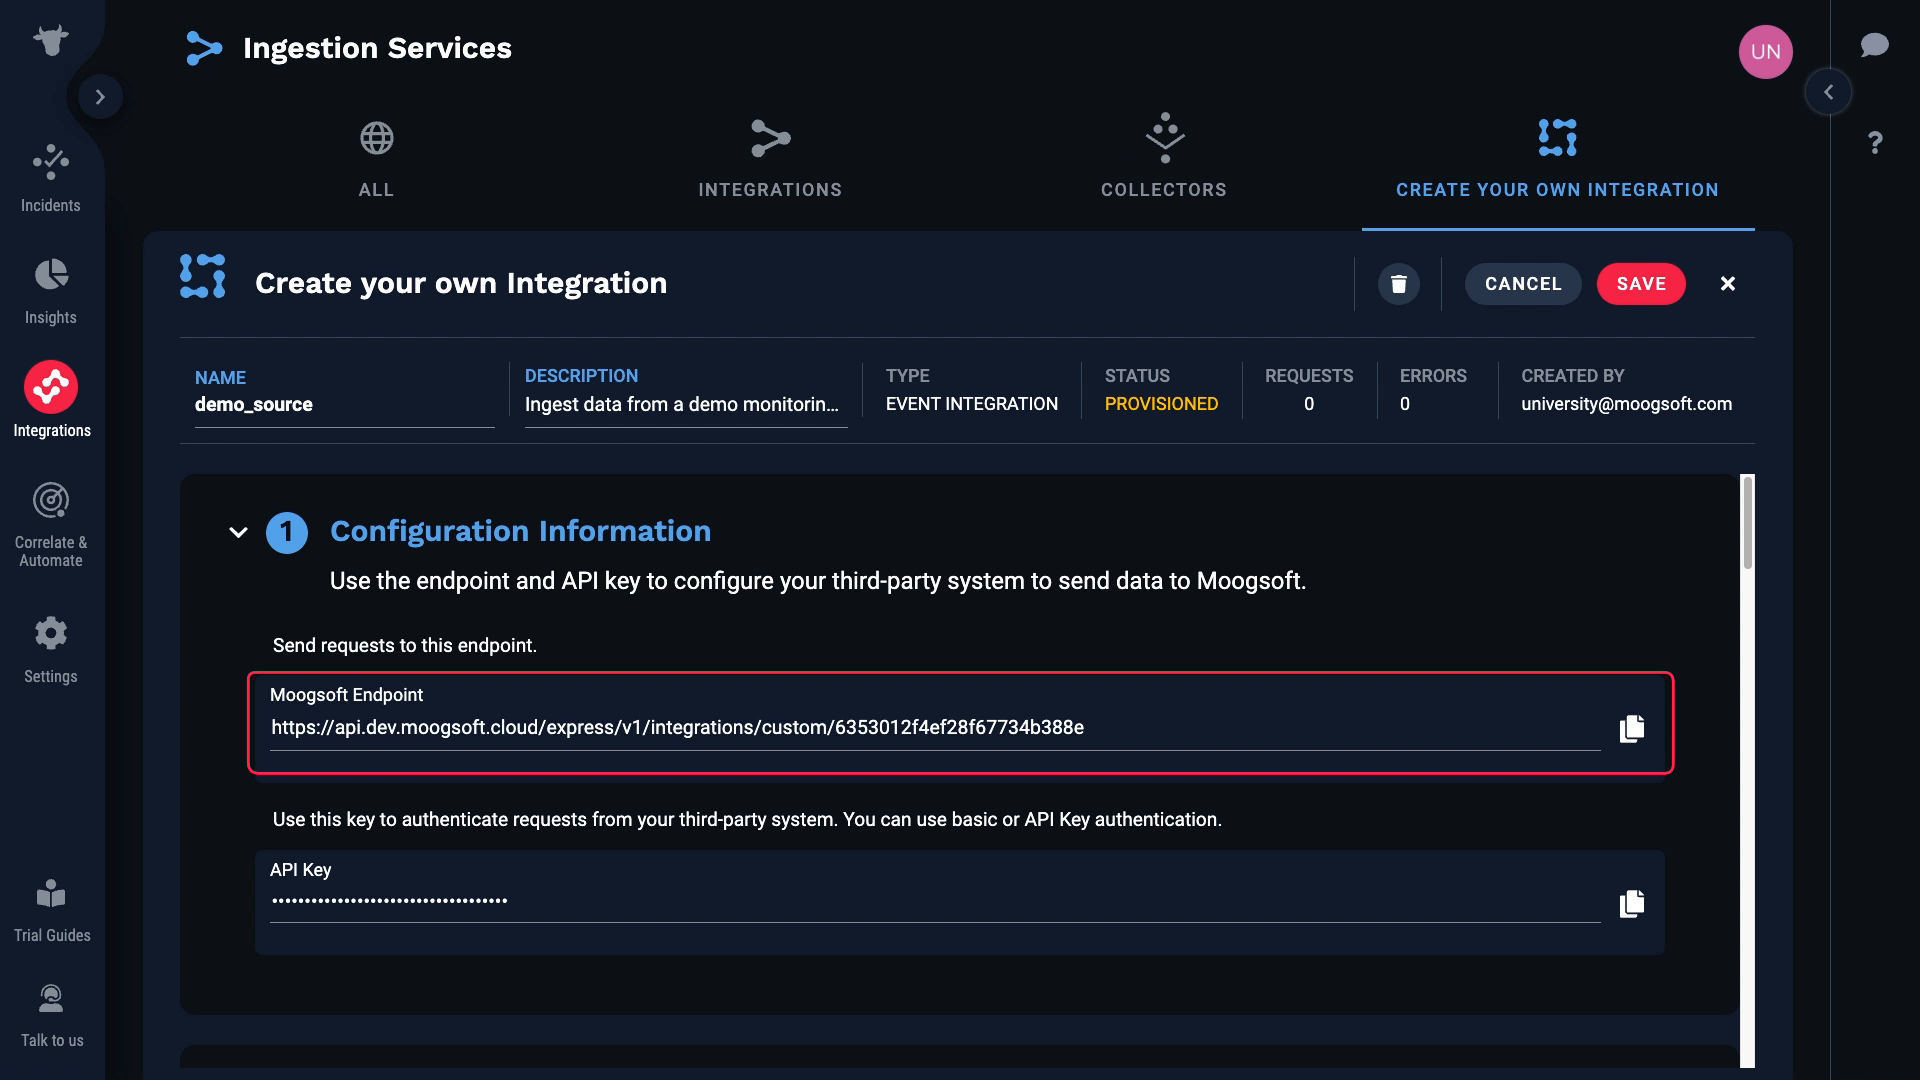
Grab that, and the API Key for our Incident Management instance which is found here.
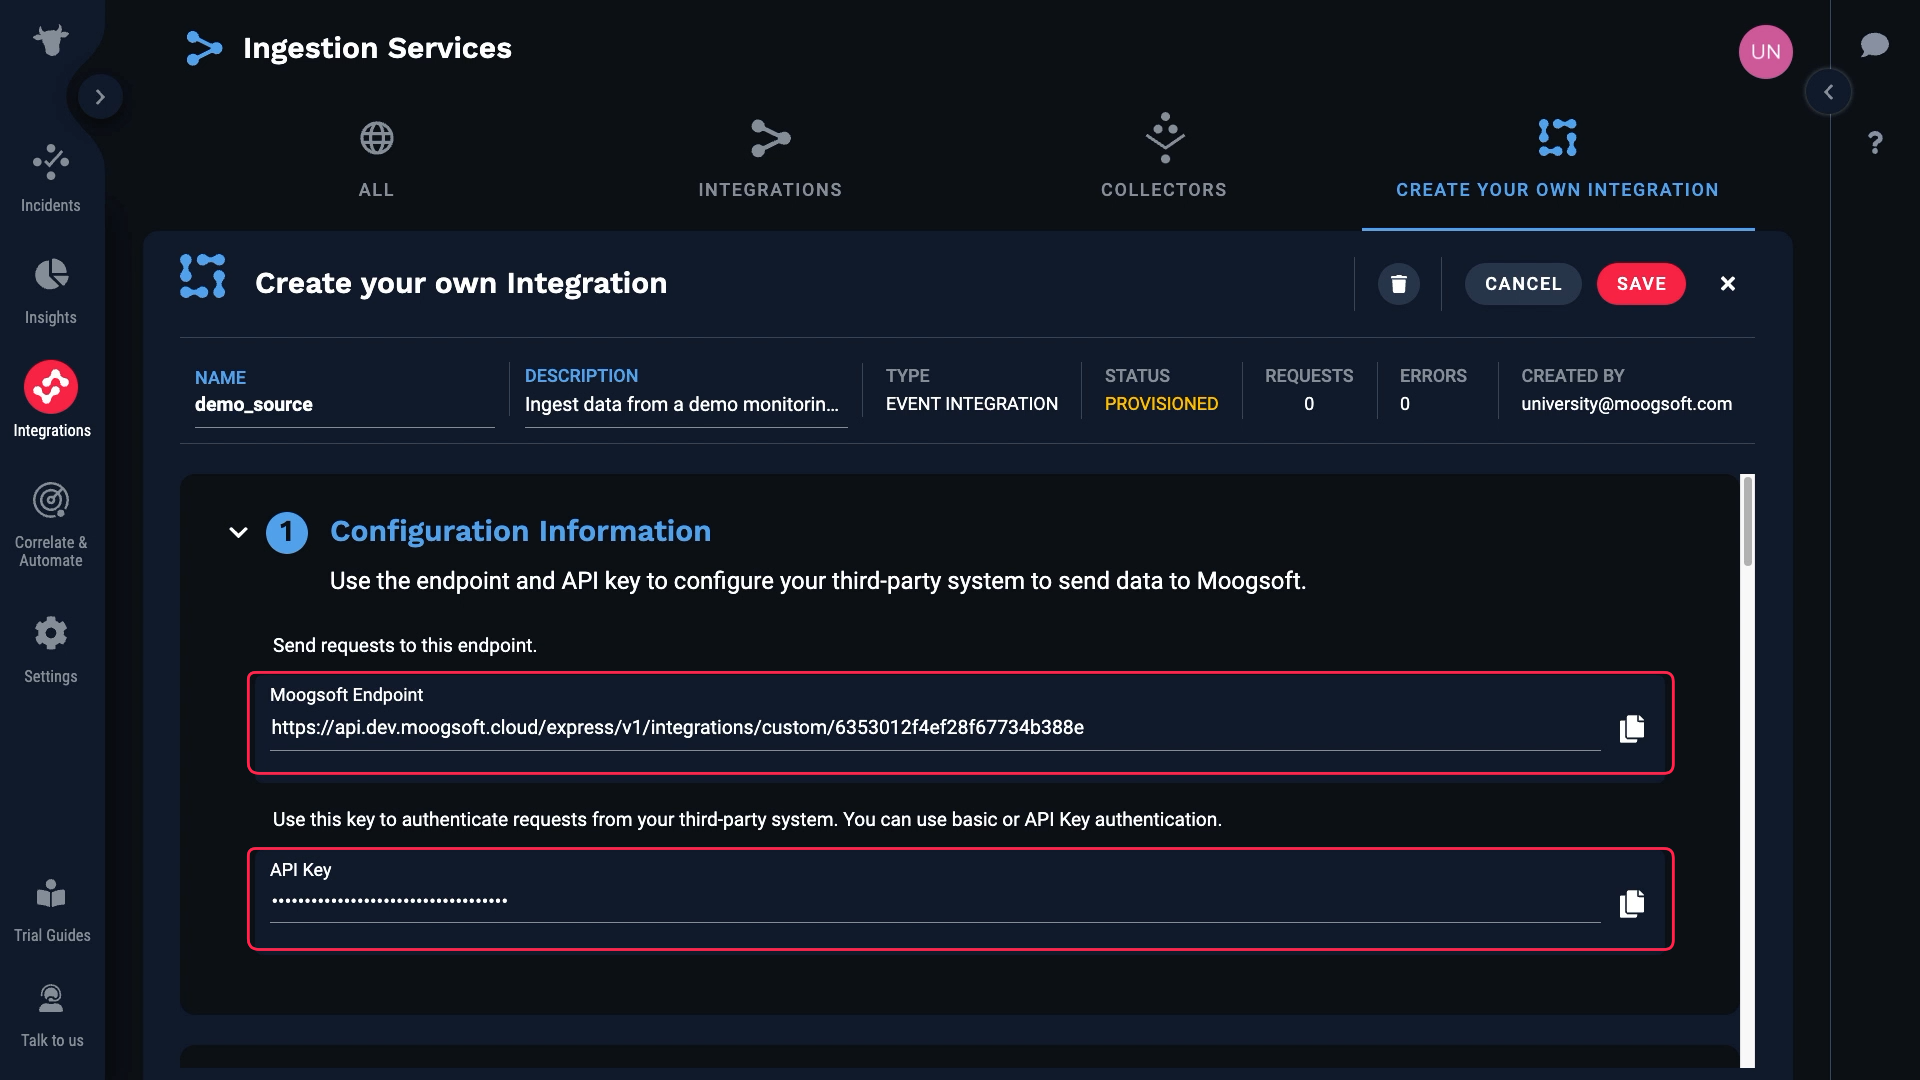
We’ve input those values in the source system. And now, Incident Management is receiving raw data from our source. Note that up to 10 of the most recent events are cached. You can click the reload button to refresh the list of data payloads.
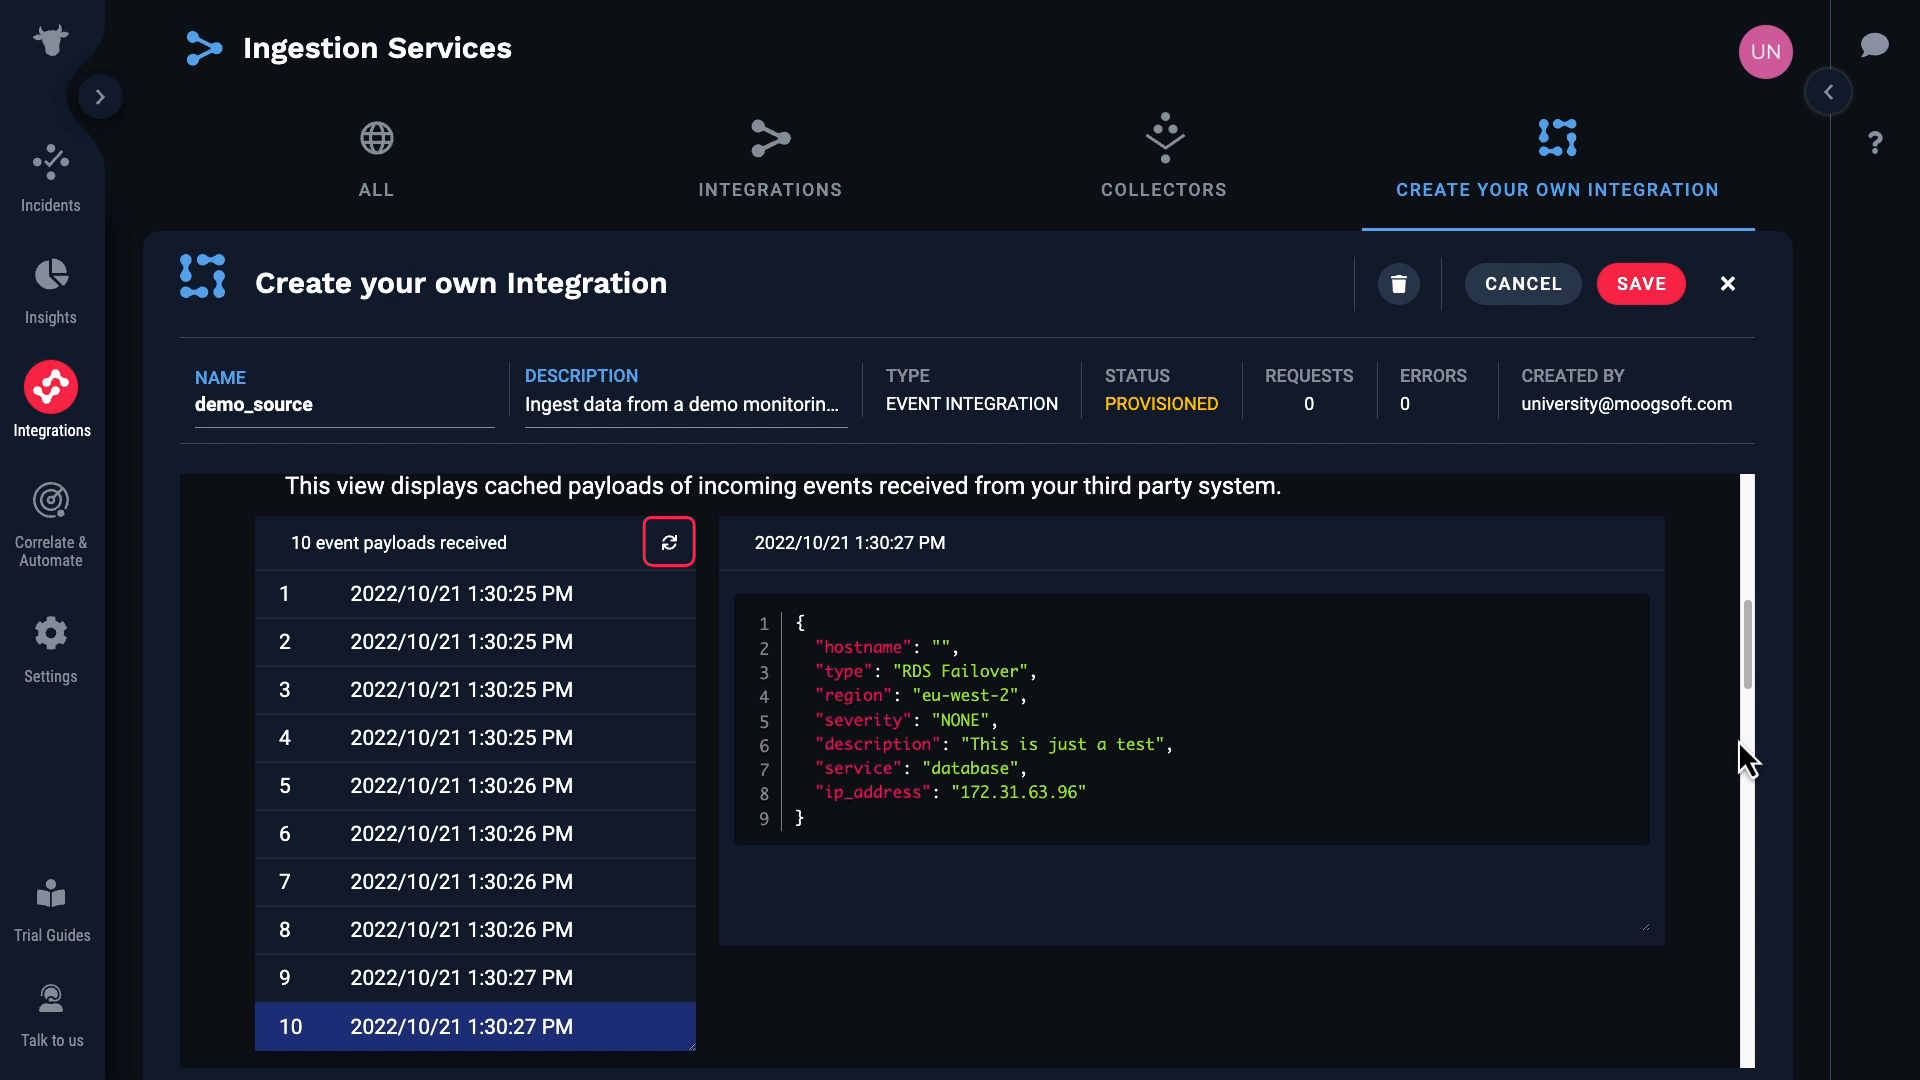
We can examine the data for each event here.
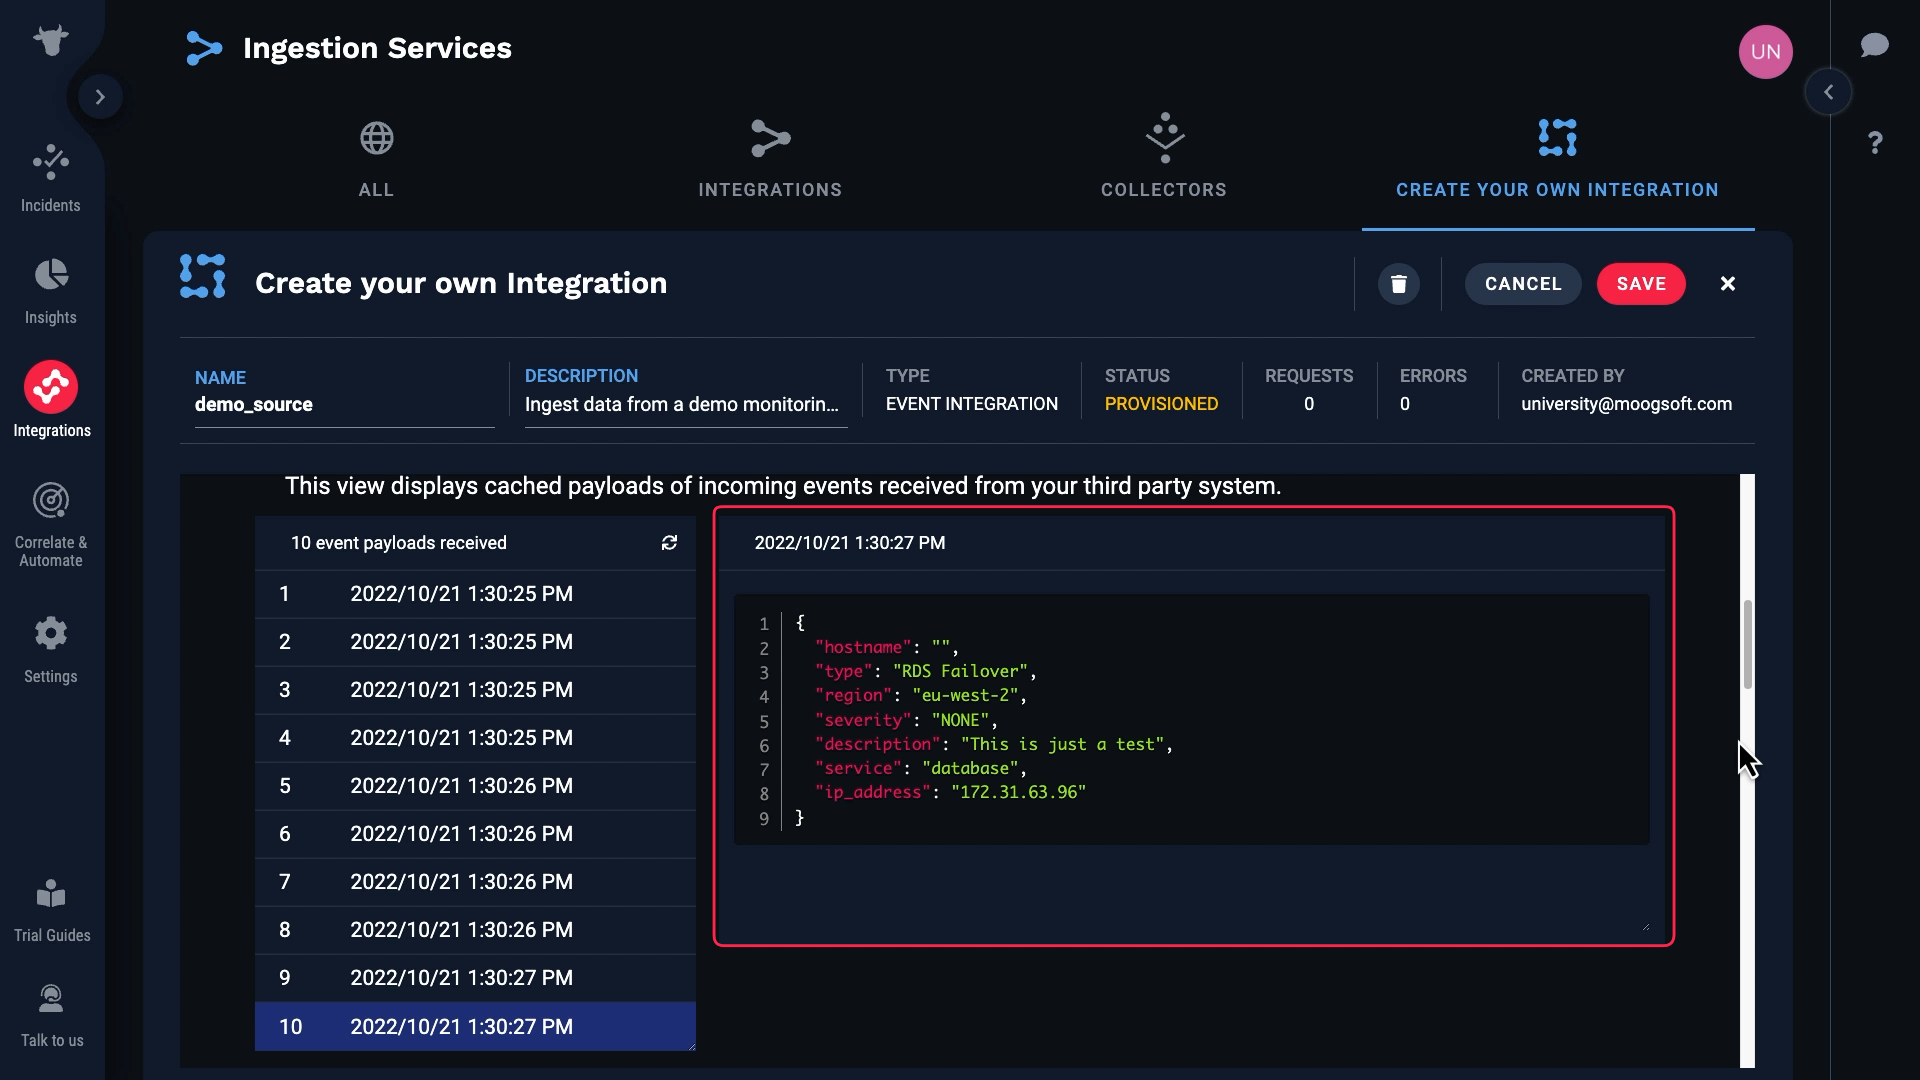
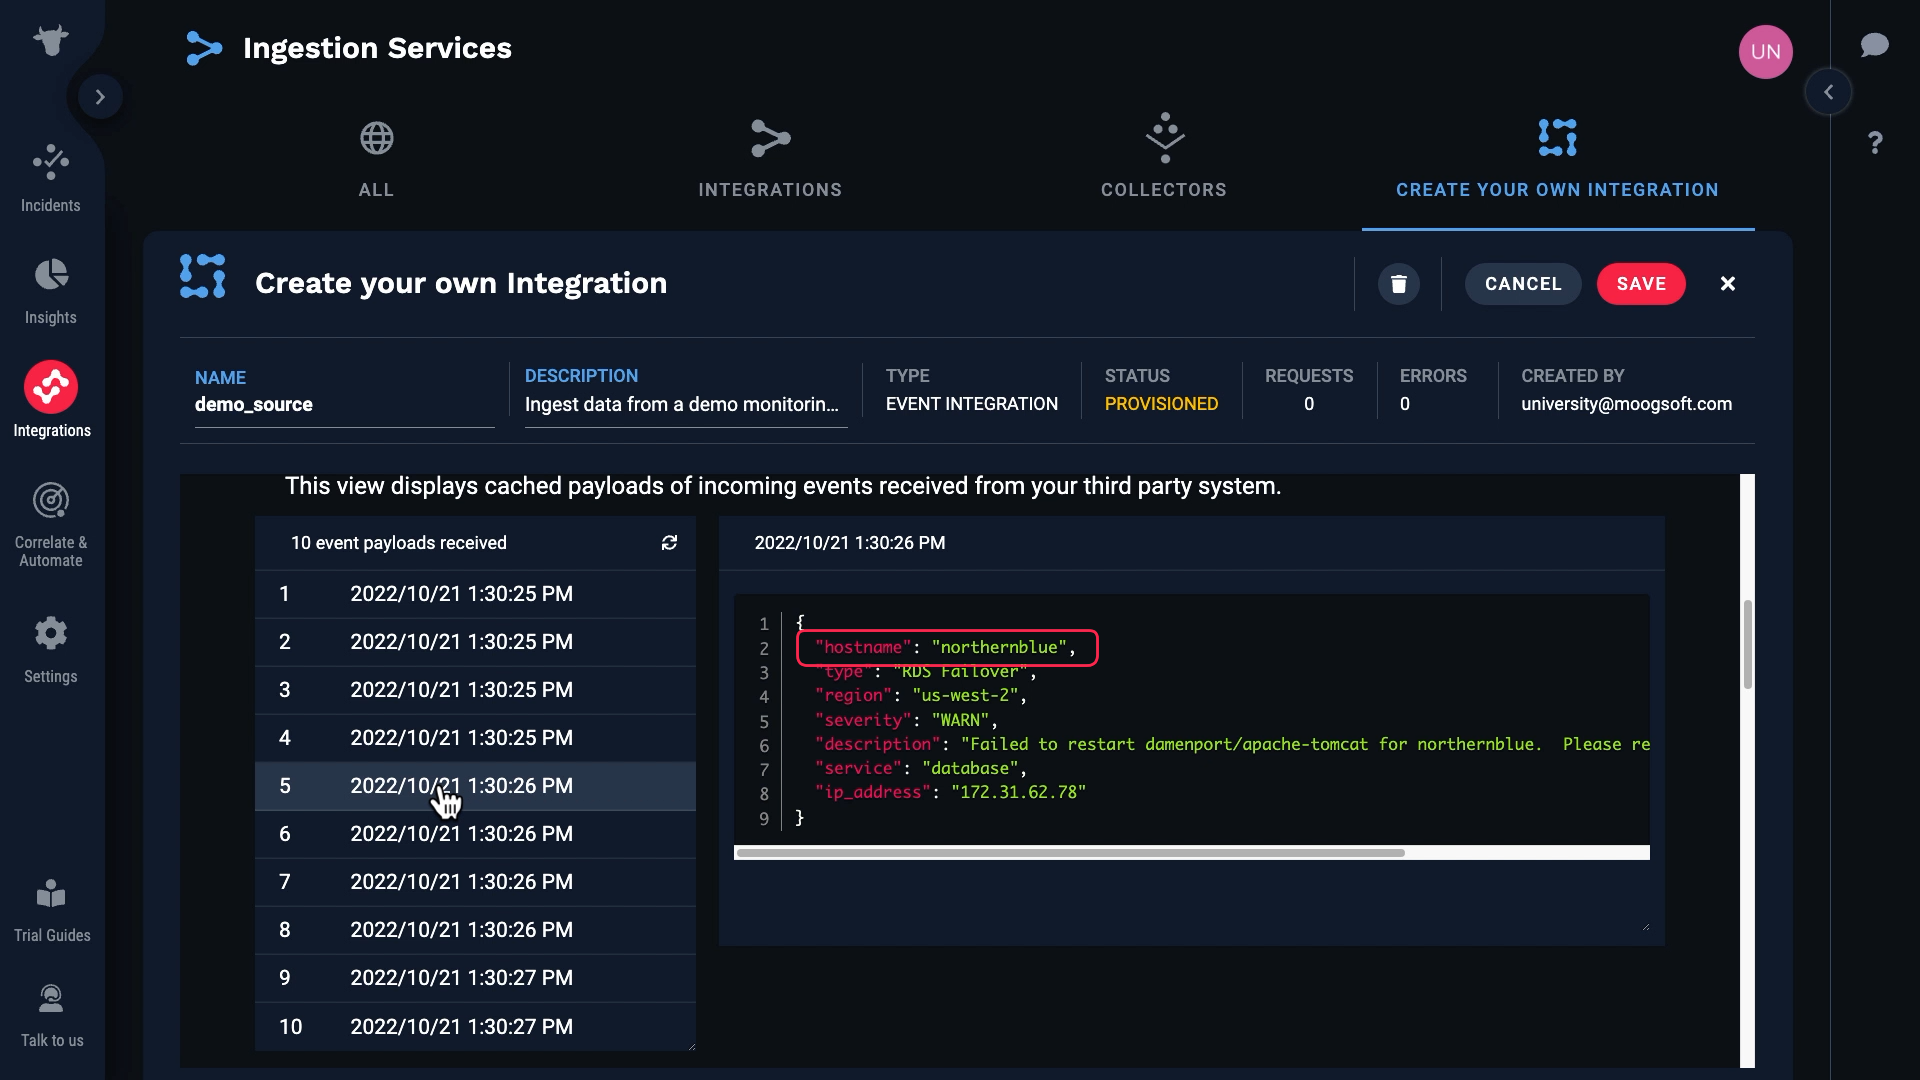
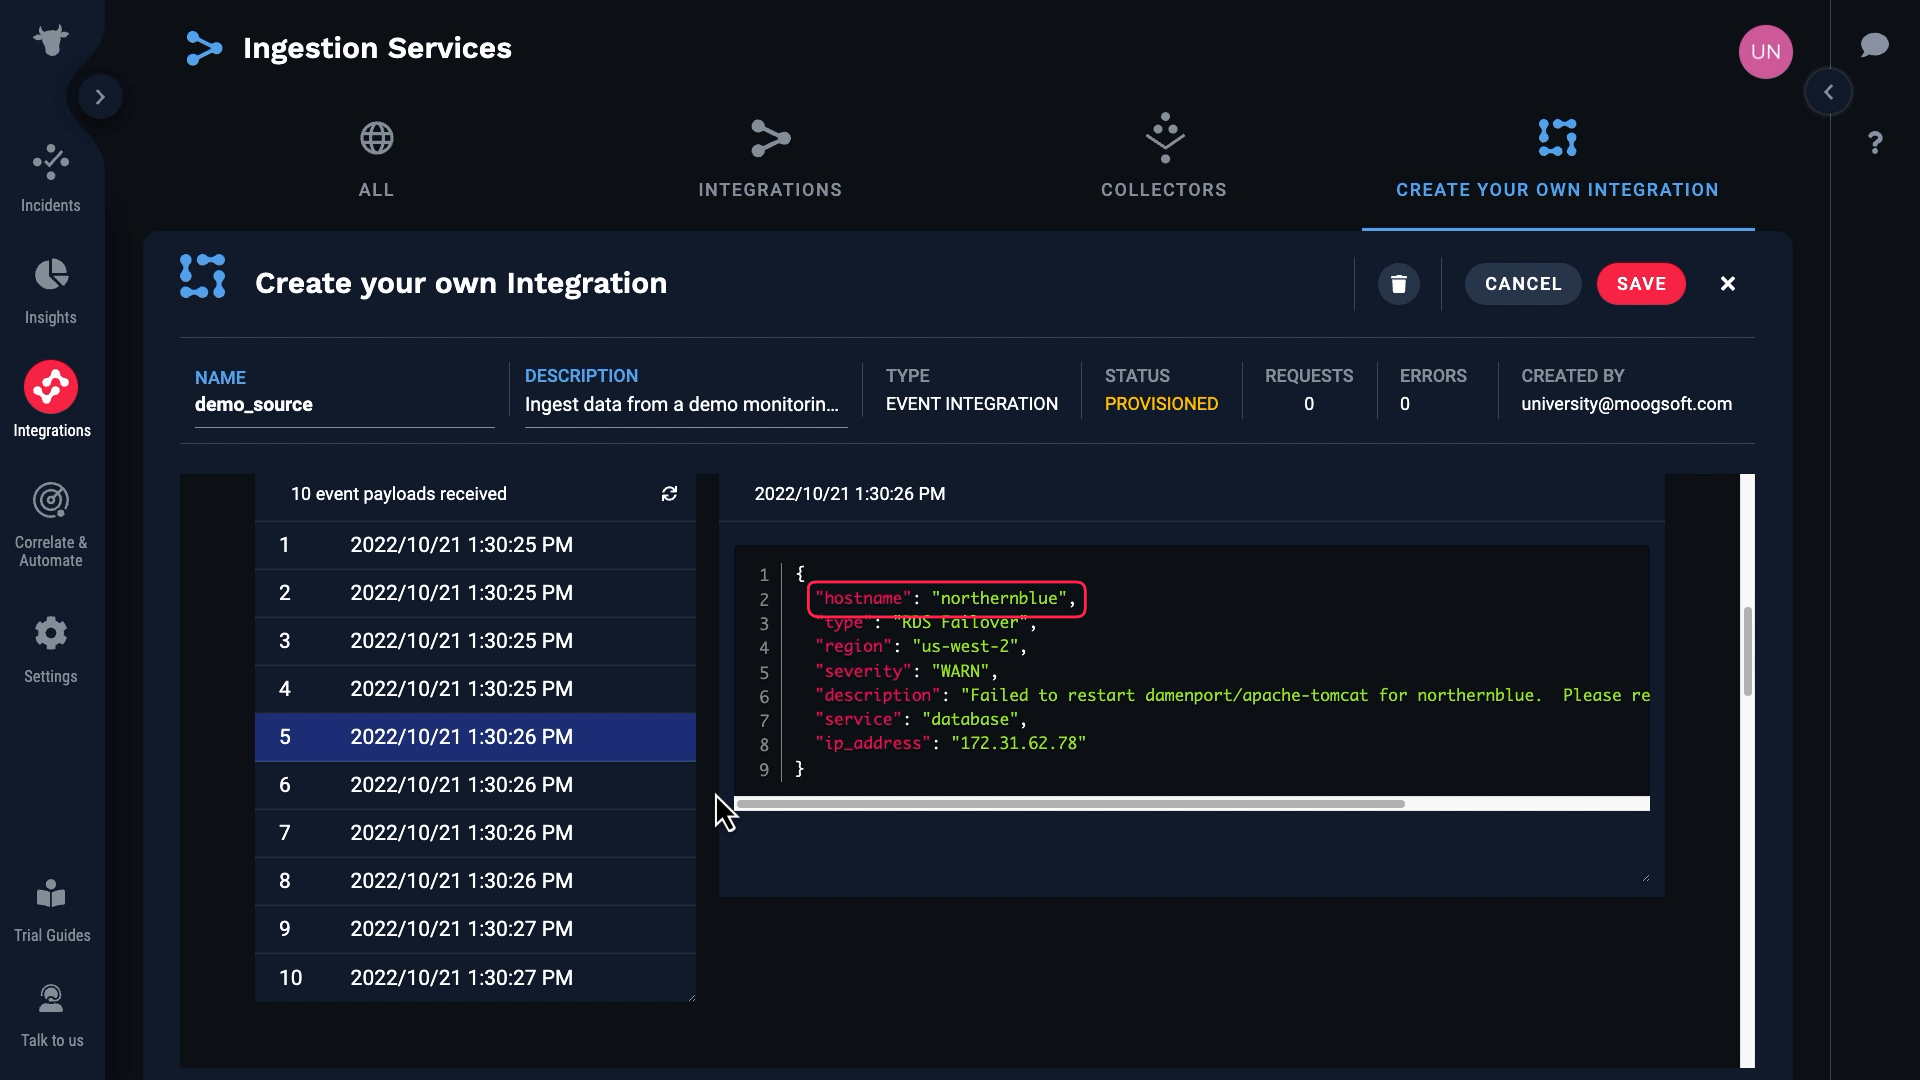
Note that some of these events have blank hostnames, and for some the hostnames are populated.
Let’s see how the payload and target fields line up. Incident Management automatically matched the obvious ones.
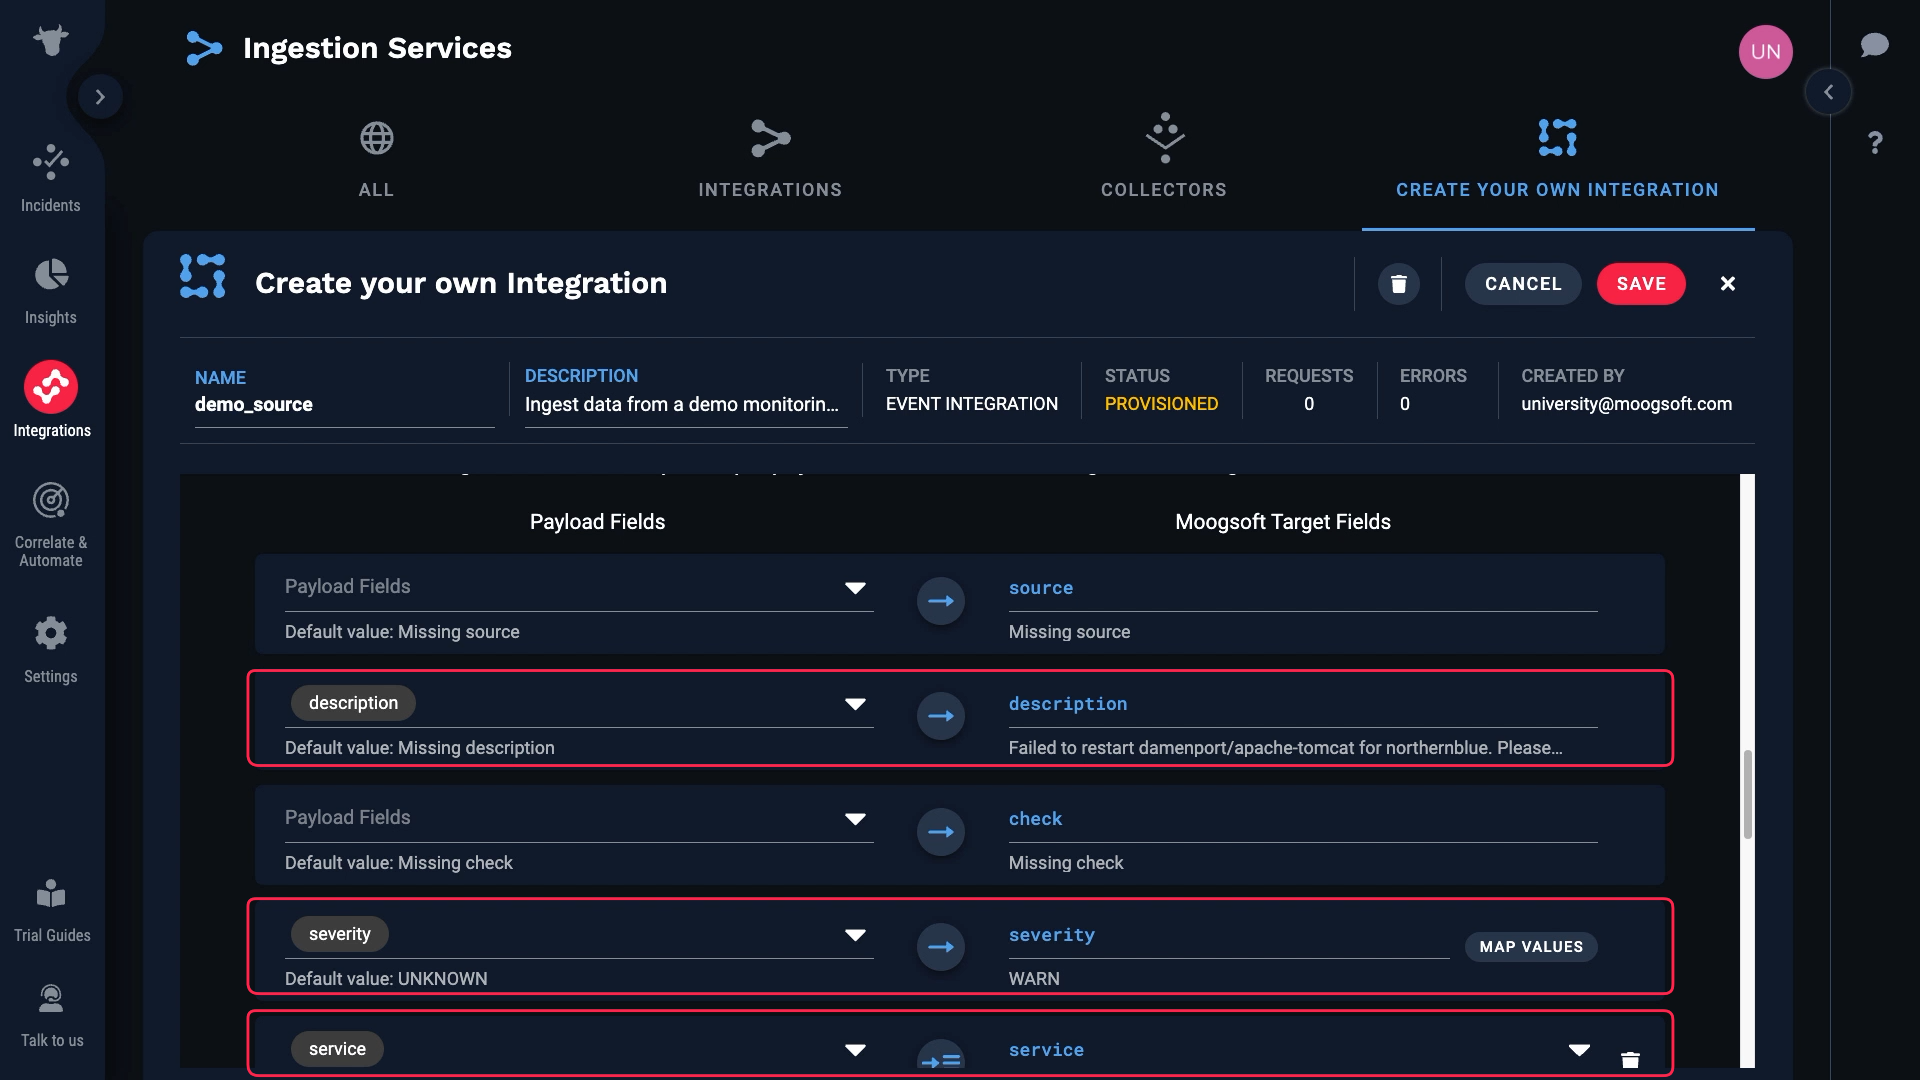
We don’t have a value for source, which is a required field. So we need to map something to that field.
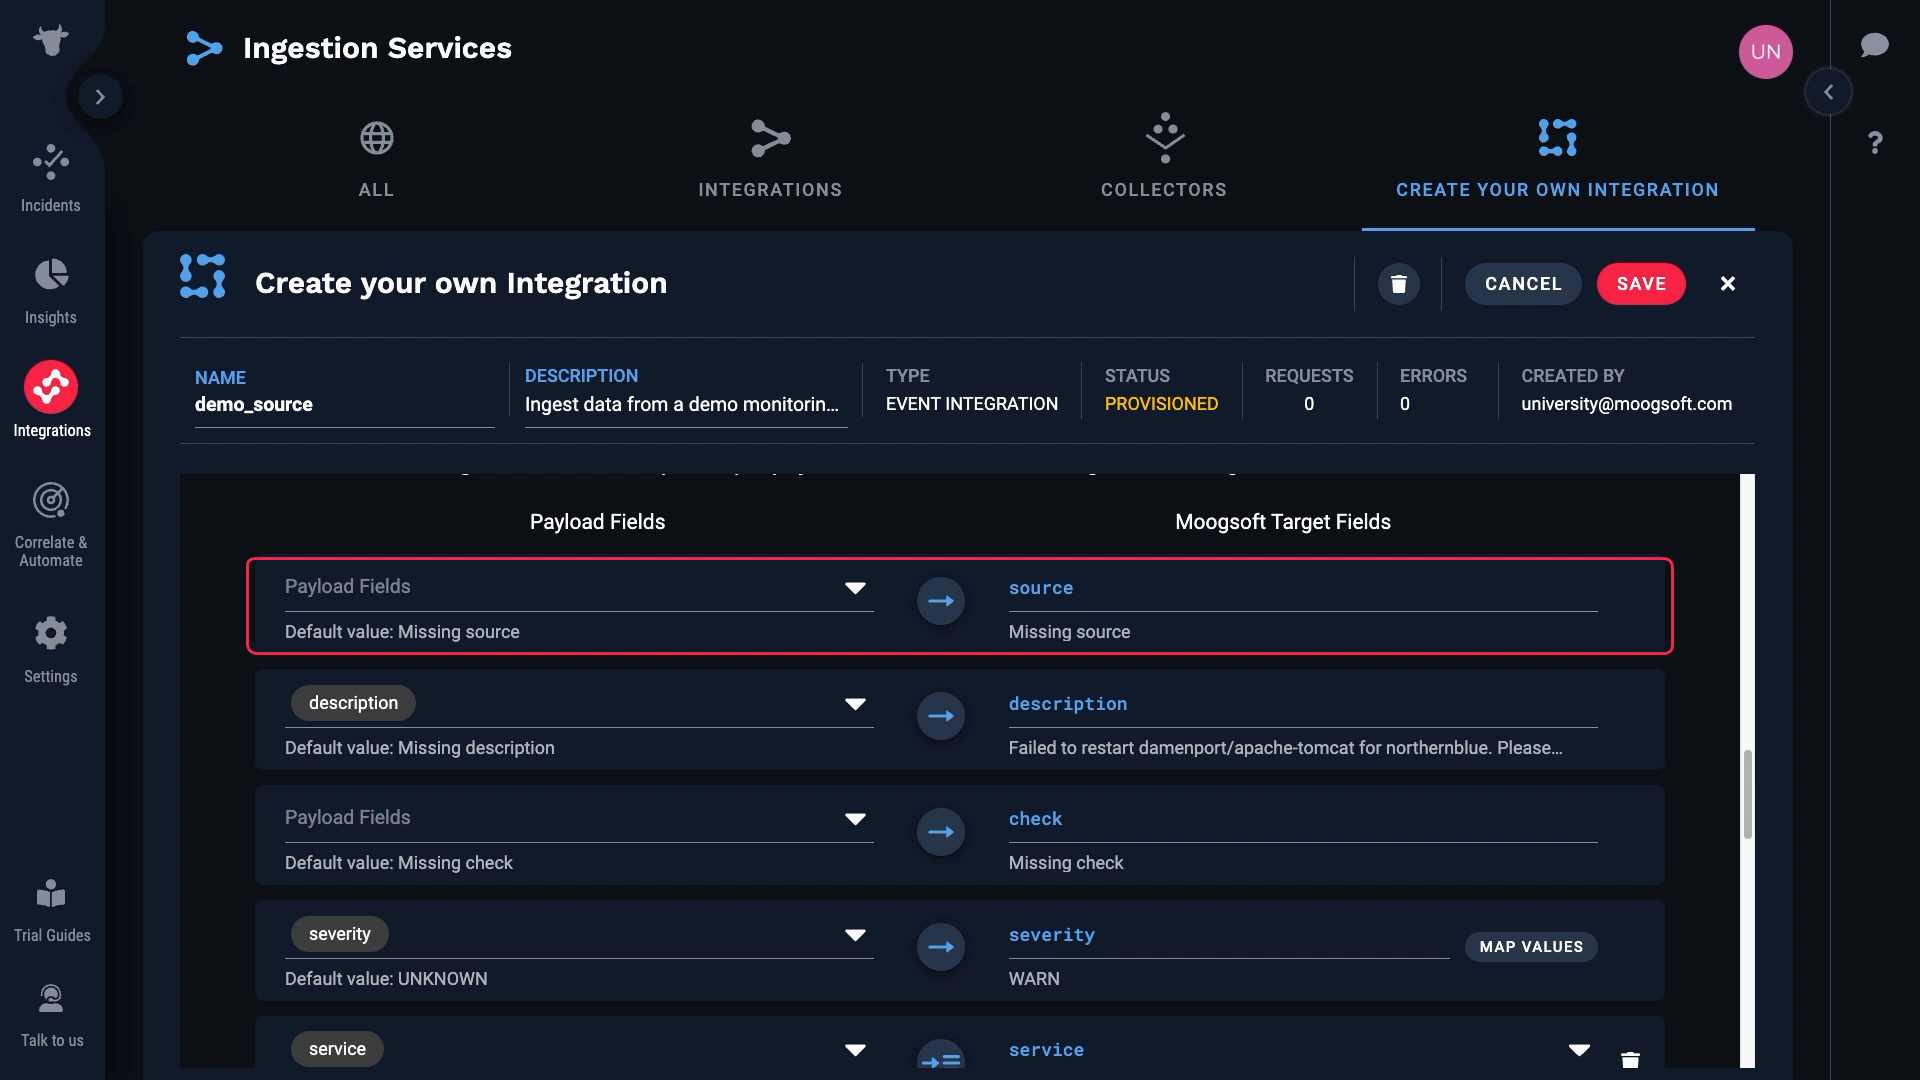
Let’s look at the data again. We want to map hostname to source, but we know it’s blank in some cases, and required fields can’t be blank.
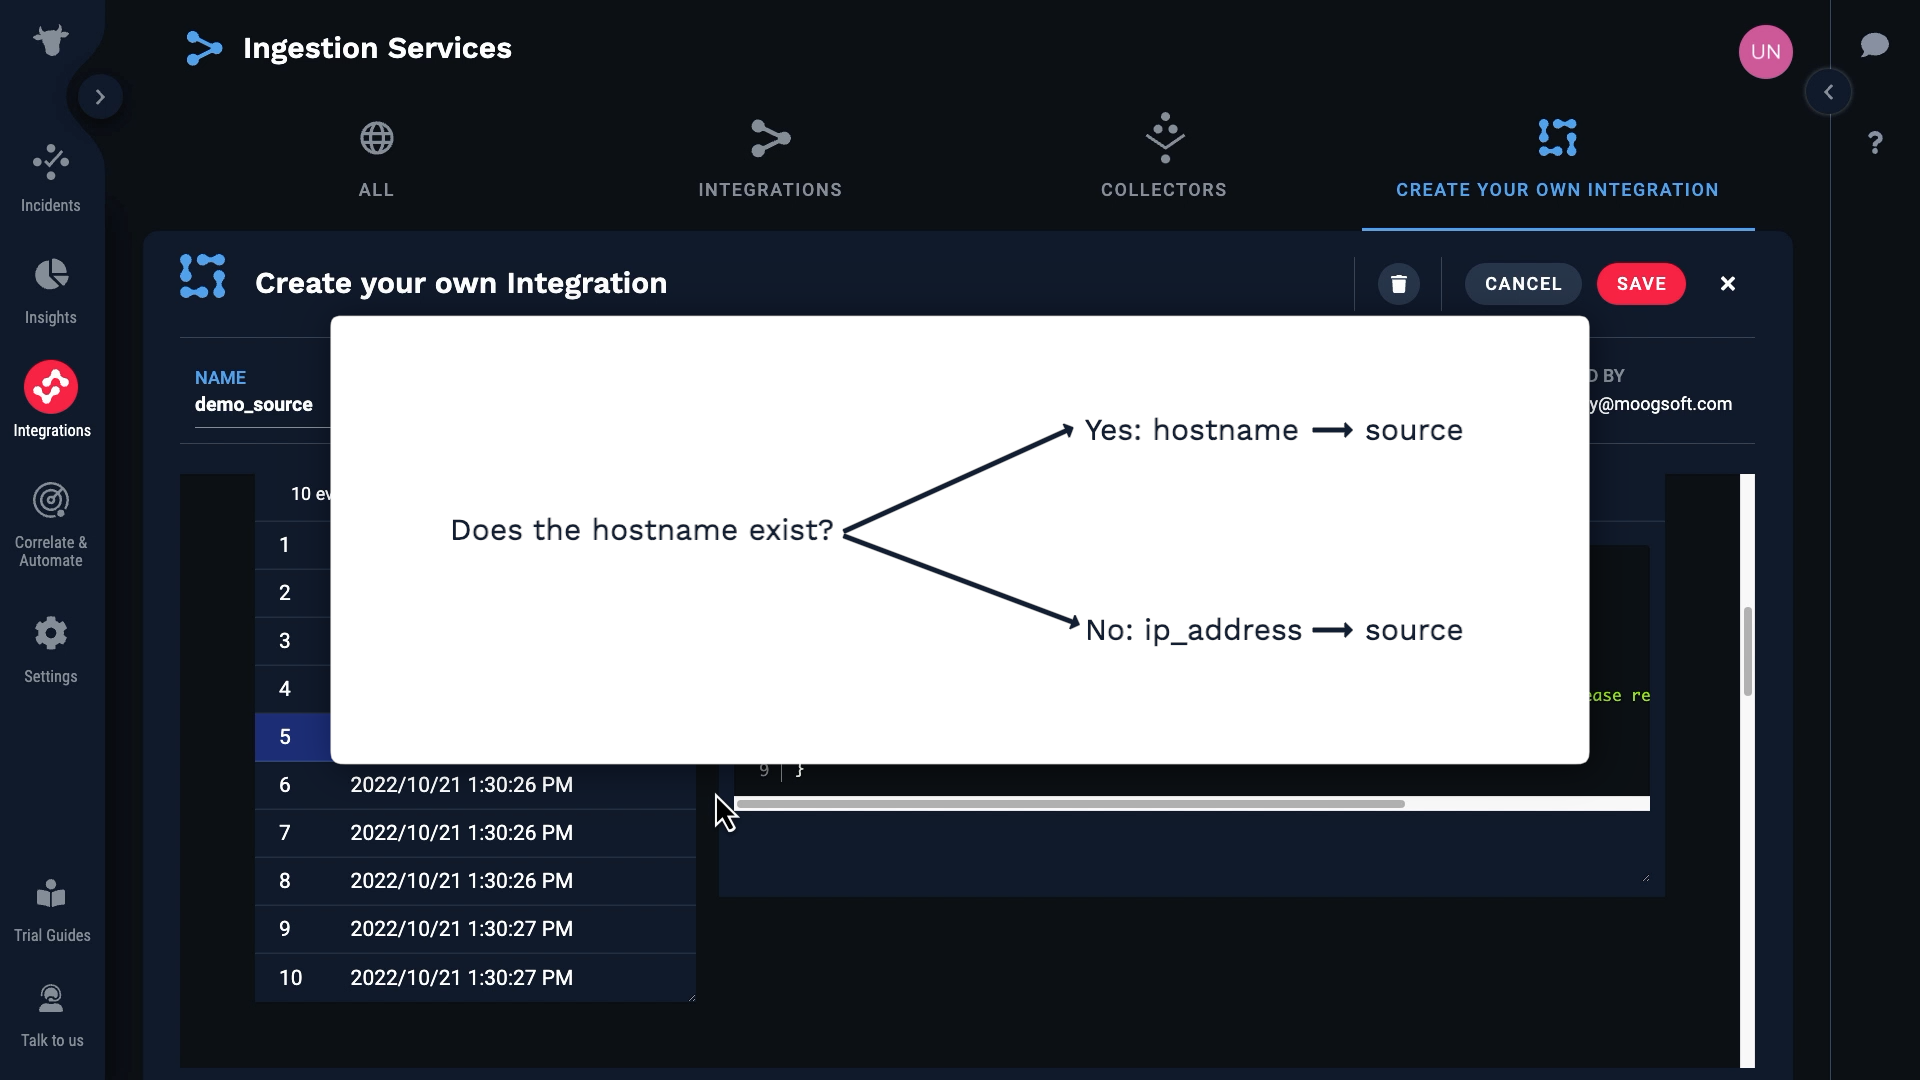
Let’s do this. We’ll map hostname to source if it exists, and if not we’ll use ip_address.
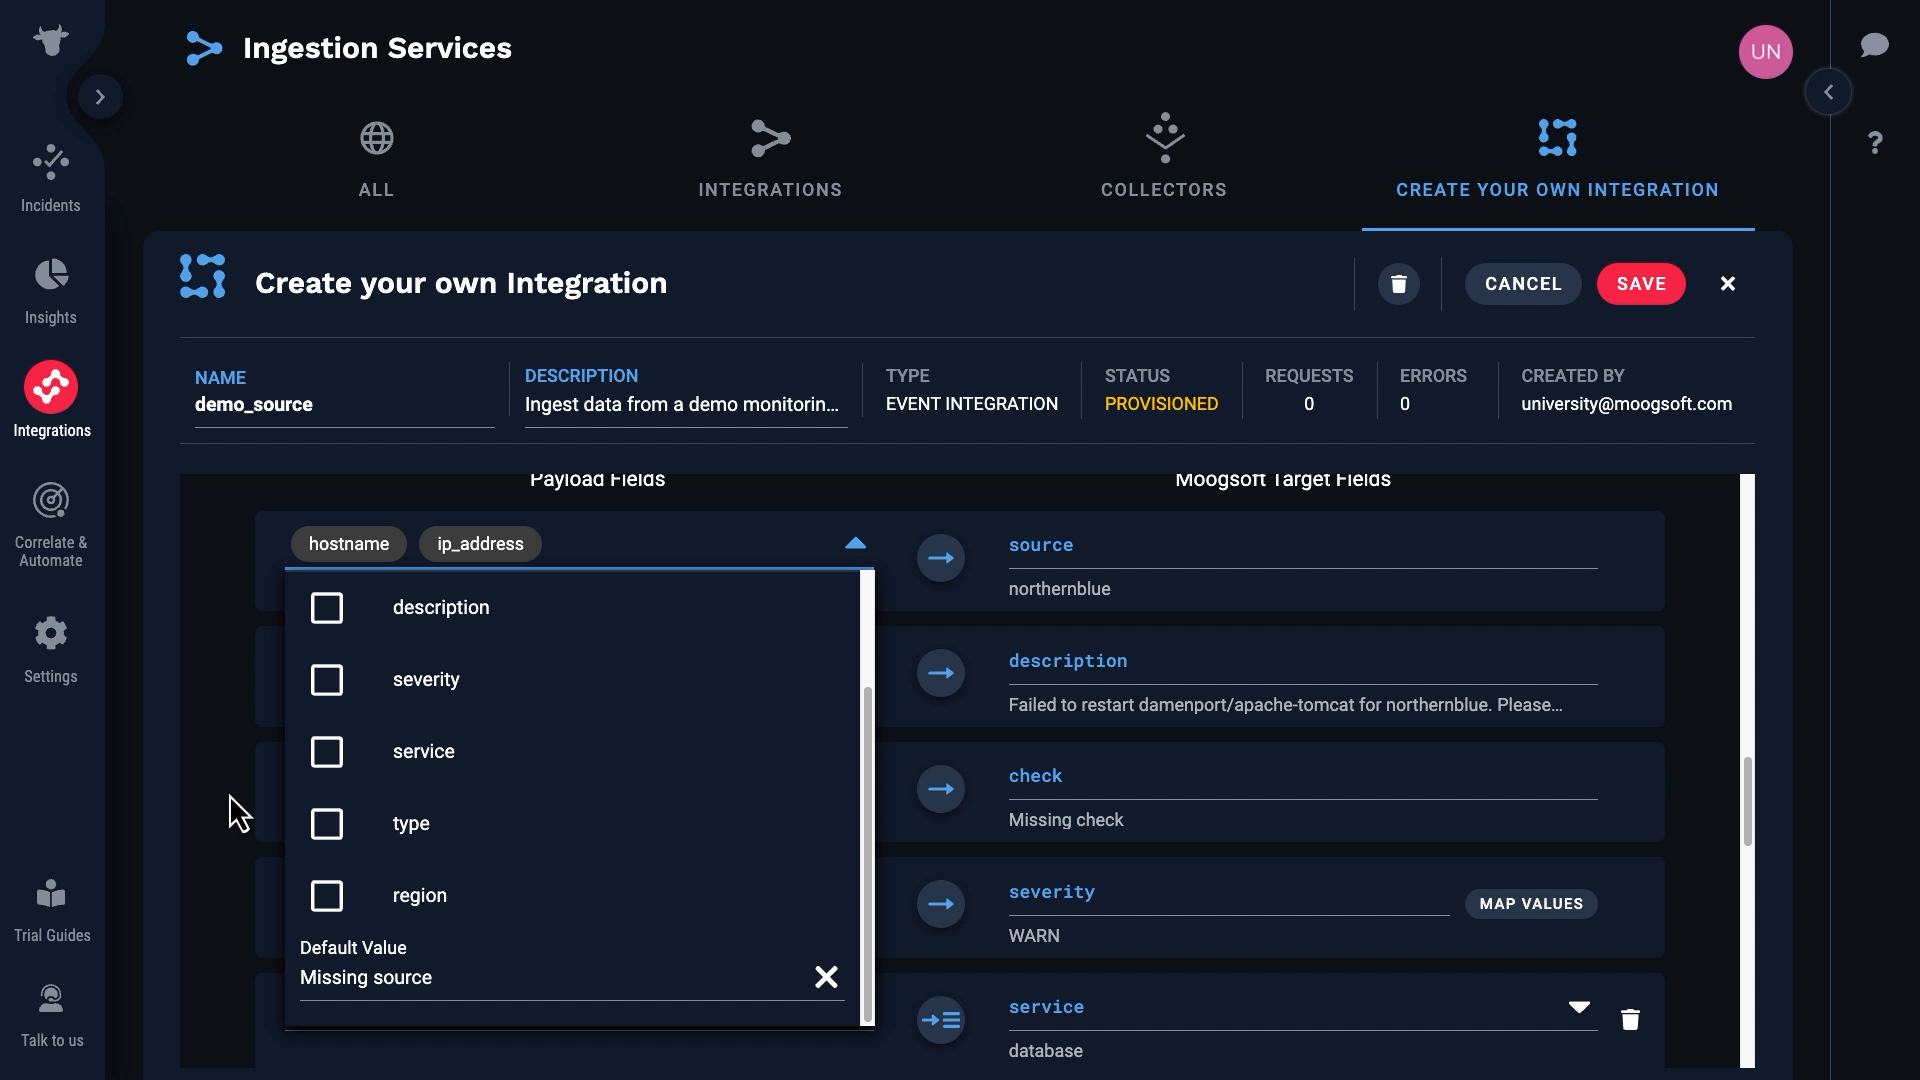
We’ll map hostname to source first. Then we’ll add a second mapping, and map ip_address. Incident Management will use the first mapping if a value exists and is valid. Otherwise, it will move on and use the next mapping.
This defines the condition that generates the event.
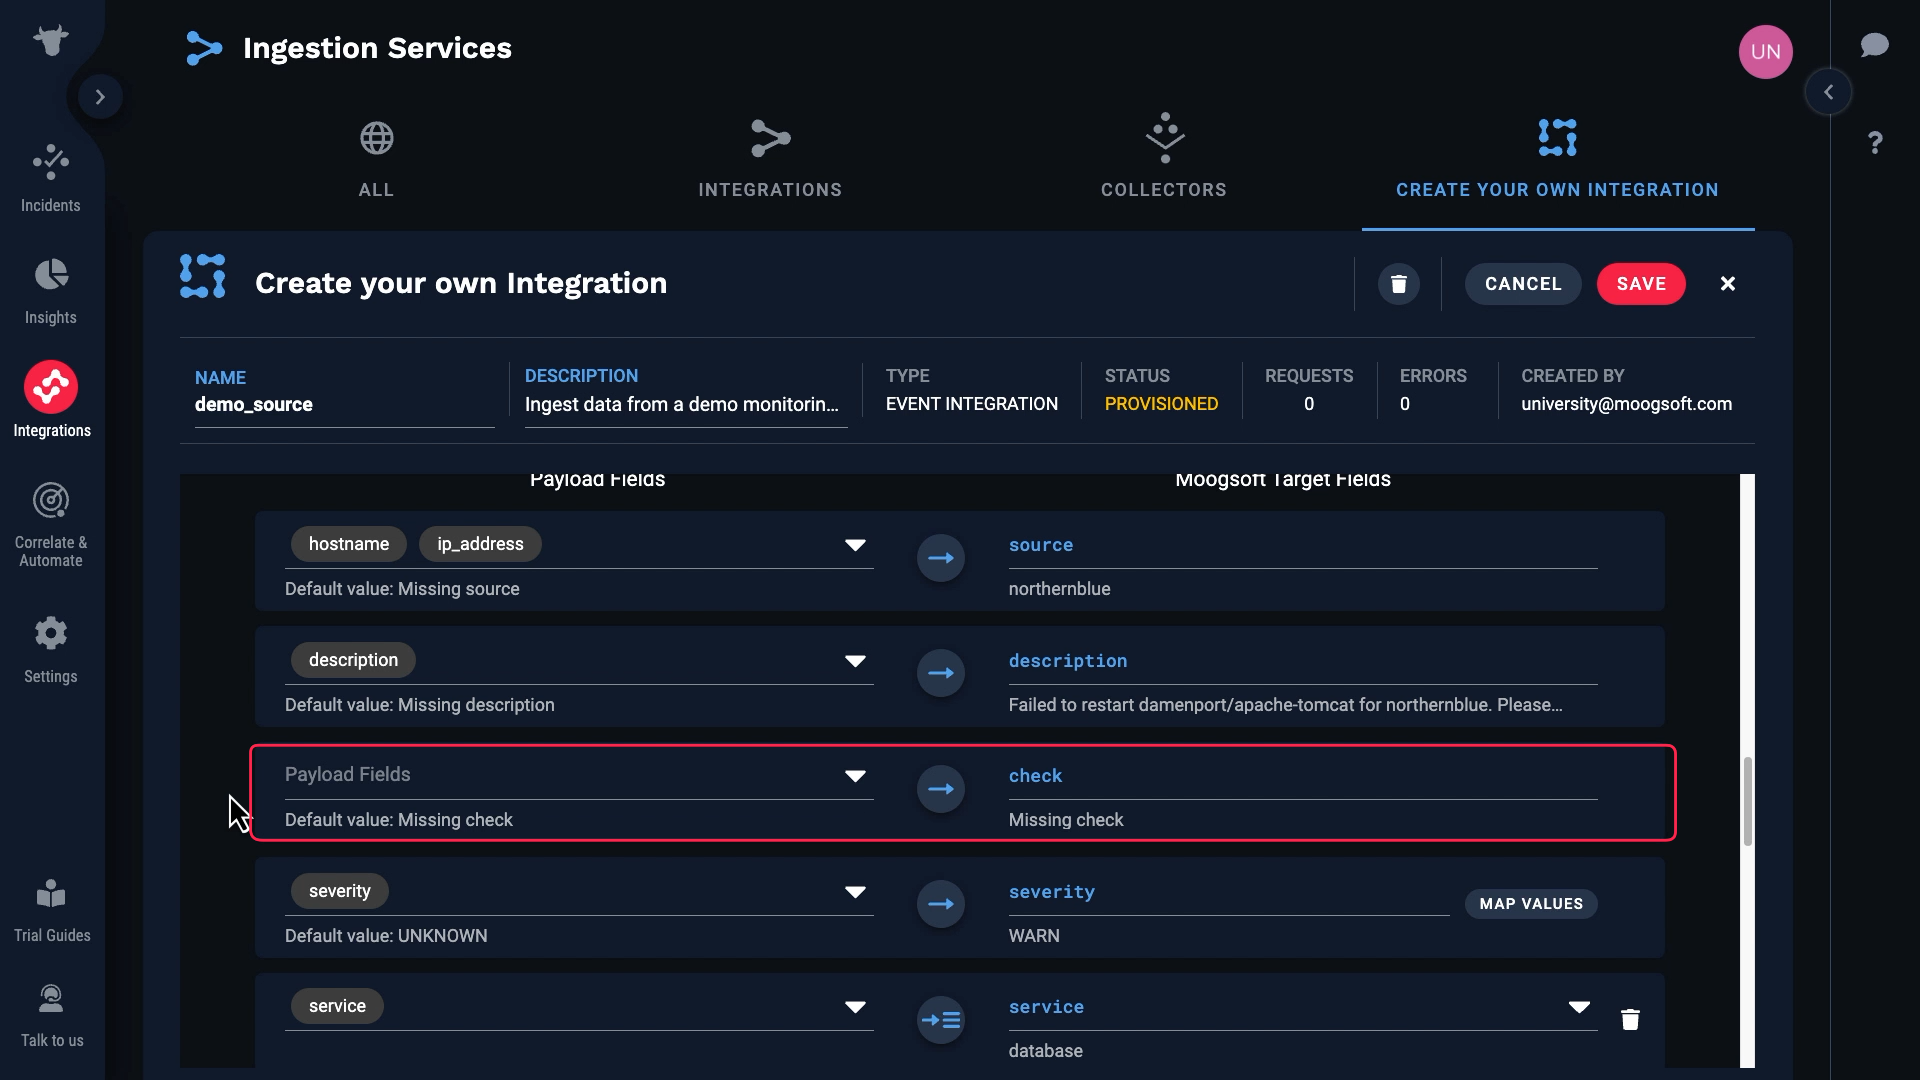
We’ll map the Type field to check.
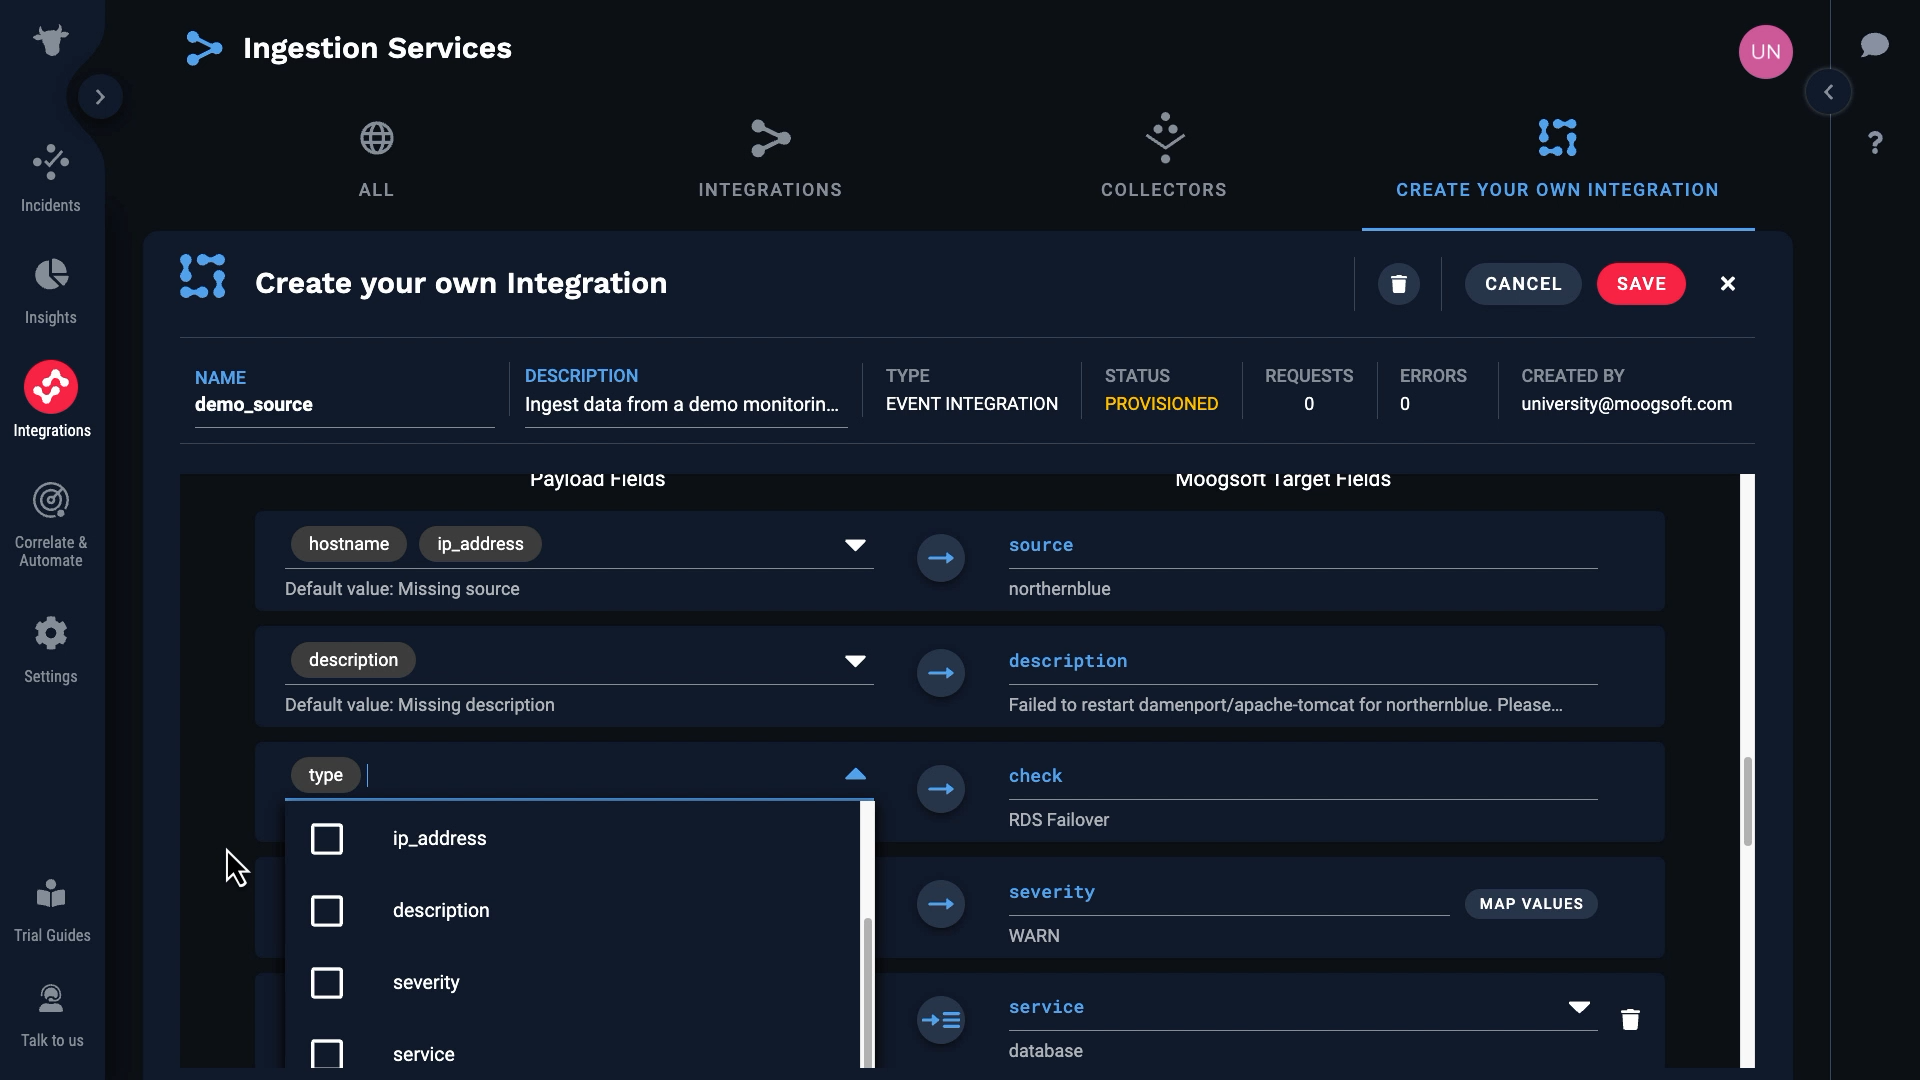
Next let’s take care of the severity. Our monitoring service has only four severity levels: NONE, INFO, WARN, and PROBLEM. So we’ll map them to the Incident Management severity levels like this...
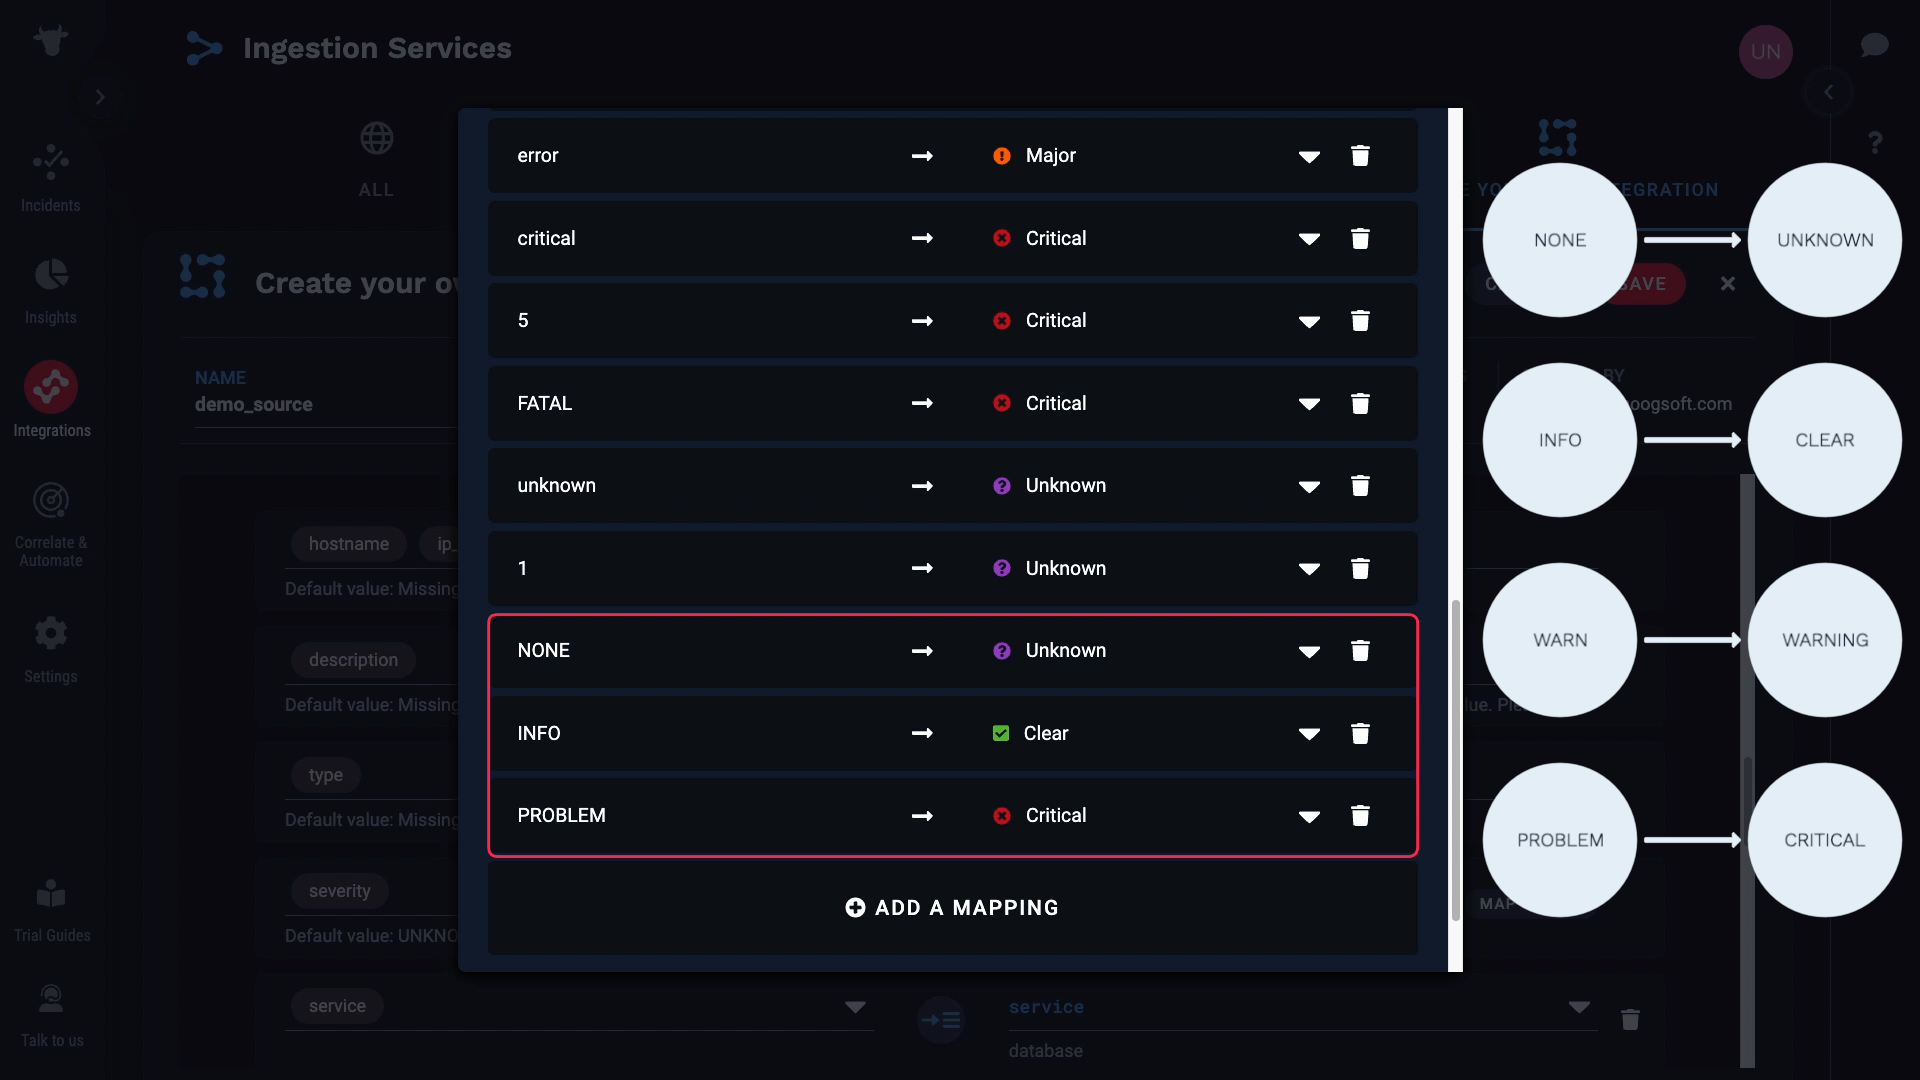
With that we took care of all the required fields. Let’s see what other fields we might want to bring in. Let’s say we want to keep region. And let’s add a custom tag for ip_address.
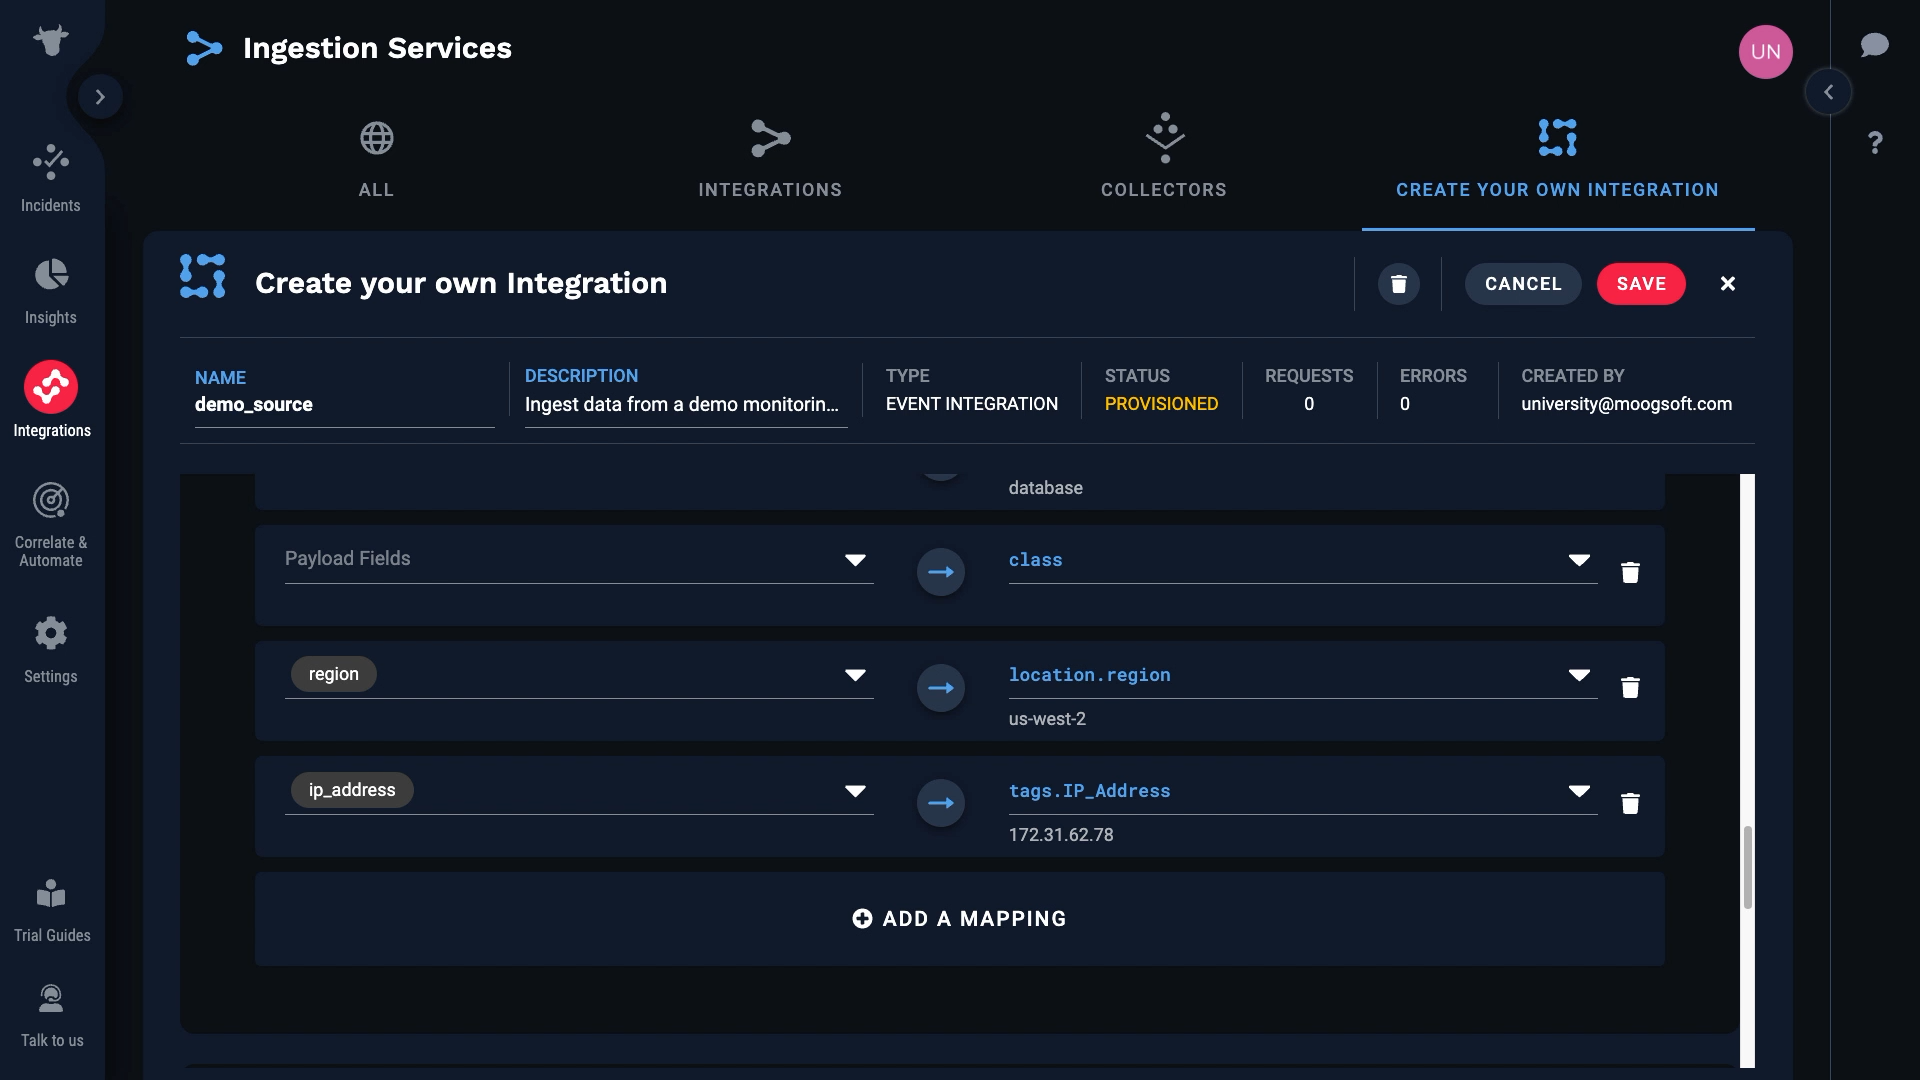
The last step before we save our integration is to configure the deduplication key. Here’s how deduplication works. Incident Management uses the fields in the deduplication key to assign multiple events to the same alert and reduce noise. The idea behind deduplication is that events with the same context should become part of the same alert.
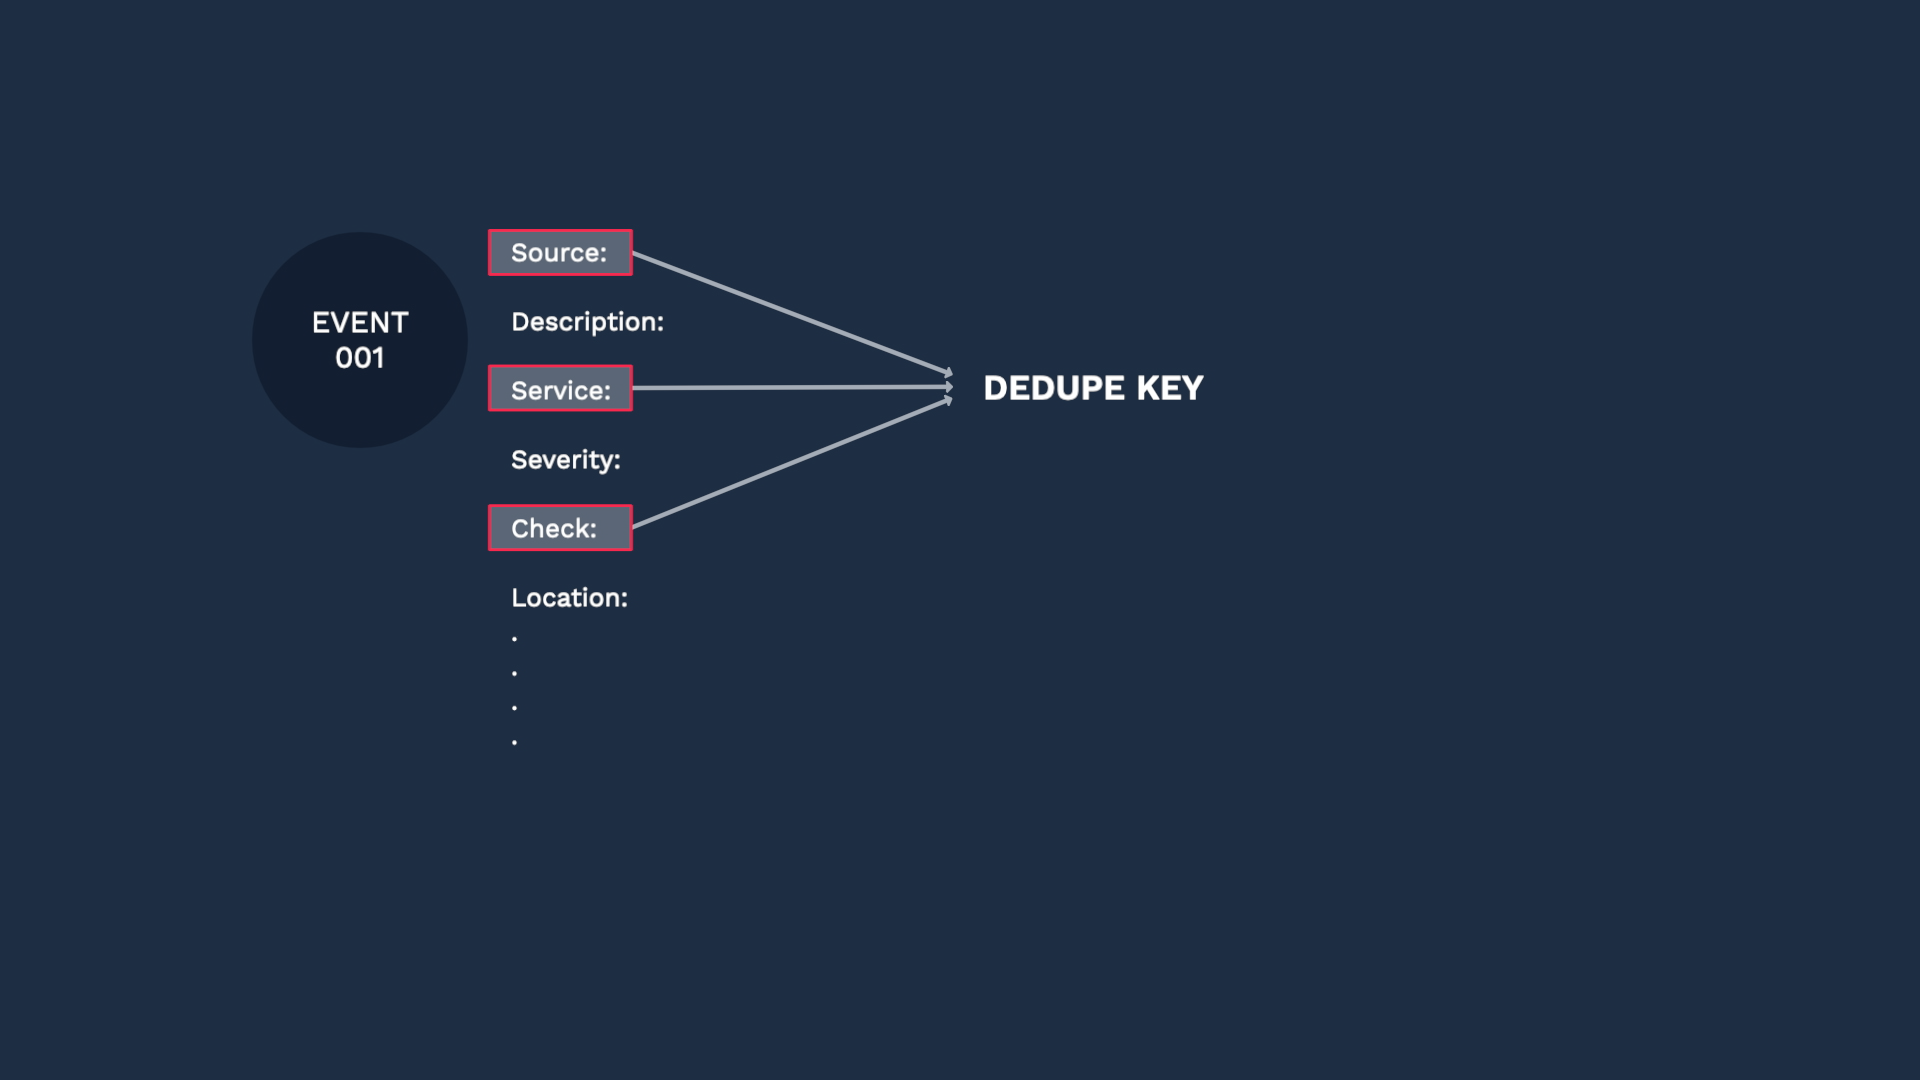
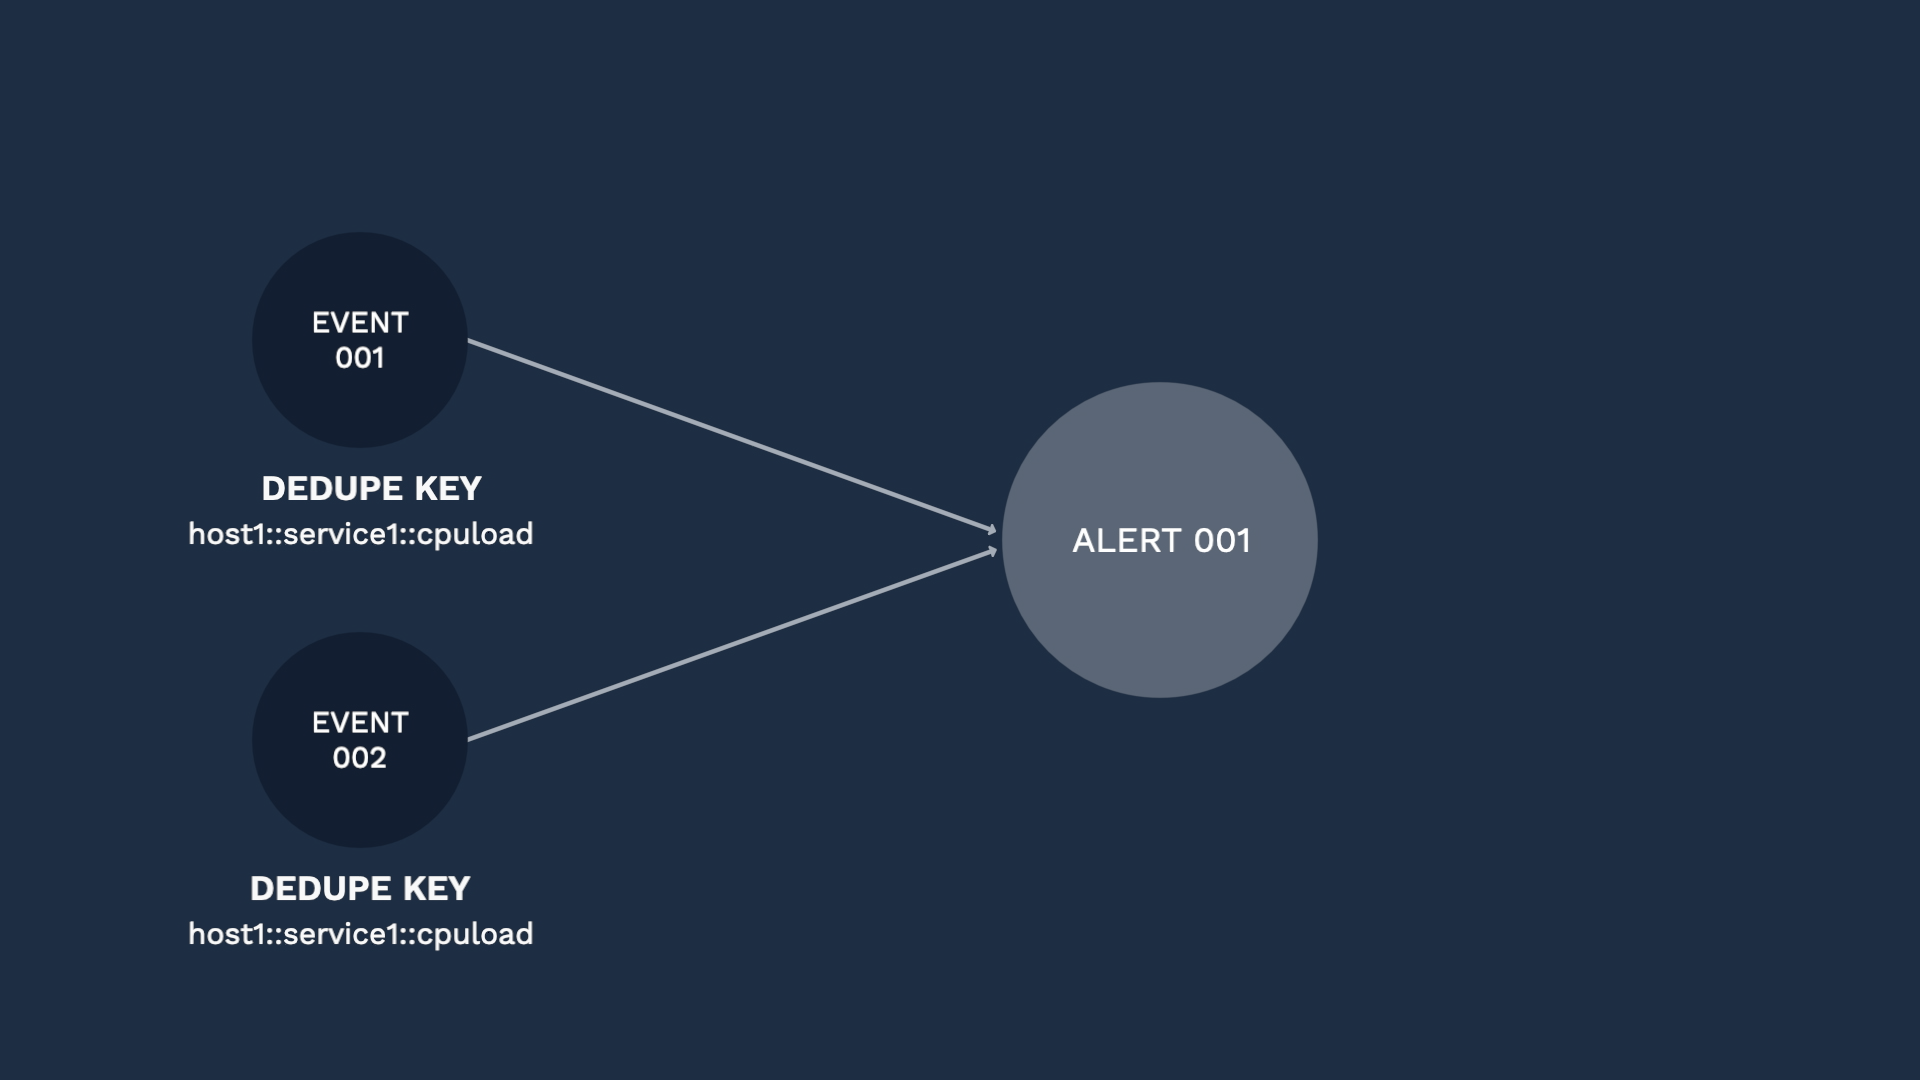
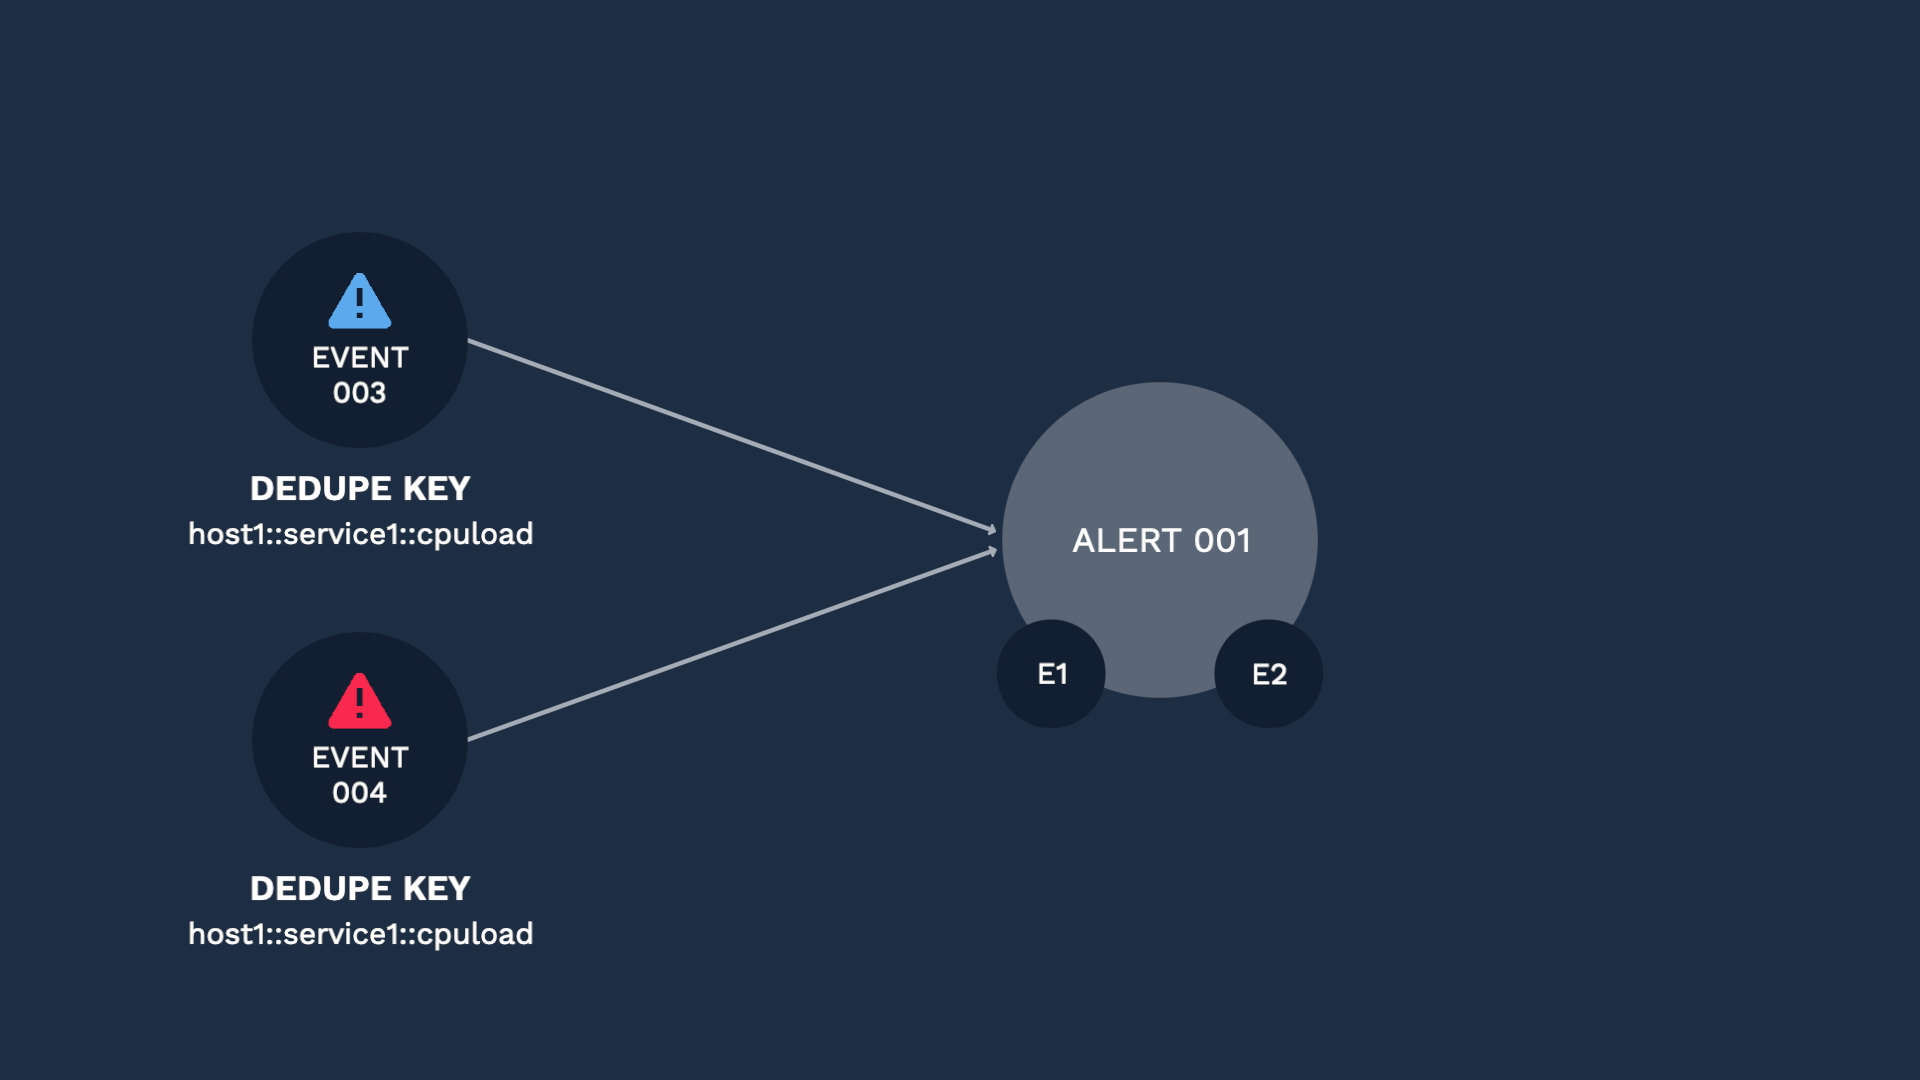
For example, we might find out about a condition that affects one of our hosts with a warning event, which then escalates to a critical event. Since the key context is the same, Incident Management would assign those events to the same alert.
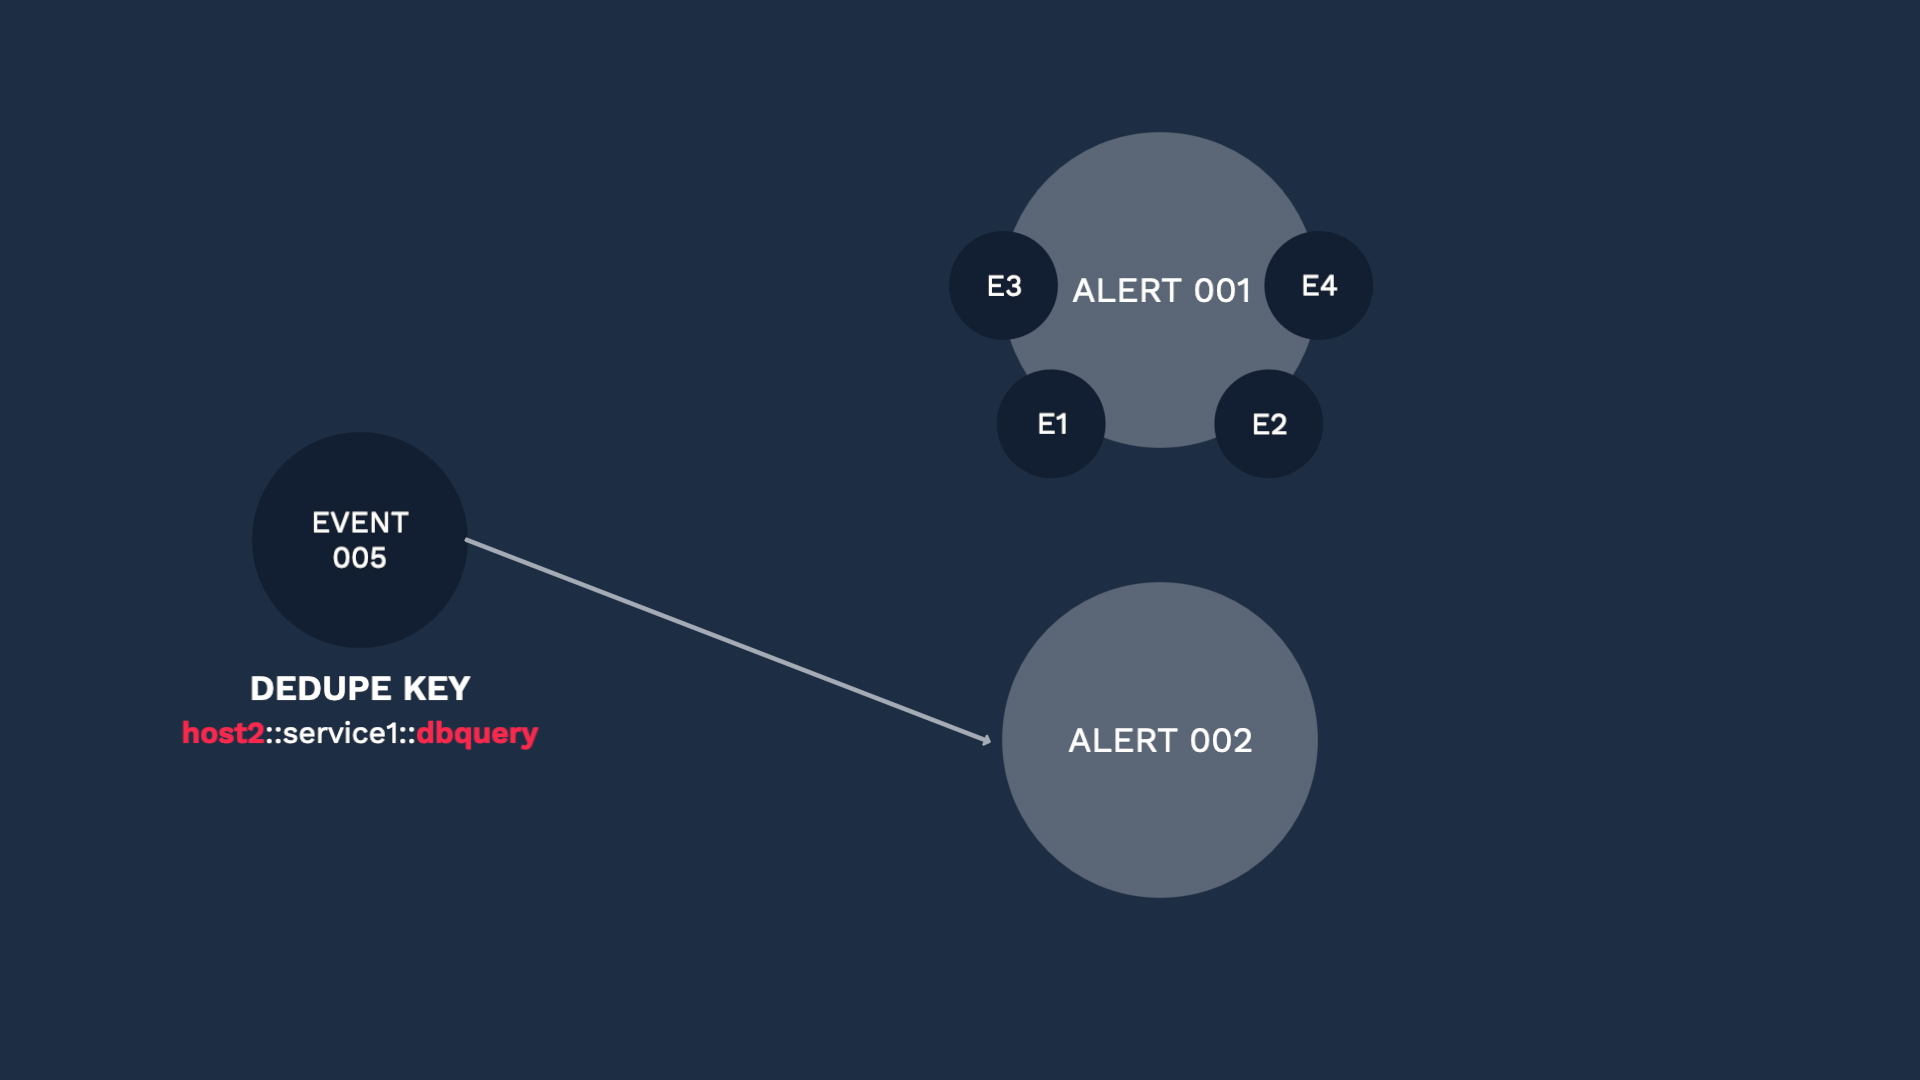
Here comes another event, and since the dedupe key is different, it is categorized into a separate alert. Like this, selecting the right fields for your use case is the key factor for successful deduplication. The default is set to be the combination of the Source, Service, and Check fields, but you can select what works for you. Just ask yourself, what should be the common factors for two events to be considered duplicates.
Going back to our custom integration, these are the default fields for deduplication. You can change them if you wish, but Incident Management recommends you use the defaults unless your business needs require that you use different fields.
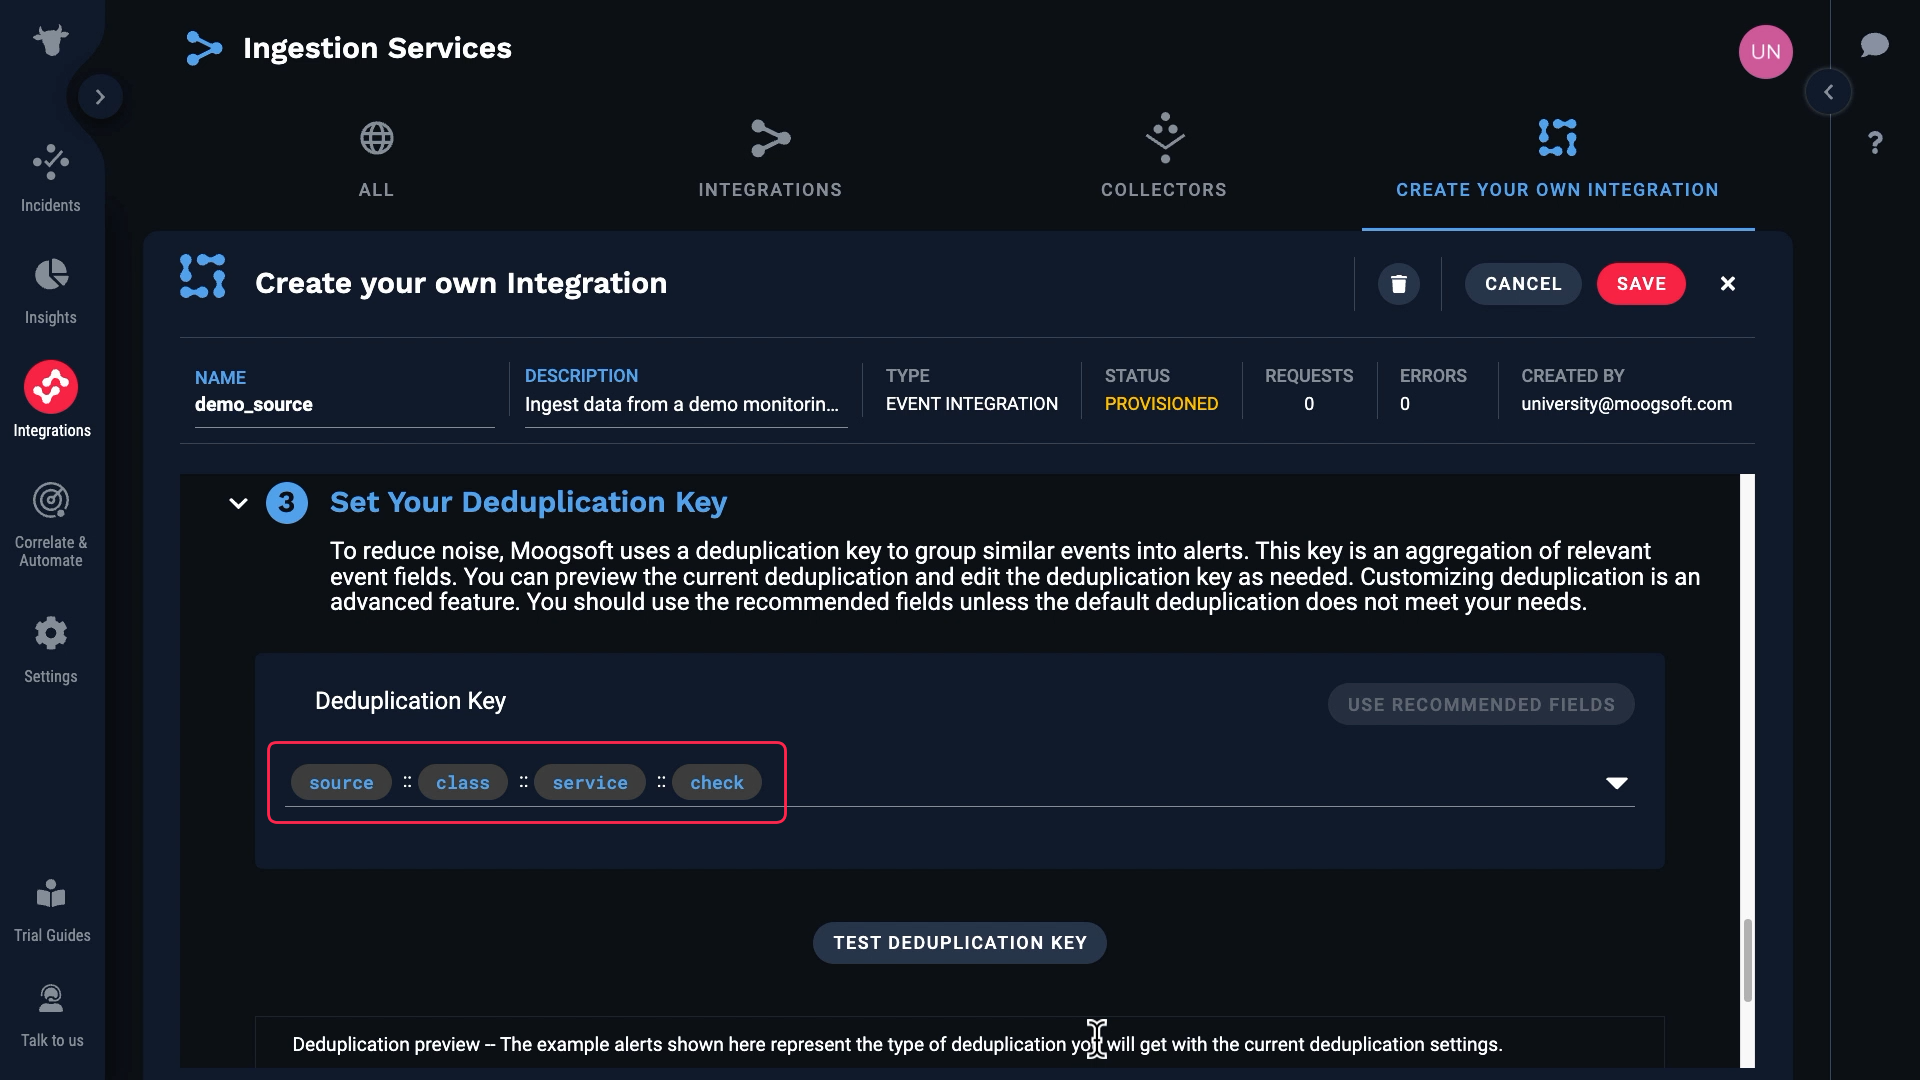
In our case we don’t have a value for class, so we’ll remove that from the default keys.
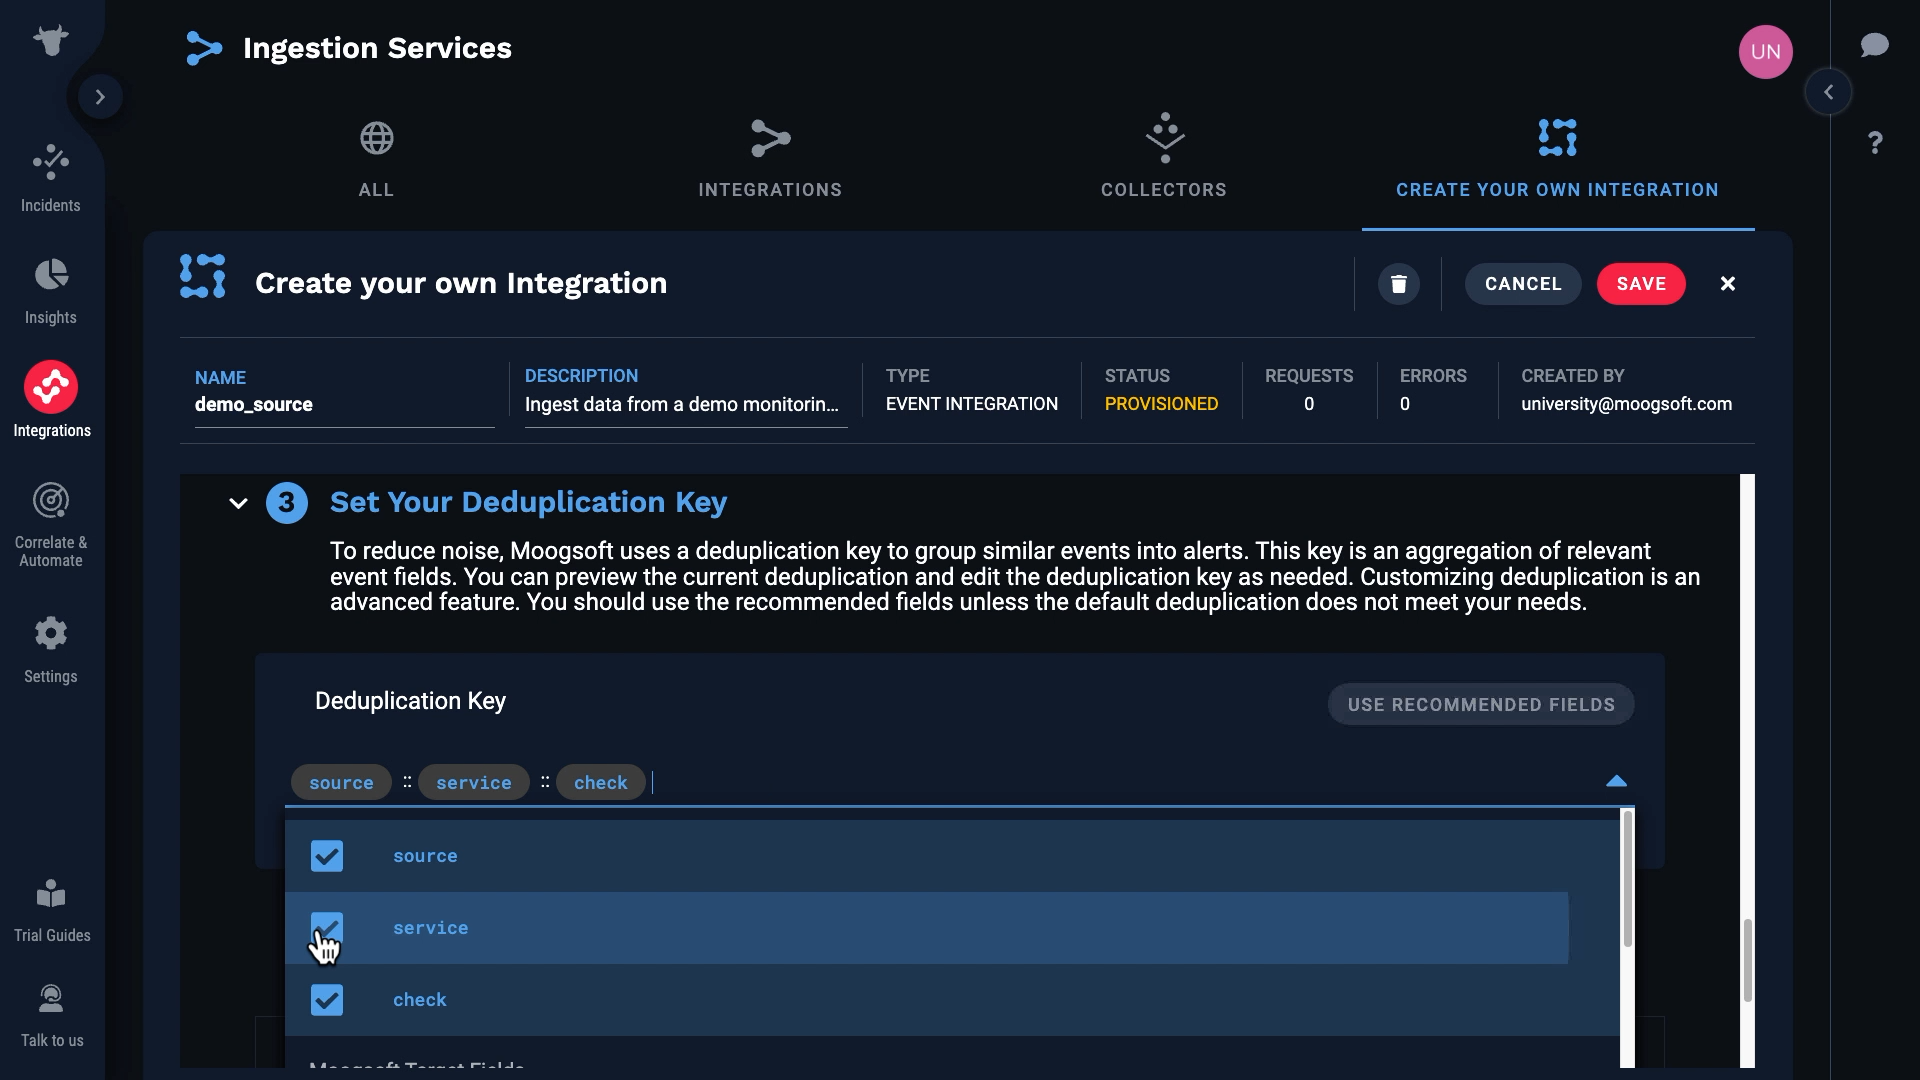
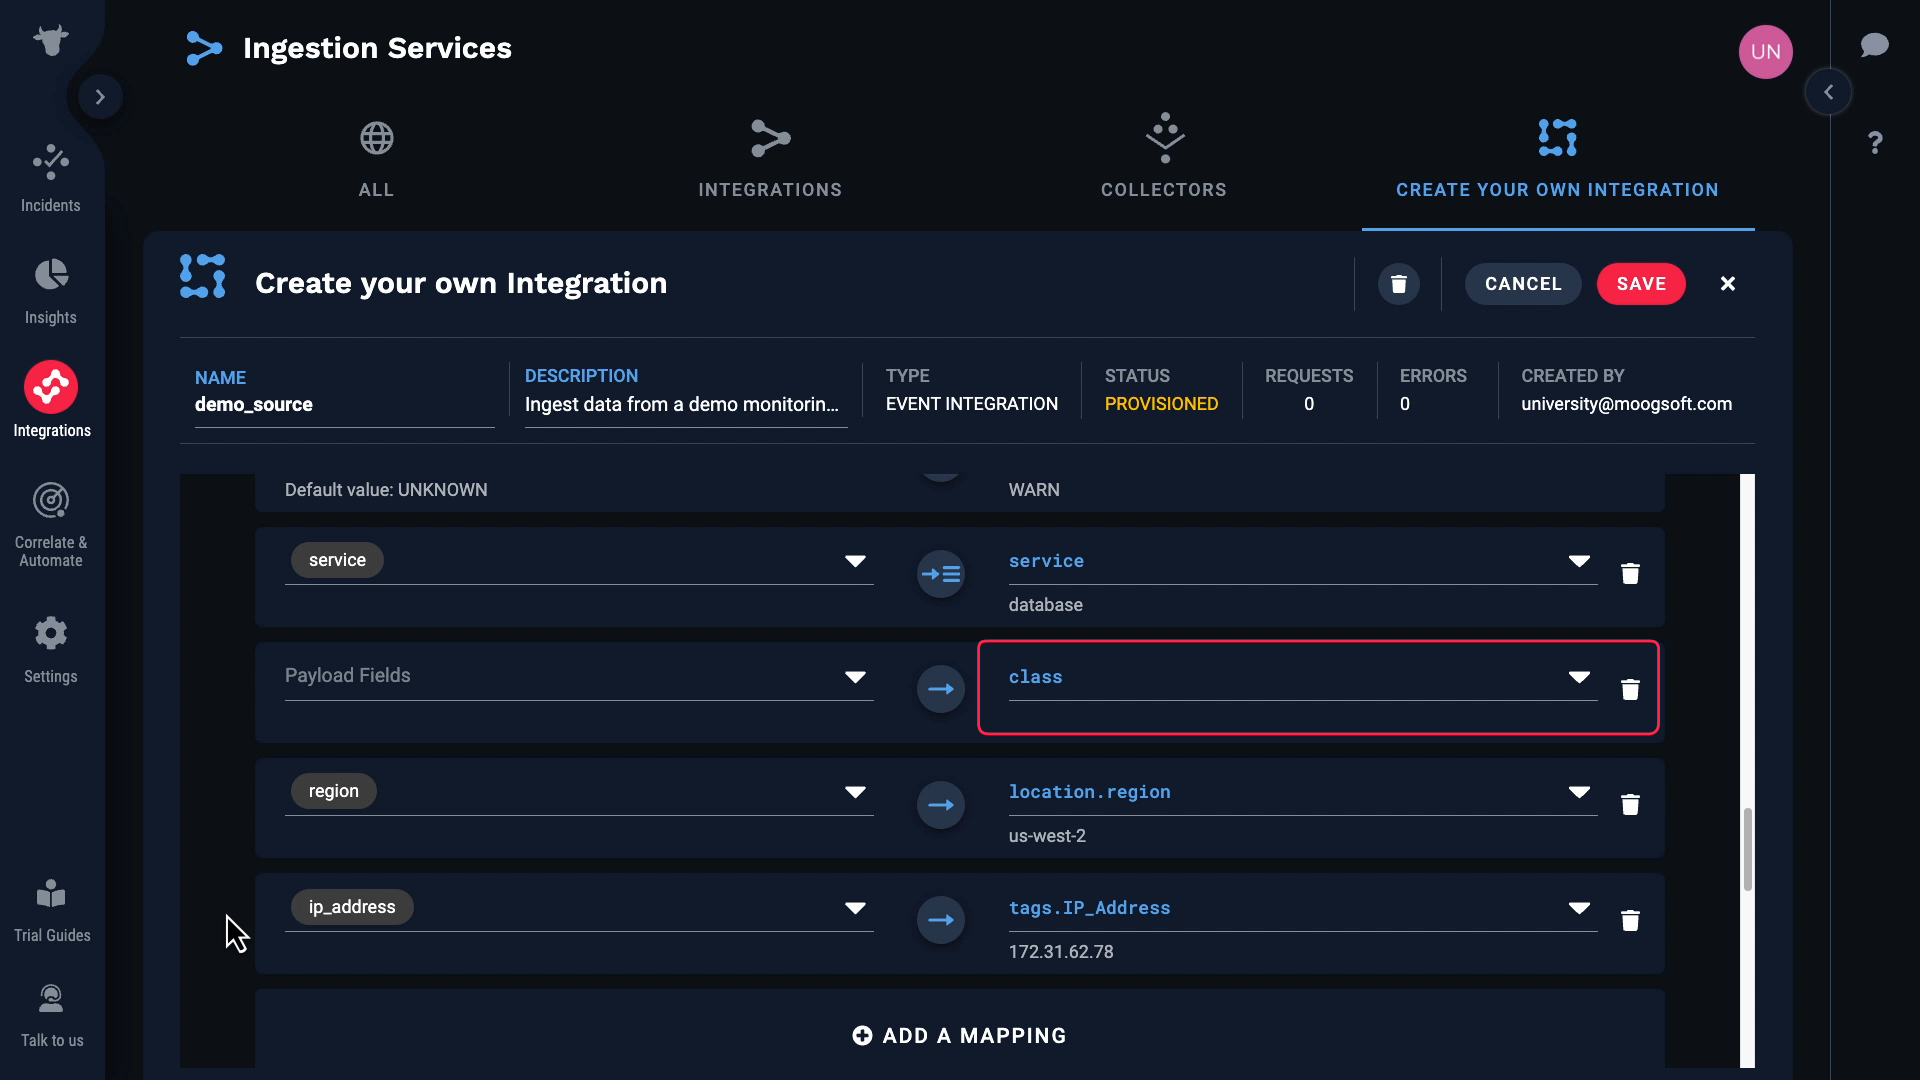
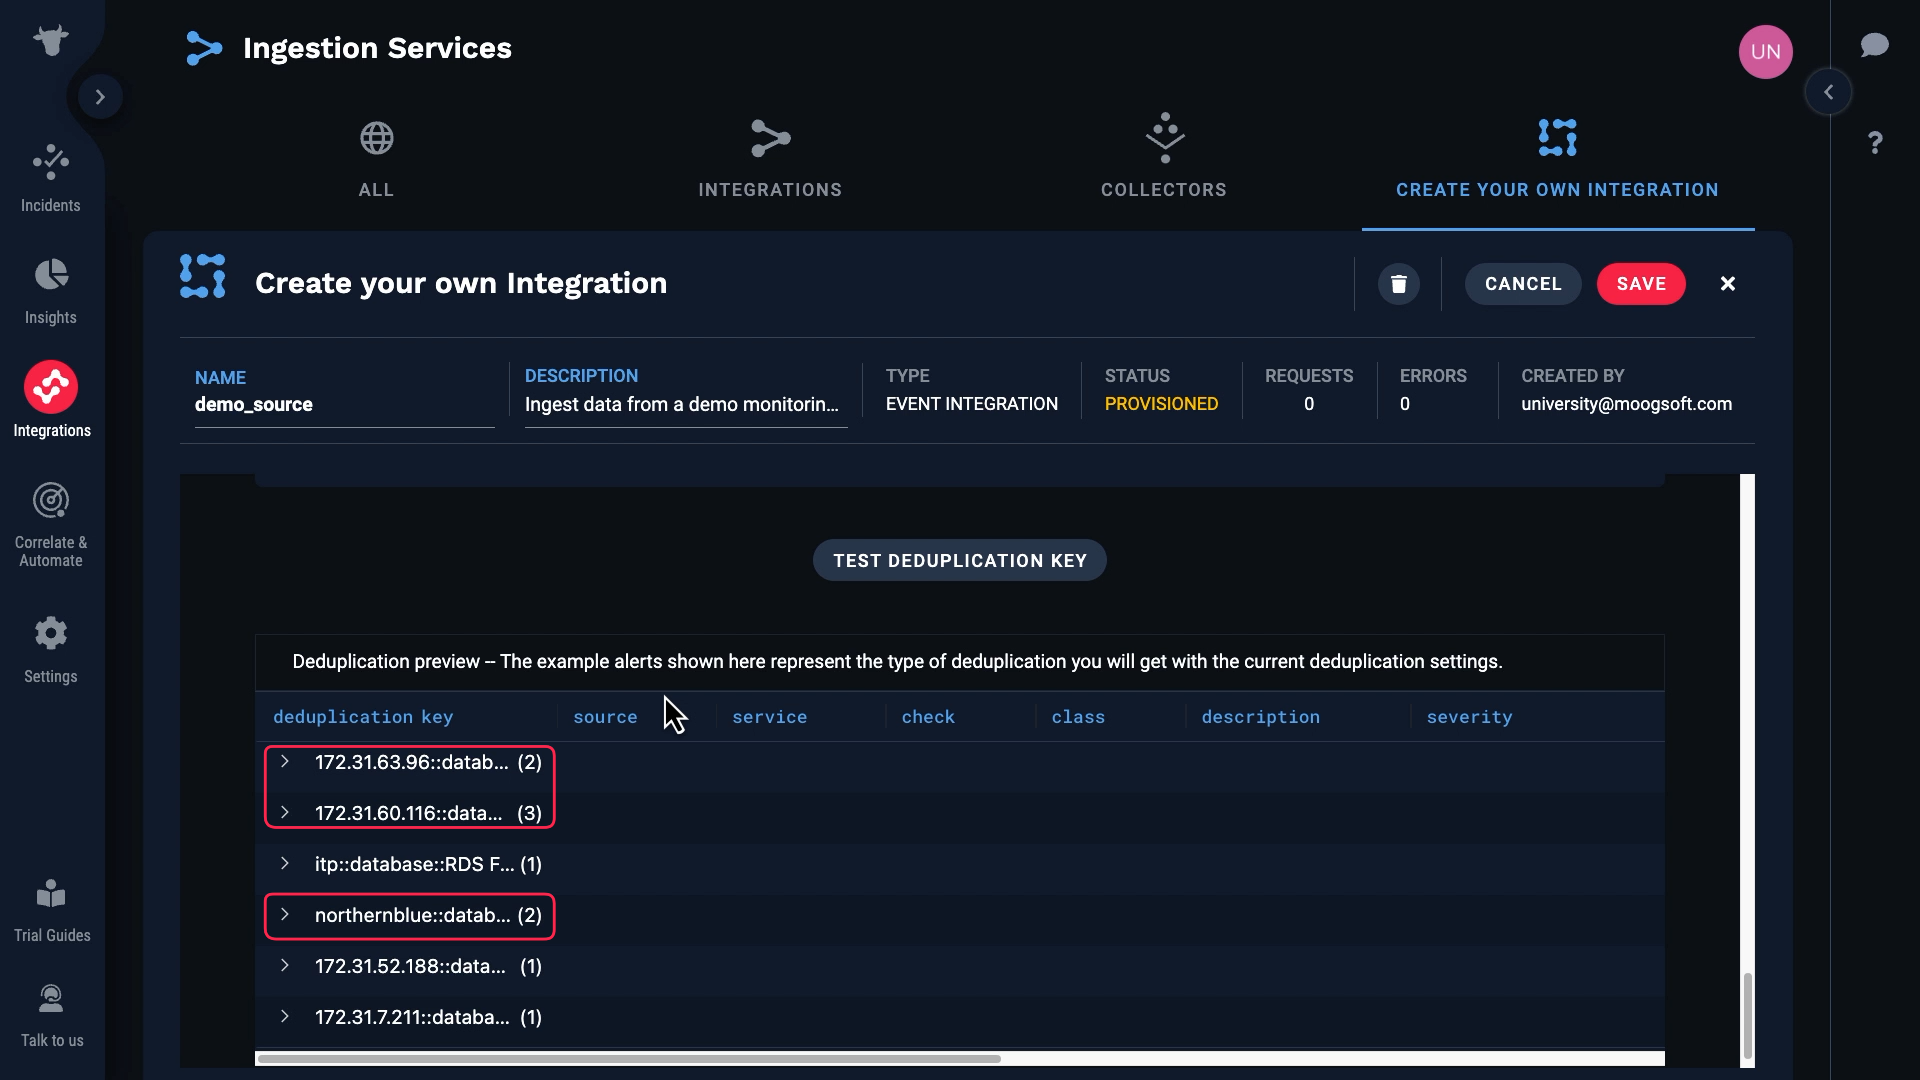
Let’s test. Success! Here are the resulting deduplication keys.
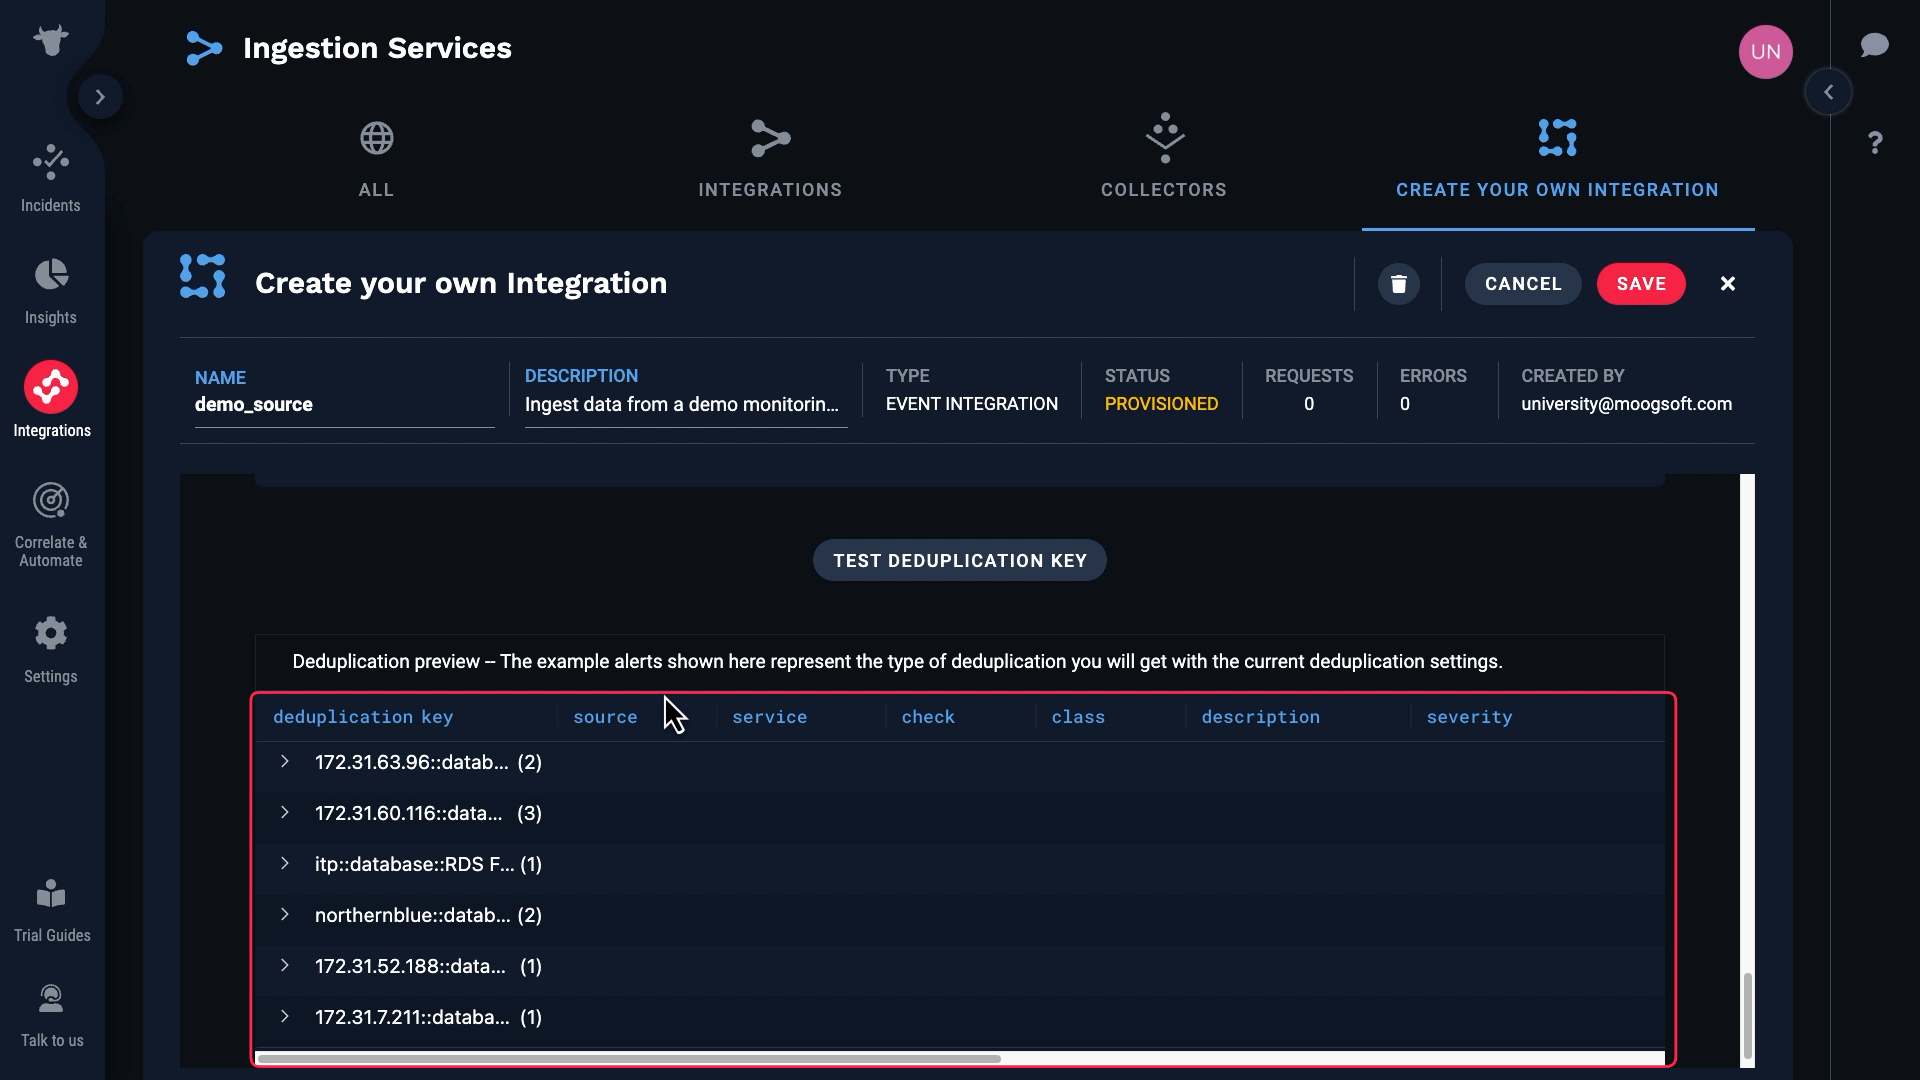
Based on these values, some of the events have been assigned to the same alert.
Our custom integration is ready to go. Let’s save and activate it. Note that it will stay in provisioned status until Incident Management processes an event.
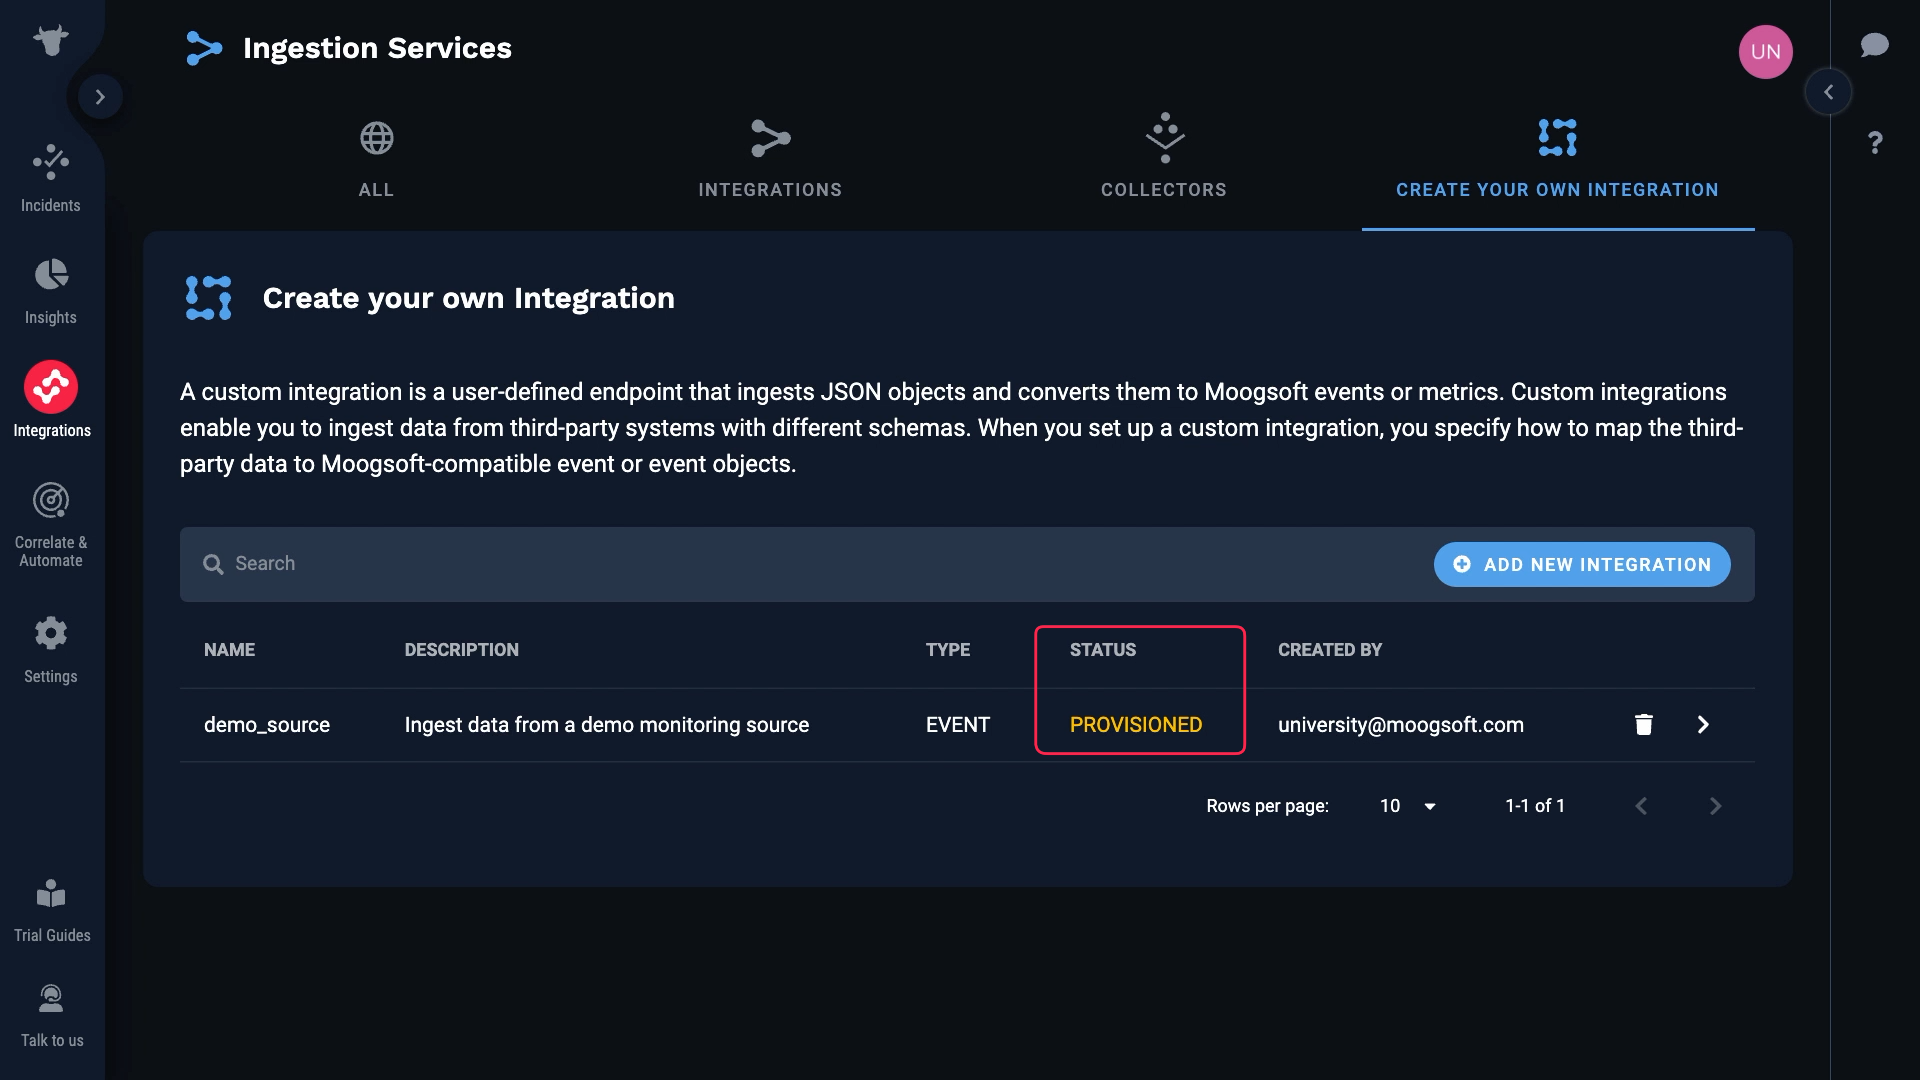
The monitoring data is flowing into Incident Management through our custom integration. Thanks for watching!
