Anomaly detection settings reference
You can customize how APEX AIOps Incident Management detects anomalies and collects metric data for an individual metric by configuring metric policies. The following settings are available in policies:
Anomaly Detector: Use either fixed thresholds or adaptive thresholds to determine the range of normal data values.
Anomaly Generation: Generate an anomaly only when the metric changes state (True) or for every anomalous data point (False)
Confidence Zone: A range of values with a fixed upper and lower threshold for the Adaptive detector which are considered normal and never produce anomalies.
Determine Severities: Choose whether to use calculated confidence to determine severity or set the number of deviations for each severity value.
Deviation: The number of standard deviations from the norm to determine if a data point is anomalous.
Hold The number of anomalous data points to observe before generating an anomaly event.
Hold for Reset: When a metric is in an anomaly state, this setting determines the number of non-anomalous data points to hold for before resetting the metric severity to Clear.
Learning Threshold: The number of data points to collect before anomaly detection begins.
Minimum Deviation: The minimum possible deviation used to calculate anomalies, based on the historic range of values. This setting is useful for metric data sets with very small ranges.
Symmetric: By default, the Adaptive detector calculates the same sigma value for anomalies in both directions to determine anomalies above and below the metric mean. Disable the Symmetric setting to calculate upper and lower sigma values independently.
Threshold Range Samples: The number of data points to sample before determining high and low threshold ranges.
Vector: Consider Low Threshold or High Threshold only, or both High and Low thresholds to identify anomalies.
Hold
The number of anomalous data points to hold for until generating an event. Suppose Hold = 1. When a metric generates an anomaly, the detector holds for one more anomaly before it generates an event.
The Hold window is 1 by default for most supported metrics. You might want to increase this number for a specific metric in the following corner case:
You want to reduce the "noise" for a metric that generates a lot of repeat anomalies. This can happen if a metric has a very short polling cycle and moves frequently between normal and anomalous range. This can cause the detector to generate a series of repetitive anomalies that say, in essence, "this metric is constantly switching between normal and anomalous range."
Note
If you increase the Hold window, the detector might miss some anomalies that do not generate enough consecutive data points to trigger an anomaly event.
Consider the following metric, which switches between anomalous and normal states every 2 minutes or so. When hold-for and reset-hold-for are both set to the default of 1, this results in a spurt of anomalies.
You might decide that this is normal behavior, and that you only want to generate anomalies when the metric is in anomalous state for 3 minutes or more. In this case, set hold-for and reset-hold-for to 2 or higher.
Anomaly Generation
When State changes only is selected, generate an anomaly only when the metric changes state: when it enters an anomalous state, when its value changes significantly while in an anomalous state, or when it returns to a normal state.
When Every anomalous data point is selected, generate an anomaly for every anomalous data point.
State changes only is selected by default. You might want to select Every anomalous data point instead for a specific metric in the following corner cases:
You are sending anomaly data to Incident Management and you need to consider every anomalous data point for your AIOps analyses.
You are receiving anomaly notifications using the Slack integration, and a metric of interest has a very long polling cycle. You might want to see every anomalous data point for this metric and thereby ensure that you continue receiving Slack notifications until the metric performance returns to normal.
Minimum deviation
The minimum possible deviation used to calculate anomalies, based on the historic range of values. This setting is useful for metric data sets with very narrow ranges.
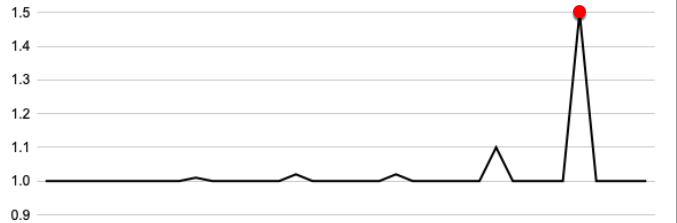
Consider the following metric, where the value remains within 1.0 and 1.05 nearly all the time. If the range of values is very narrow, even tiny deviations can result in "false-positive" anomalies.
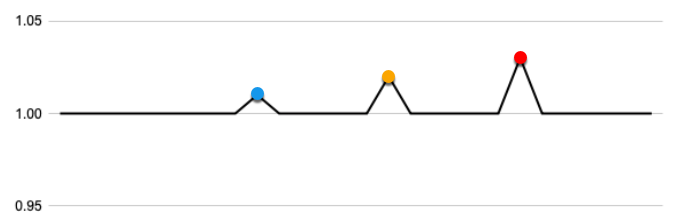 |
With the minimum deviation set to 0.3, only values outside of 0.3 times the mean (plus or minus) are considered for anomaly detection.
 |
Deviation
The number of standard deviations to determine if a data point is anomalous. You might want to change this setting in the following cases:
A metric changes frequently and over a wide range, which causes the detector to flag non-anomalous data points as "false-positive" anomalies. In this case you might want to increase the number of deviations.
A metric changes very little and a data point outside the norm, even by a small amount, indicates an anomaly. In this case you might want to decrease the number of deviations.
Note
Changing the number of deviations can affect anomaly detection dramatically. As with any change to an anomaly detector, you should closely monitor the metric after you apply the change to ensure that you are getting the detection behavior you want.
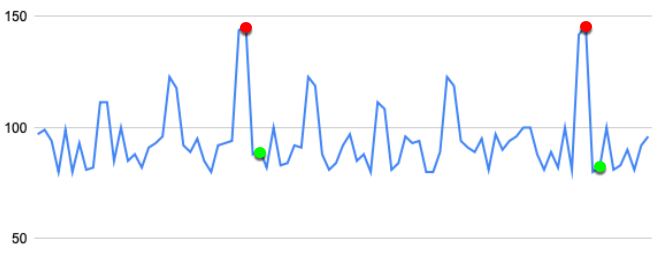
Consider the following metric, where the number of deviations is set to 4.
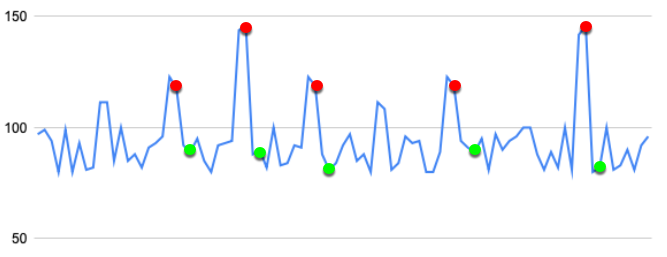
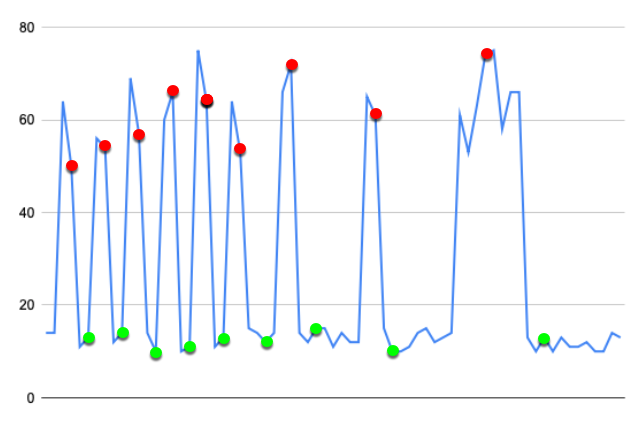
If we lower the number of deviations to 2, more data points are now considered anomalous.
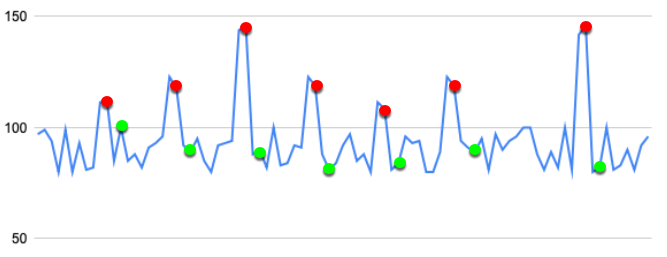
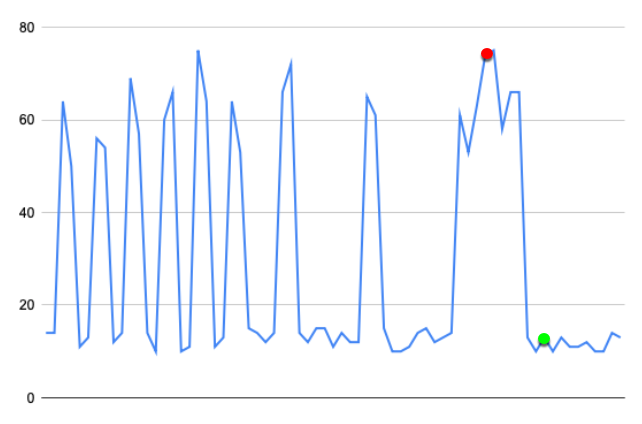
If we raise the number of deviations to 8, fewer data points are now considered anomalous.