Analyze incidents with the Situation Room Timeline
The Situation Room Timeline is a chronological visual representation of the activities which occurred within a specific incident. The Timeline chart provides an at-a-glance overview of activities, while the list below it includes detailed information and links to specific resources and configurations.
Use the Timeline chart to get an overview of incident activity. The chart lets you see when different activities occurred within relation to each other, when clusters of changes happened close together, and if there have been large gaps in incident activities.
The alerts which are part of an incident
Highest severity for alerts
When changes to status for alerts and incidents happened
Correlation definition details
The correlation definition responsible for the incident creation displays in the timeline
Changes in assignments
Which individuals and groups were assigned to the incident or to member alerts, and when the assignment happened
Comments
When comments were added, and who added them
Incident and alert changes on external systems
If you have an external integration set up that sends events to APEX AIOps Incident Management, new timeline notations will occur when events on the external system affect alerts or incidents. These changes could include any of the other items included in this list, but occurring on the external system and passed along to Incident Management.
 |
Activities
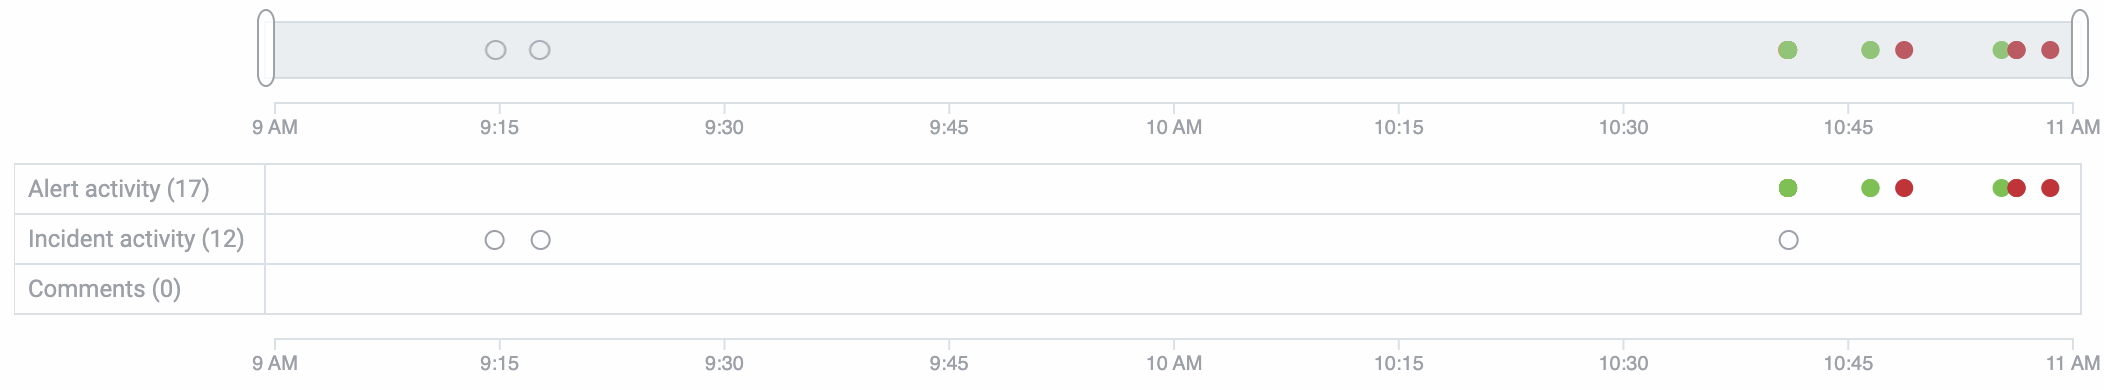
The activities displayed in the chart are divided into three categories:
Alert activity
Incident activity
Comments
The number in parentheses indicates the number of changes occurring within each type of activity. The row for each displays circles when additions or changes happen for the items represented by that row.
For example, when a new alert is added to an incident, the Alerts row in the chart adds a circle to represent that addition.
Note
The first alert added to an incident is represented by a circle in the Incidents row and is labeled "first event," but there is no indicator for the first alert in the Alert activity row.
Alerts that are created essentially simultaneously will appear as one alert in the chart. The list beneath the chart accurately lists all of the alerts added during the currently selected time period.
Changes to alert assignments and statuses add additional circles to the Alerts activities row.
Color-coding
Color-coding lets you quickly see the maximum severity alerts in an incident reached during the course of the incident. For circles representing alerts, the color-coding matches the severity.
Color-coding for alerts follows this convention:
Color | Severity |
|---|---|
red | critical |
orange | major |
yellow | minor |
blue | warning |
green | clear |
purple | unknown |
Assignment and status change activities use solid gray, incident activities use a circle with a gray outline, and comments use a circle with a blue outline.
Hover text
Hovering over a circle in the chart instantly lets you know the type of change that happened. To get further details on the change, check the list at the bottom of the tab.
Timeline focus
Use the sliders at each end of the timeline to focus in on a shorter segment of time. Moving the sliders closer together zooms in on the time in between, and fills the activities section below it. If multiple changes happened close together, the sliders let you expand the time so you can clearly see each one.
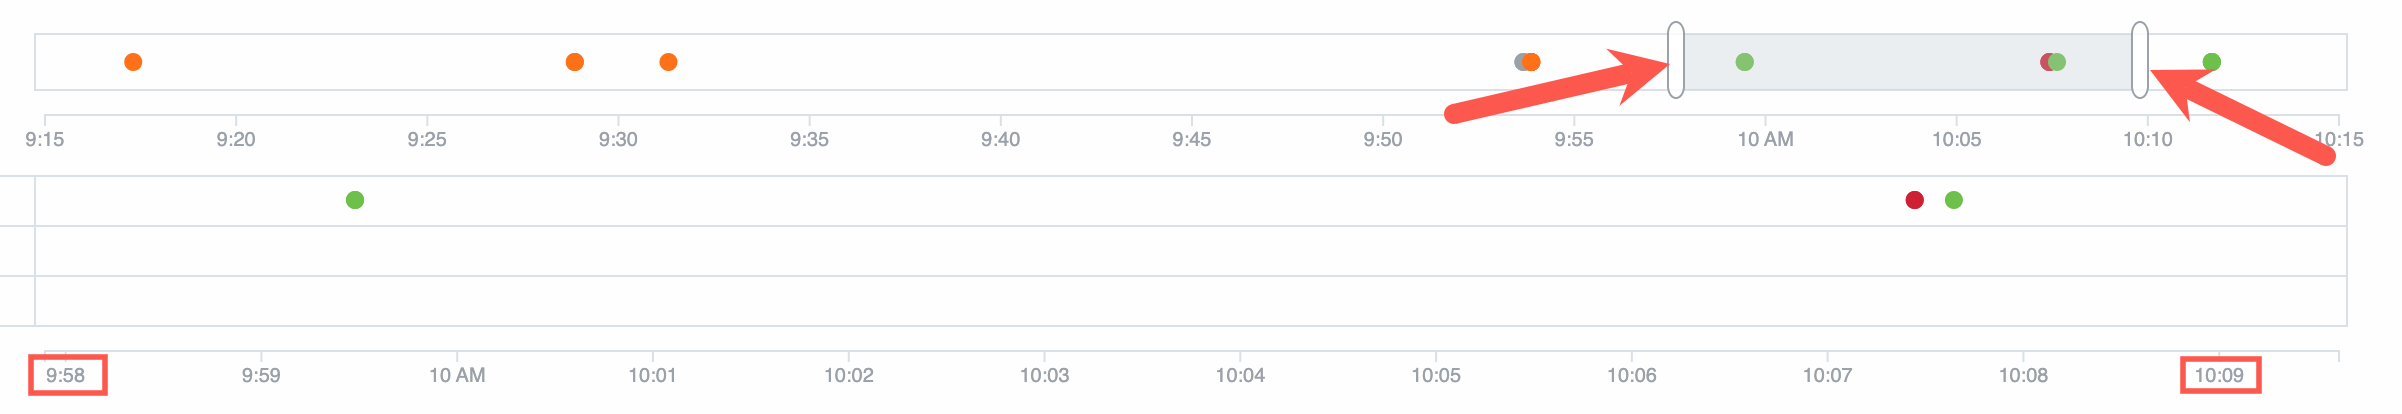 |
The list below the chart updates with the items relevant to the selected time interval.
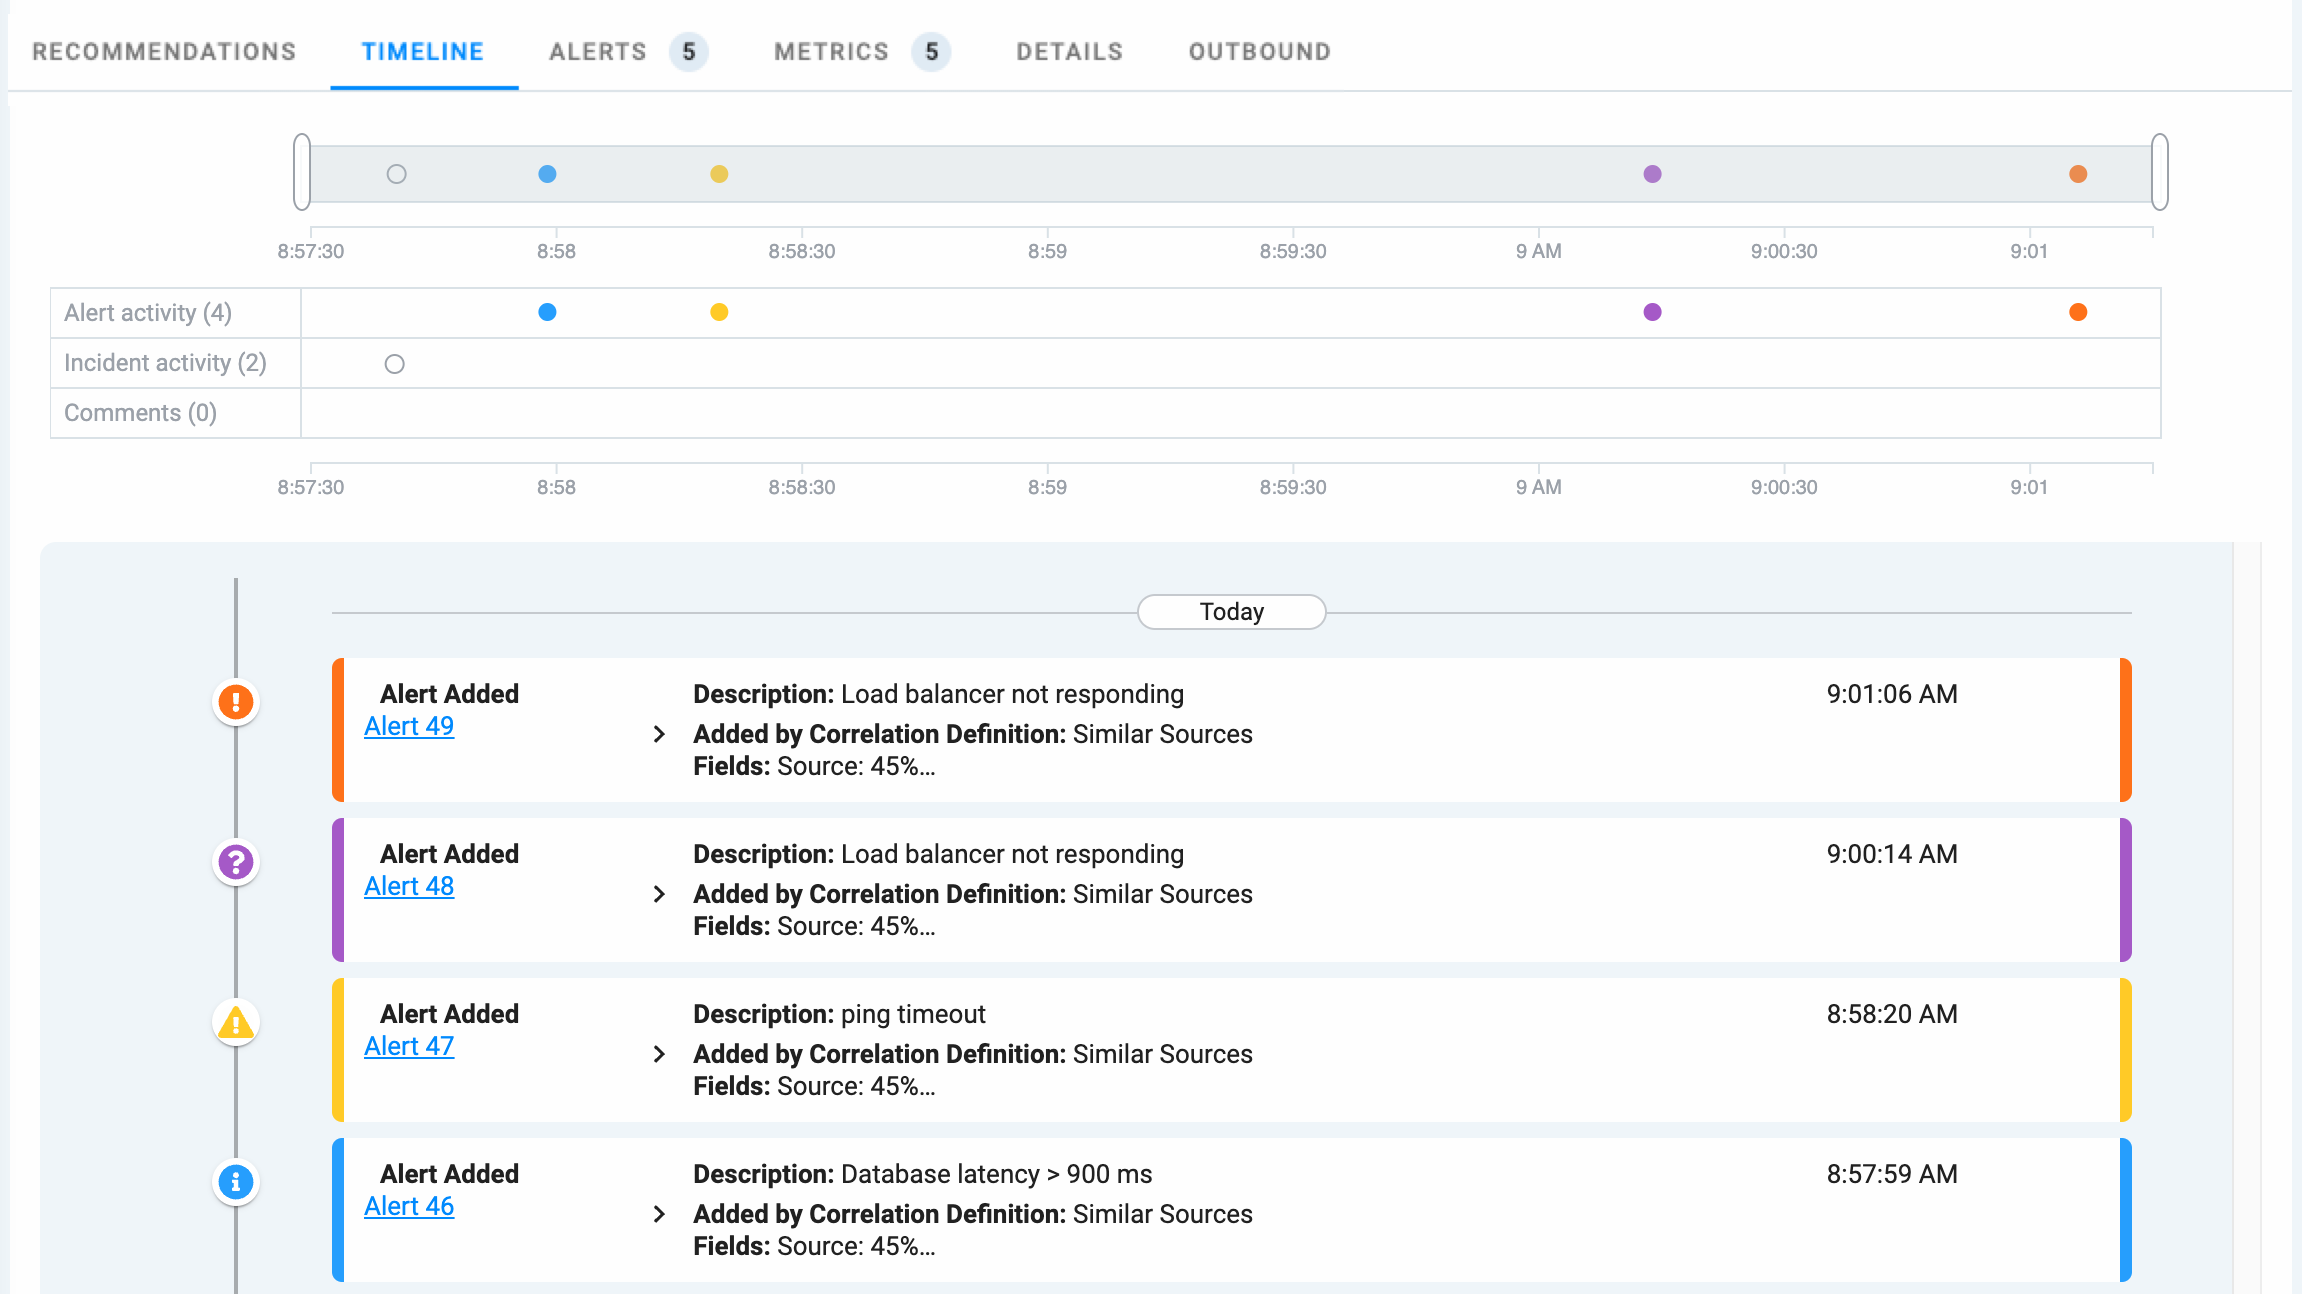
List
The scrollable list appearing below the chart is a chronological list of timestamped changes and updates which have occurred to the alerts in the incident, and to the incident itself. Scan down the list to see the updates, when they happened, and the Incident Management user who made the change. Use links in the list items to drill down into other feature areas of Incident Management to access correlation definitions and alert details.
The list includes details for the following information:
First event time
Incident creation time and details
Alerts in the incident, color-coded by highest severity
Status changes for alerts and the incident
Group assignments for alerts and the incident
User assignments for alerts and the incident
Comments added to the incident
The color-coded alerts in the list correlate with the circles in the chart.
 |
Incident creation and the reference alert
You can use the timeline to view the initiating alert in an incident, called the reference alert. This alert is usually, but not always, the first alert in an incident.
To view the reference alert, examine the chronological list of changes in the incident and find the item called "Incident Created." Expand this item, and you can see the details about the incident creation.
The settings for the correlation definition which created the incident are included.
Correlation Definition name: The user-friendly identifier for the correlation definition.
Fields: One or more alert fields used to compare alerts. Also included on this line is the degree of similarity which must be met for two alerts to be included in the same incident.
Time Window: The length of time from the arrival of the first alert that additional alerts can be added to the same incident.
Incident Description: The correlation definition incident description, which can be any combination of numbers, letters, substituted fields, and macros.
Alert Threshold: The minimum number of similar alerts which must be present before an incident can be created. Also called the incident creation threshold.
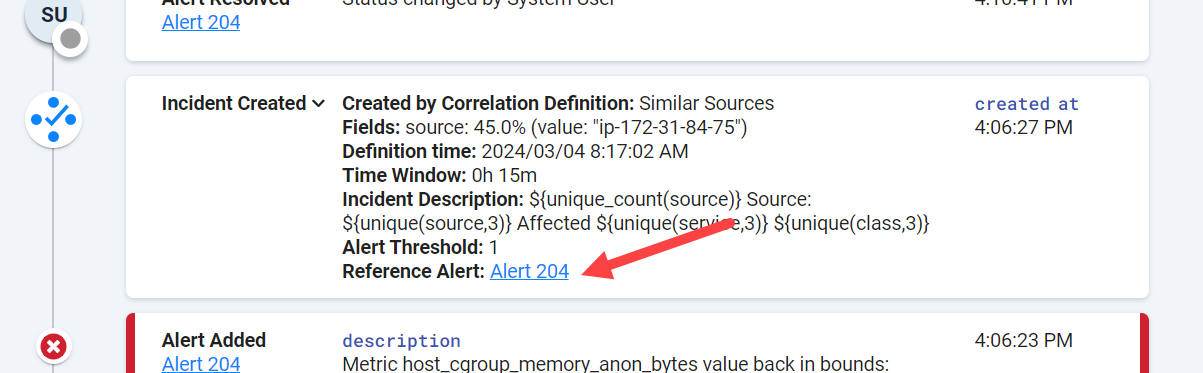 |
The Reference Alert link opens the Alerts page, where you can view the field values in the reference alert. Other incoming alerts are compared to the reference alert during correlation to determine if they are part of this incident.
In this example, the field used to correlate alerts is source with a value of "ip-172-31-84-75." Other alerts must match this value by at least 45% to be included in this incident.