View events in the event timeline
The event timeline shows the events received during a segment of time which were deduplicated to create a representative alert. You can use the event timeline to gain insight into the changes that occurred between the events over time, and how these changes impacted the alert.
You can view:
Which events were added to the alert, and when they arrived
When the alert severity changed, and which events caused the change
Detailed information on the individual events represented by a selected alert
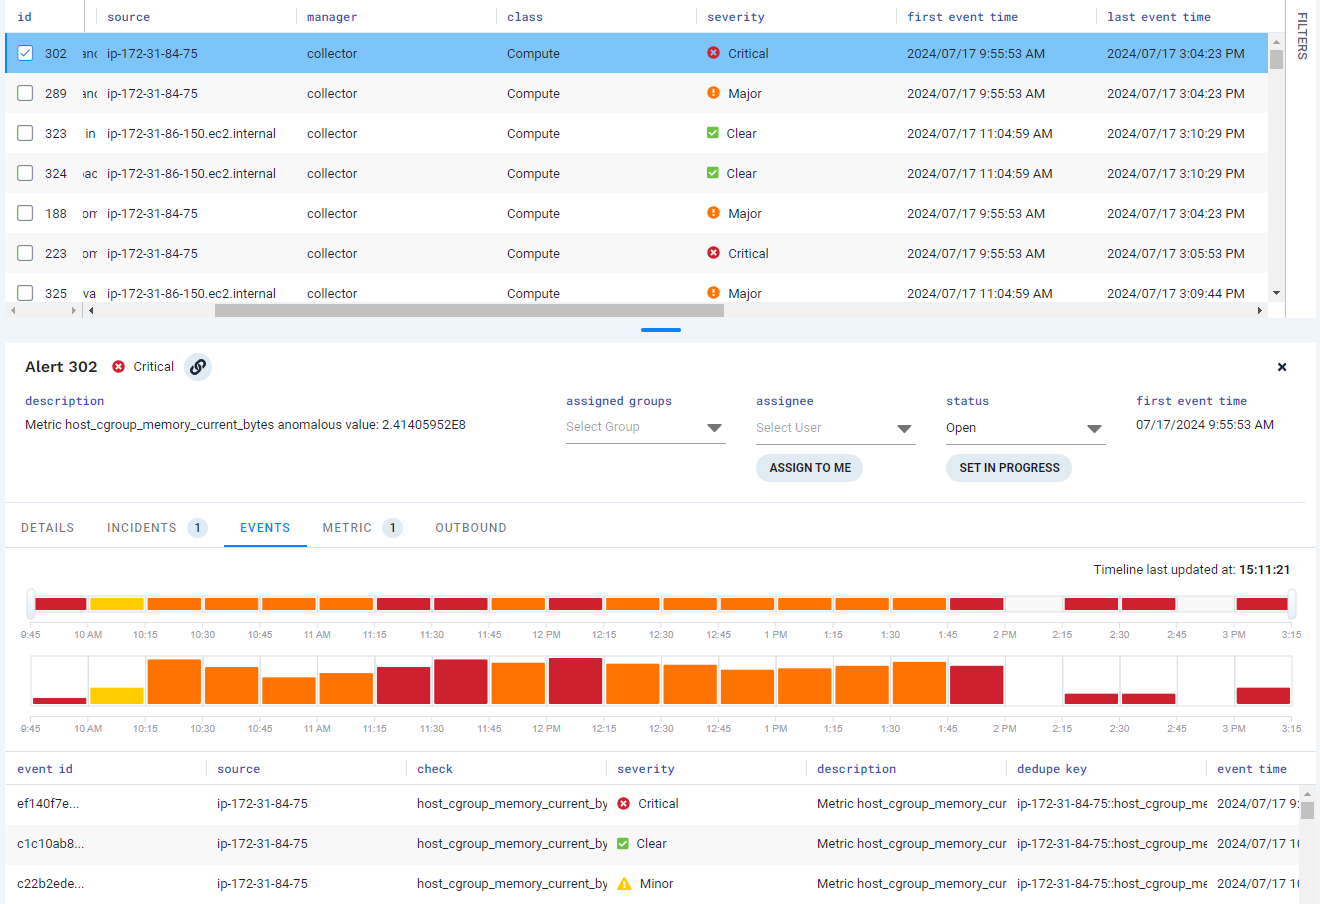
To view the event timeline, navigate to the Alerts page and select an alert in the top pane. In the alert details pane at the bottom of the page, click the Events tab.
The Events tab includes a slider bar, a timeline, and a grid view listing the events in the selected alert. The timeline displays color-coded segments which represent the events received during each period of time.
The time represented by a segment depends on how long the alert has been active, and can vary between alert selections. Segments represent time divisions which are appropriate for the current age of the alert and the available area to display the information. Each segment can represent the following time divisions:
Seconds, in divisions of 1, 5, 15, or 30
Minutes, in divisions of 1, 5, 15, or 30
Hours, in divisions of 1, 3, 6, or 12
Days, in divisions of 1 or 2
Weeks, in divisions of 1, 4, 8, 12, or 16
Segment color coding indicates the highest severity event received during that segment. The segment height indicates the relative number of events received as compared to other segments, with taller segments indicating a larger number of events.
 |
Drag the sliders on the bar above the timeline to zoom in on events received during a specific time. Details for the events appearing between the sliders display in the lower grid.
 |
You can view the event data in the following ways:
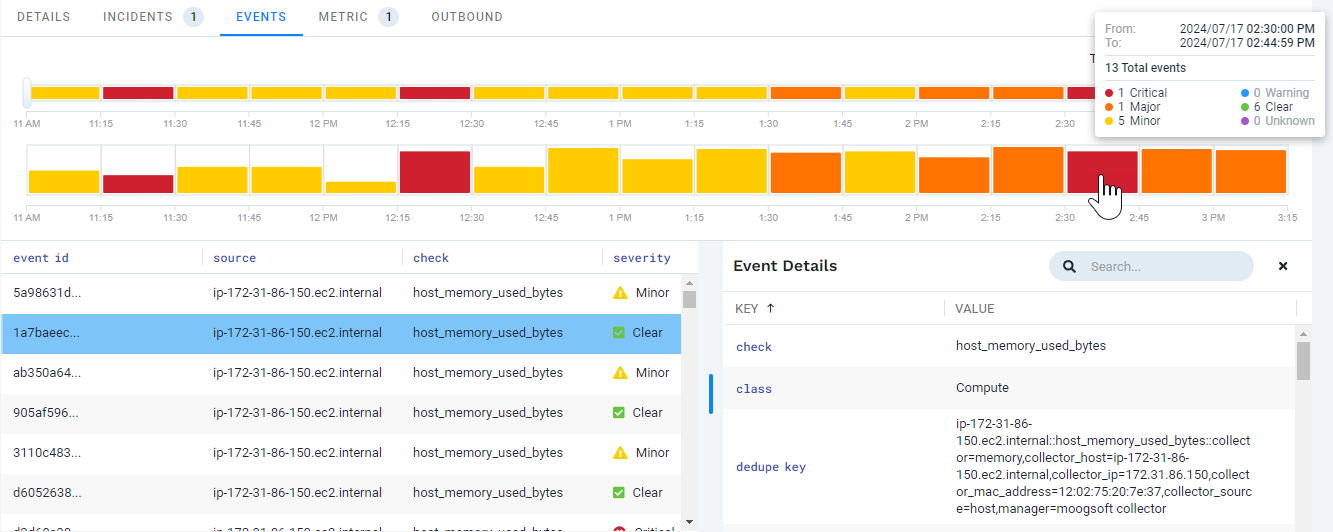
Hover over the timeline to view details for a specific segment. The number and severity of events received during that segment display.
Click a timeline segment to show the events in that segment in the lower grid.
Click a row in the lower grid to open a panel and display detailed field information for that event.
 |