Use case walkthrough: Queue and dashboards in APEX AIOps Incident Management ►
This video explains how you can use the queue and dashboards to view incidents in APEX AIOps Incident Management.
*Please note Moogsoft is now part of Dell's IT Operations solution called APEX AIOps, and changed its name to APEX AIOps Incident Management. The UI in this video may differ slightly but the content covered is still relevant.
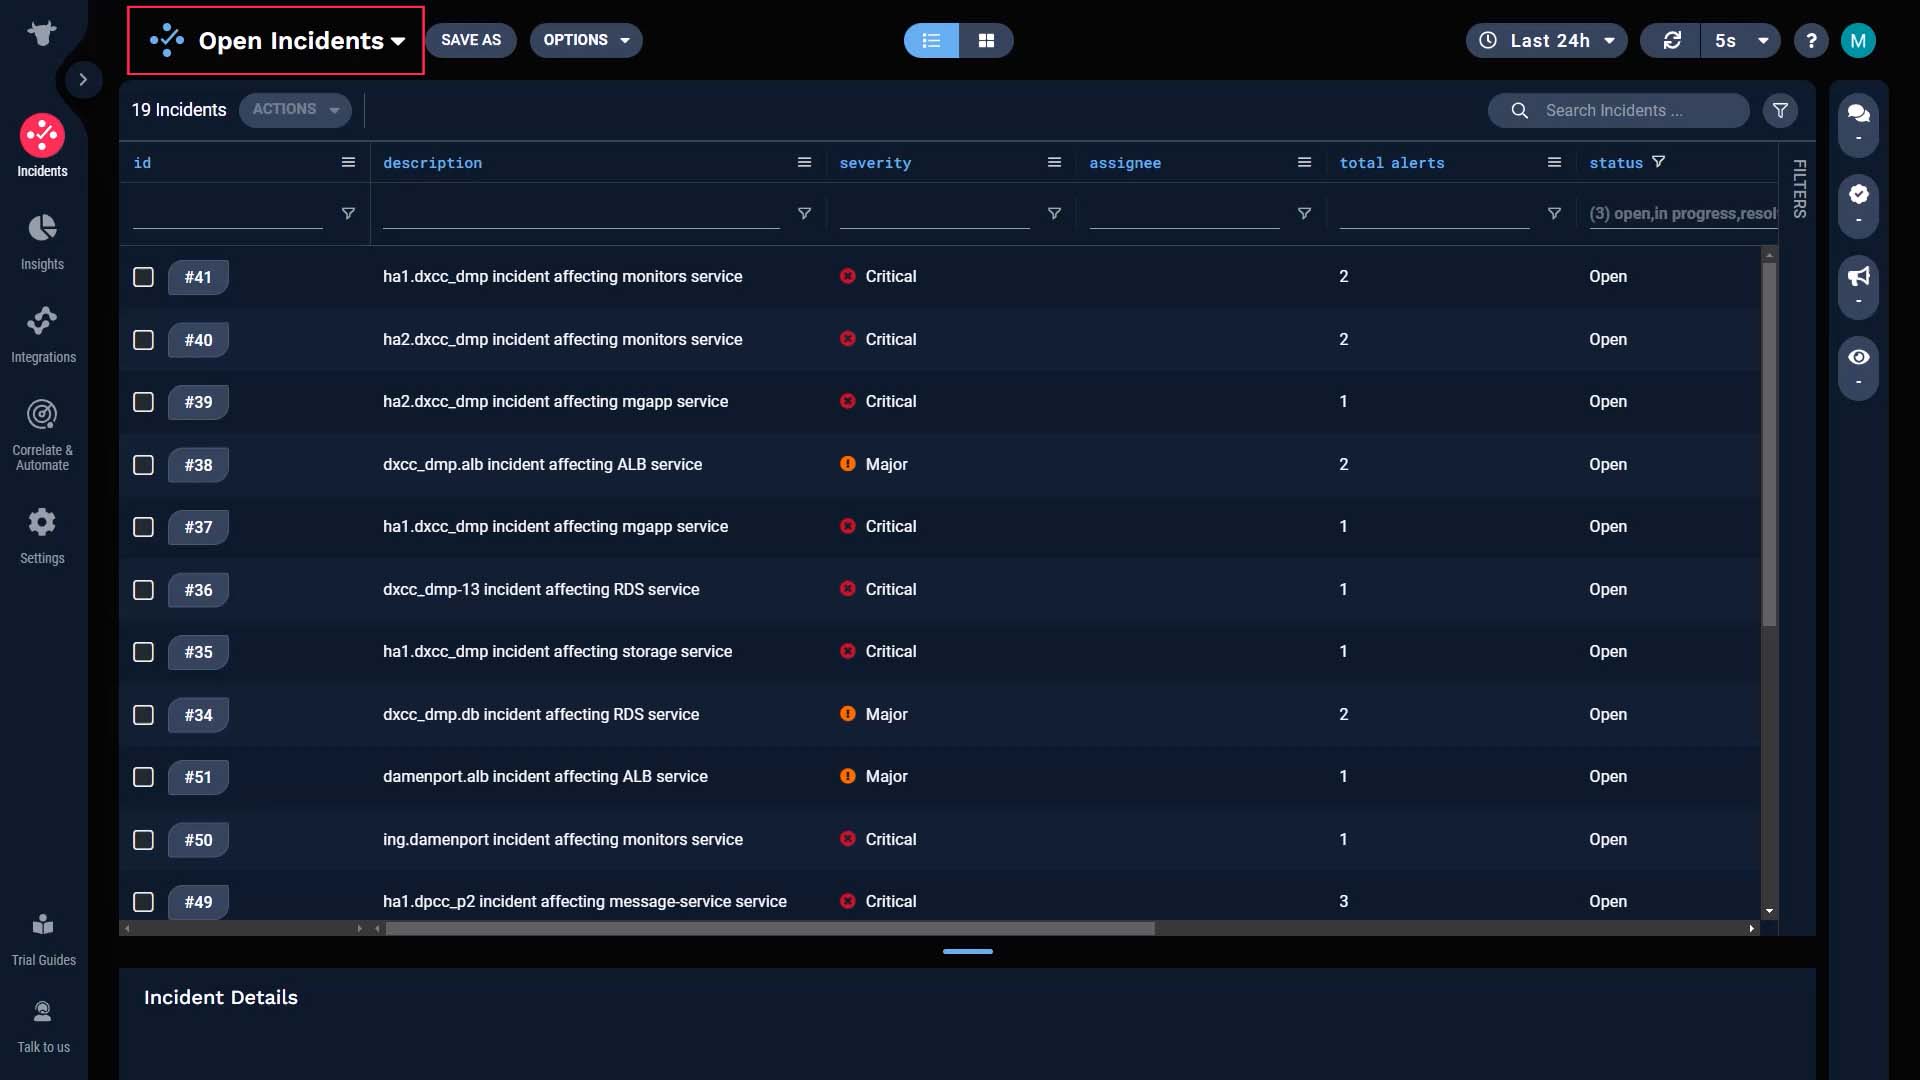
How do you know what’s coming down the pipeline for you to work on in Incident Management? This is the default incident list. This includes all open incidents, regardless of the nature of the issues or assignments.
Your operational procedure may be as simple as just looking at this list and picking an unassigned ticket.
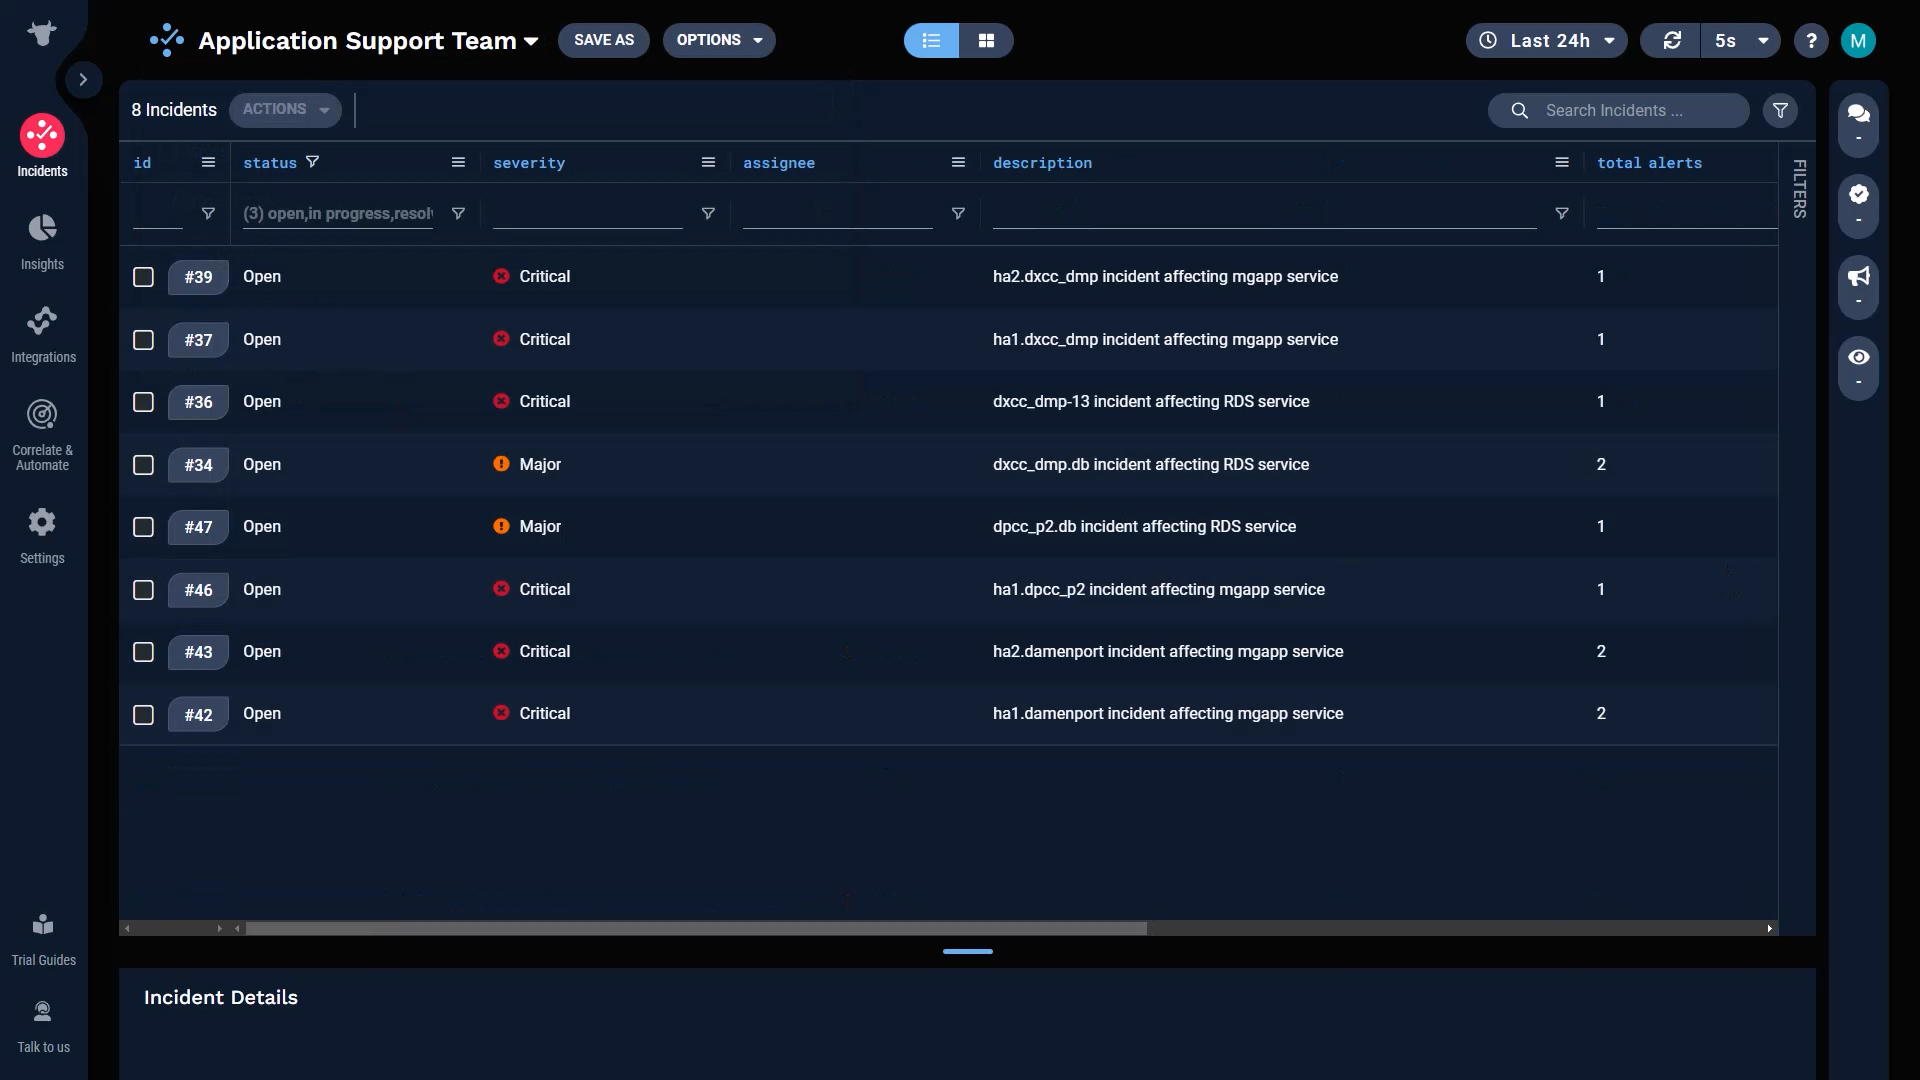
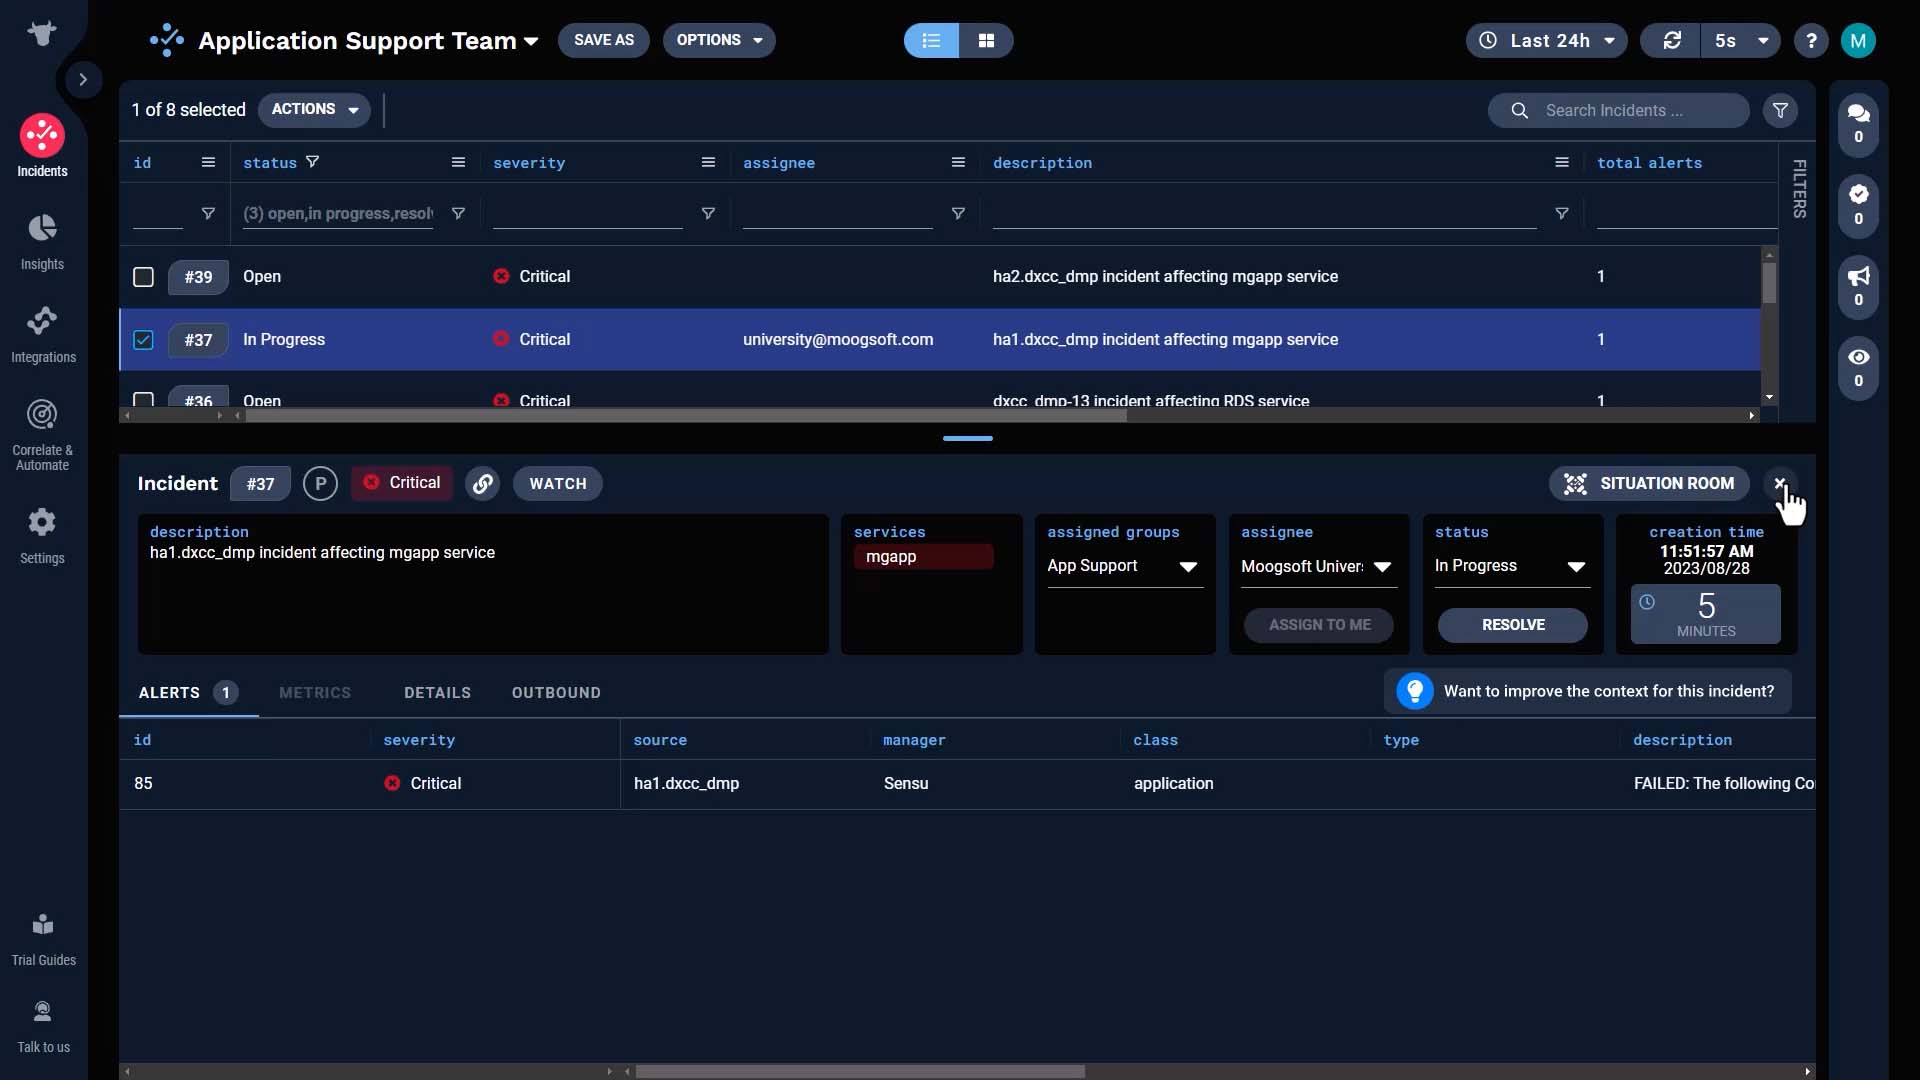
But most likely, you have a queue specific to your team. In this example, we have access to the Application Support team’s incidents view.
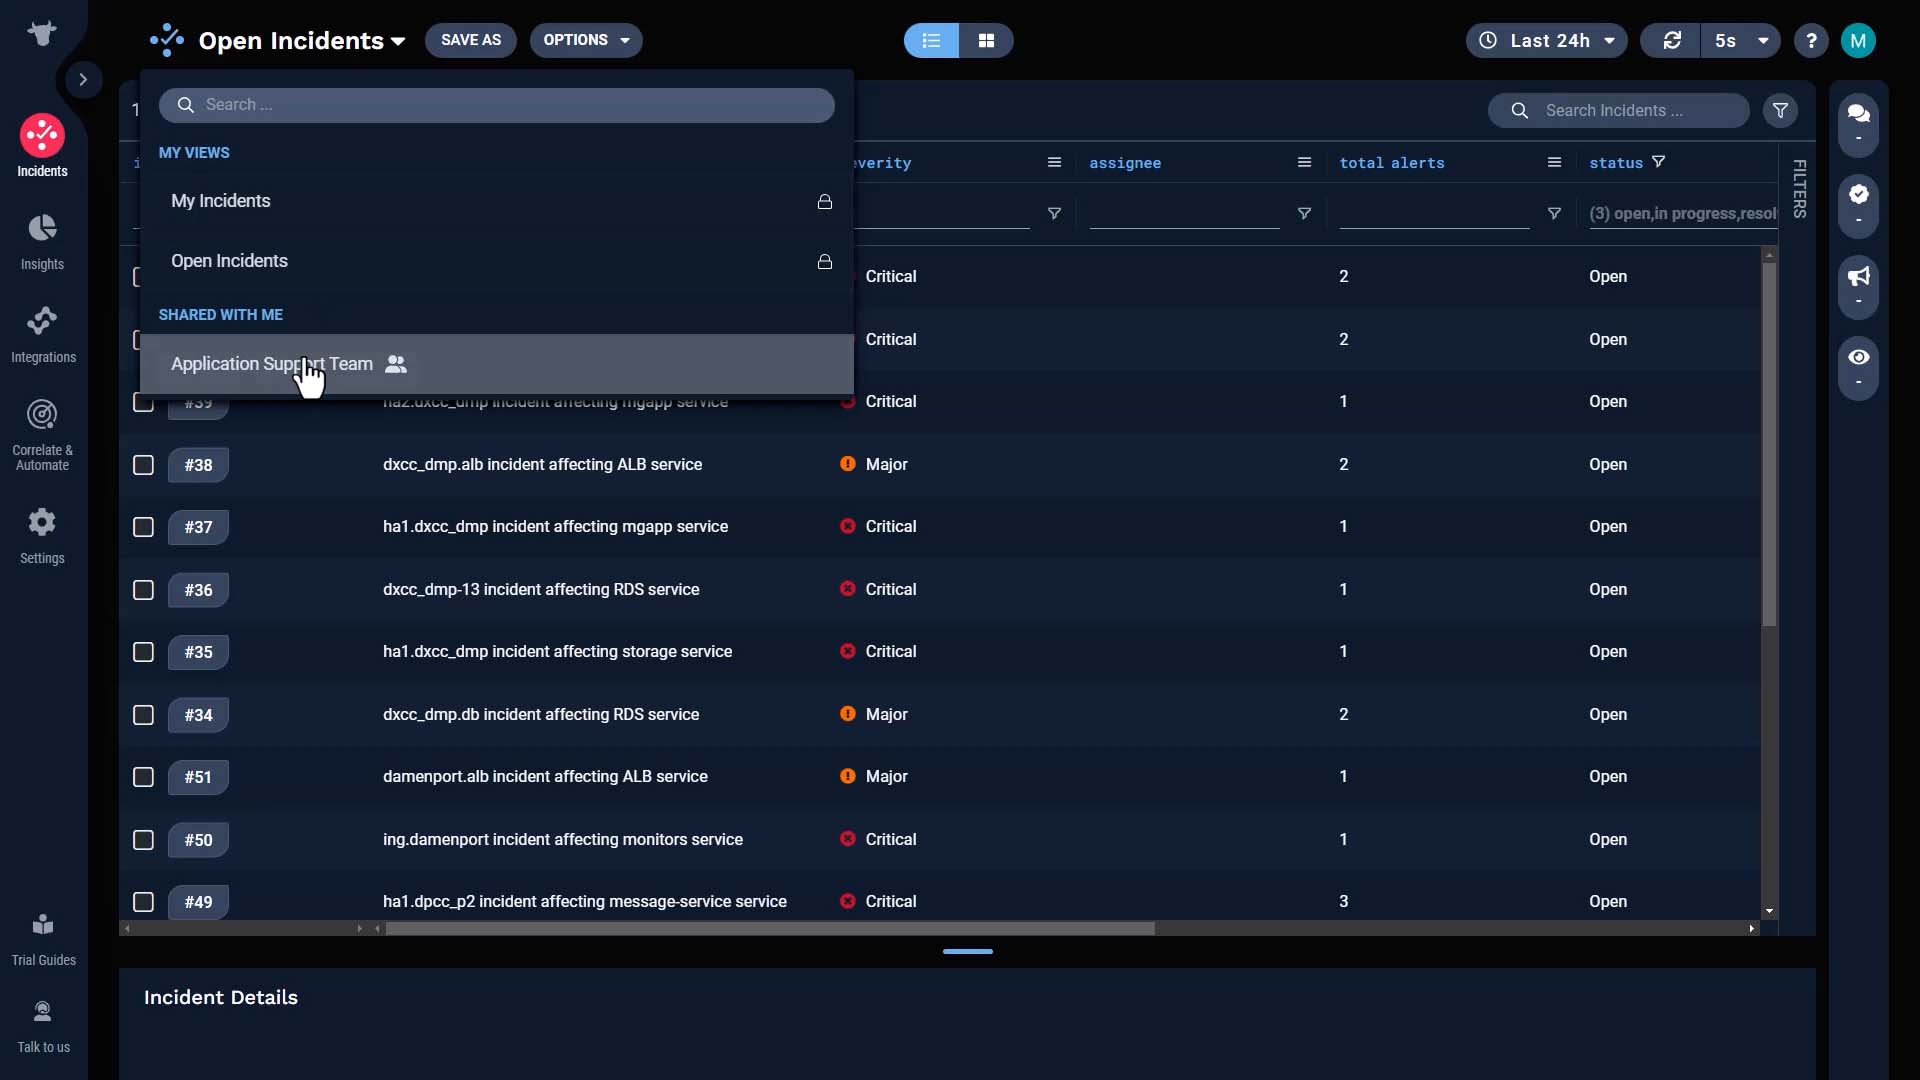
So basically this is a list of application-related incidents. Your administrator may have set up a workflow to set the team assignment based on the impacted services, or there may be someone triaging incoming incidents and routing the applicable ones to your team.
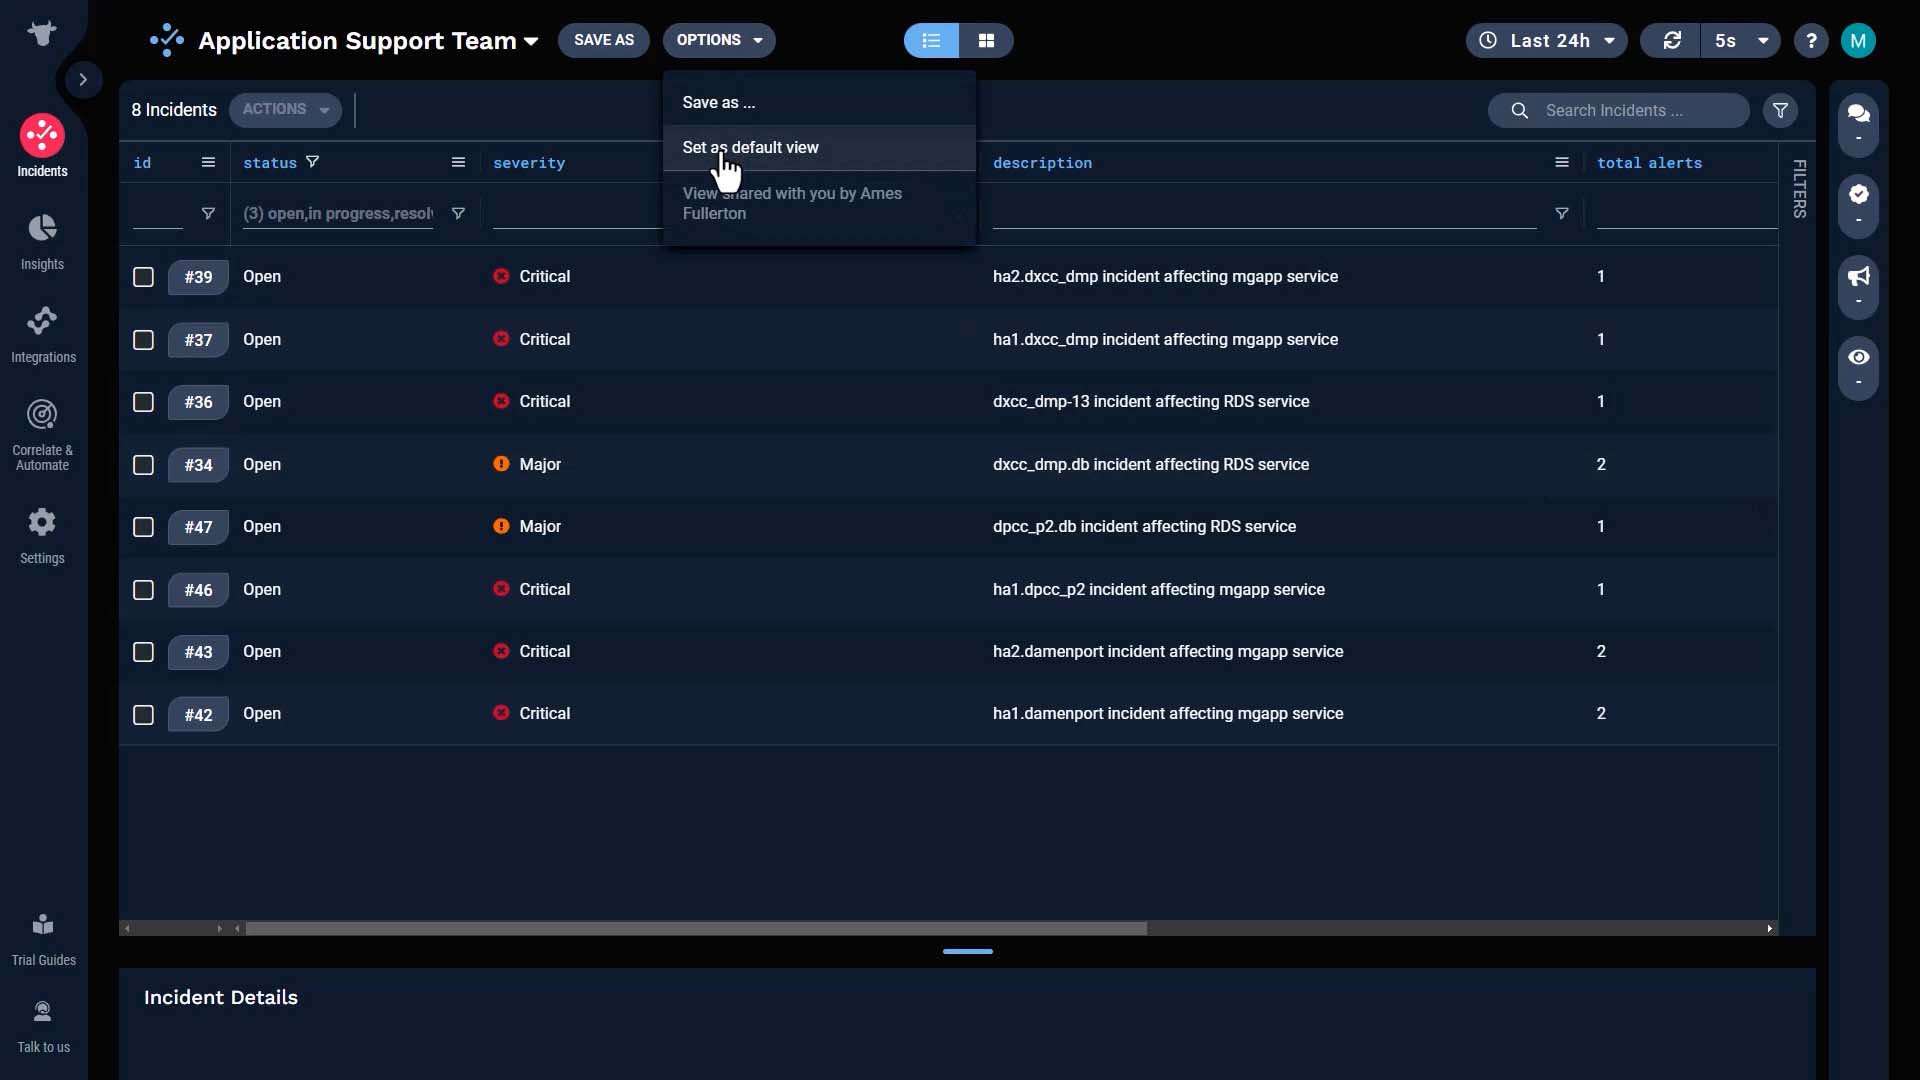
And you can make this your default view without affecting other users.
Let’s say we are going to work on this one.
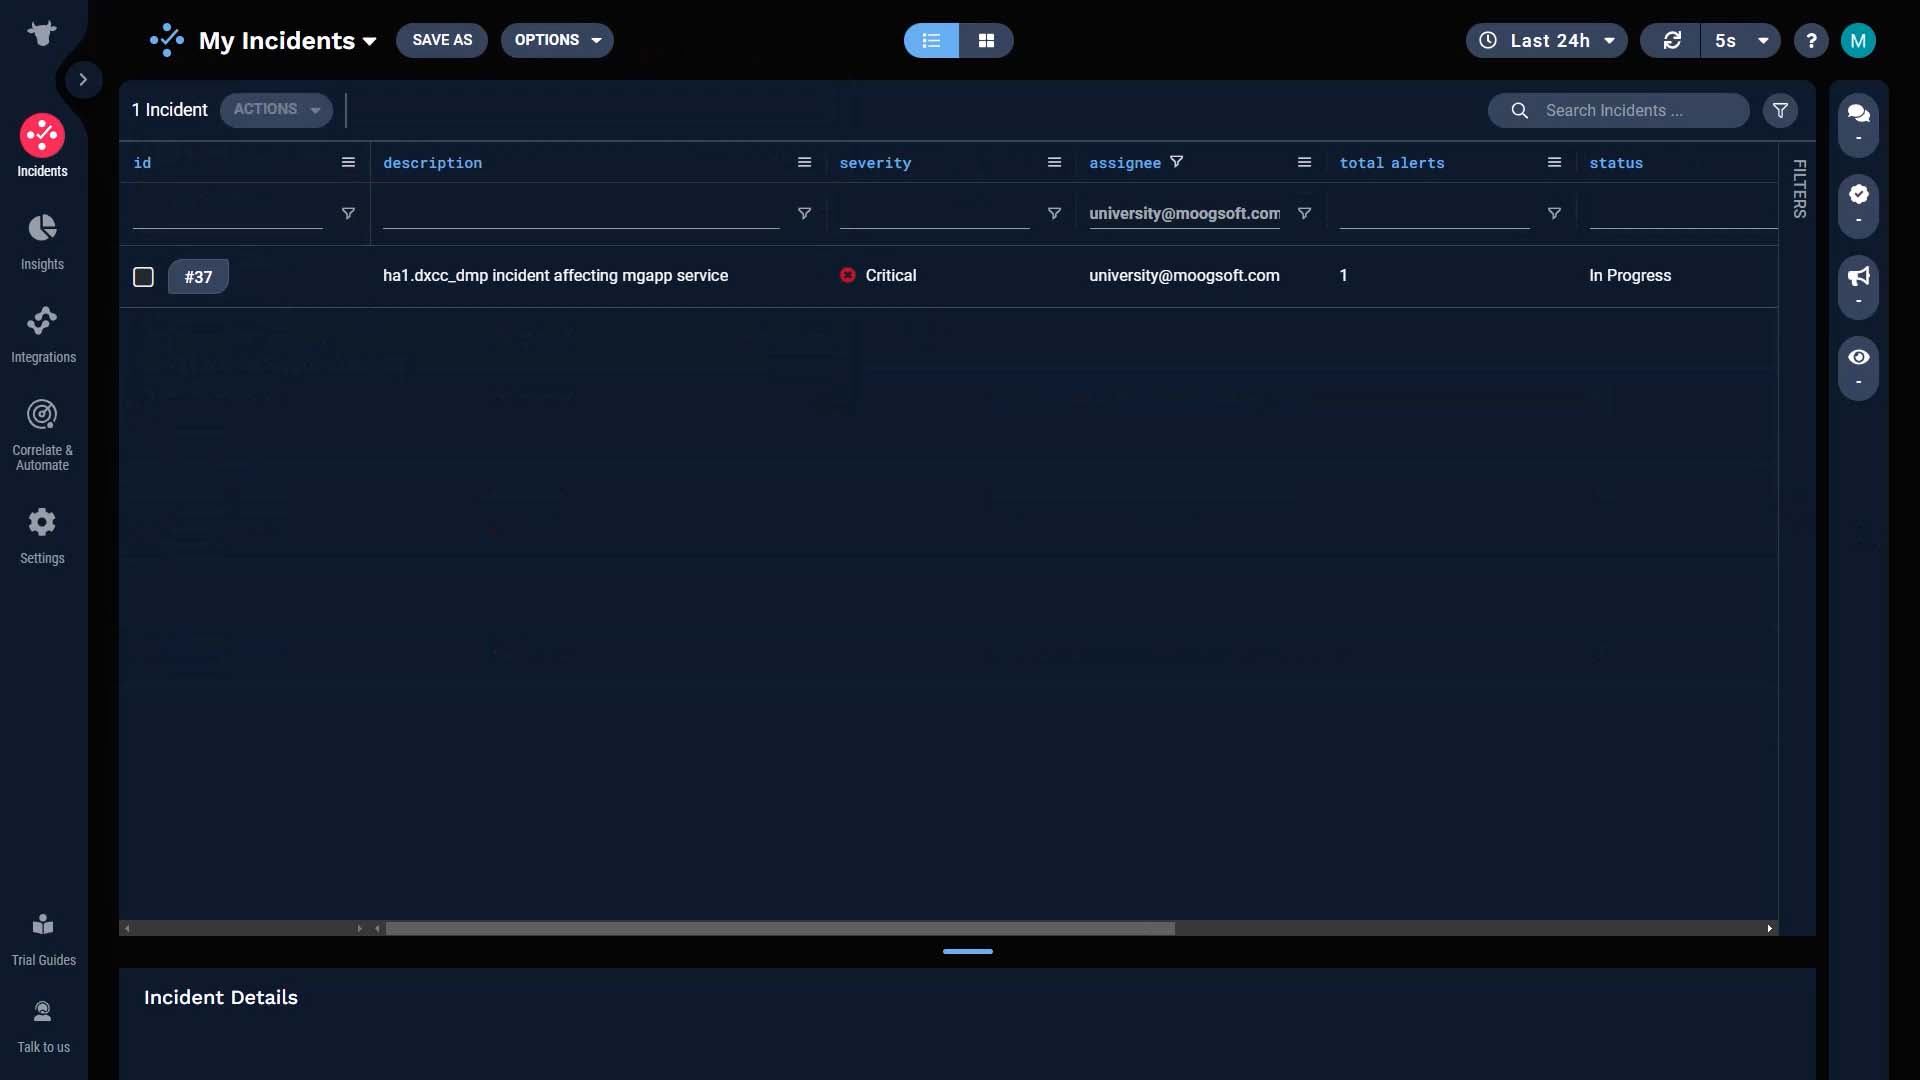
There’s a list view that only shows the incidents you are assigned to.
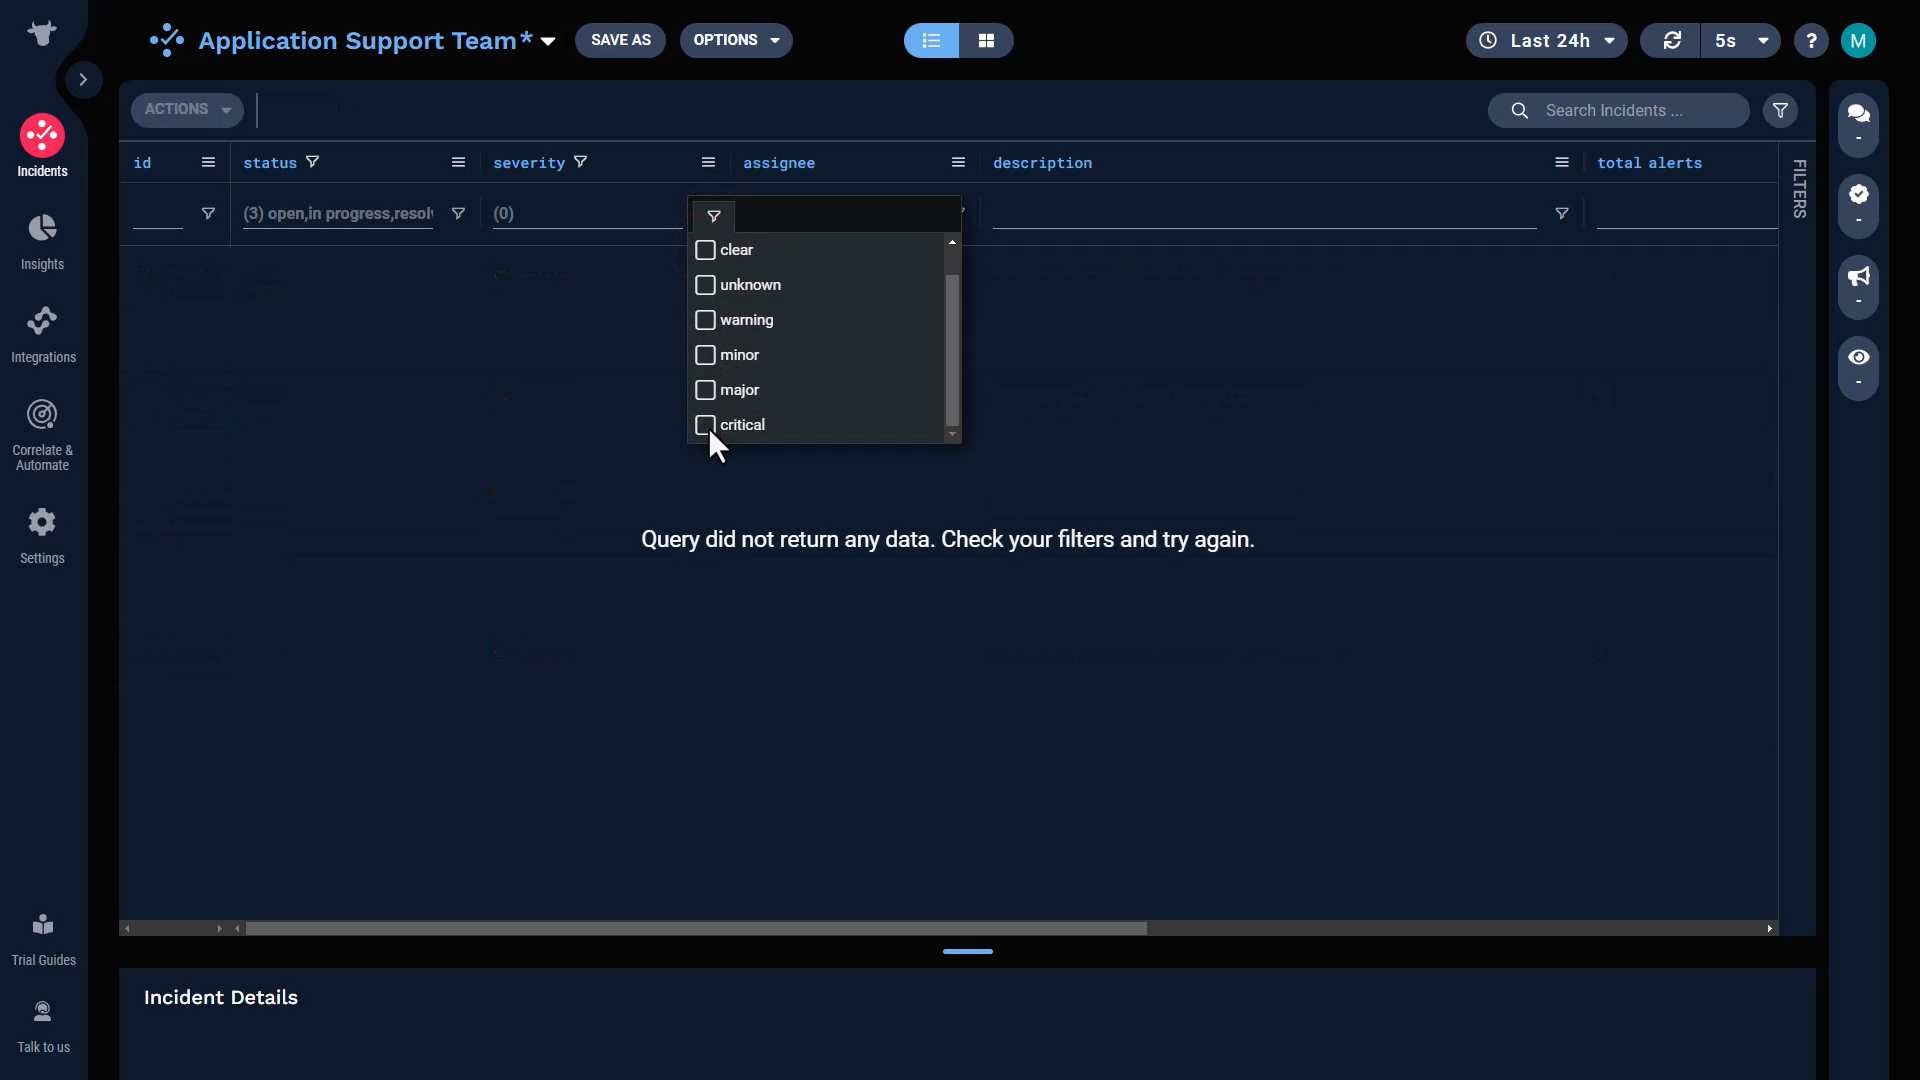
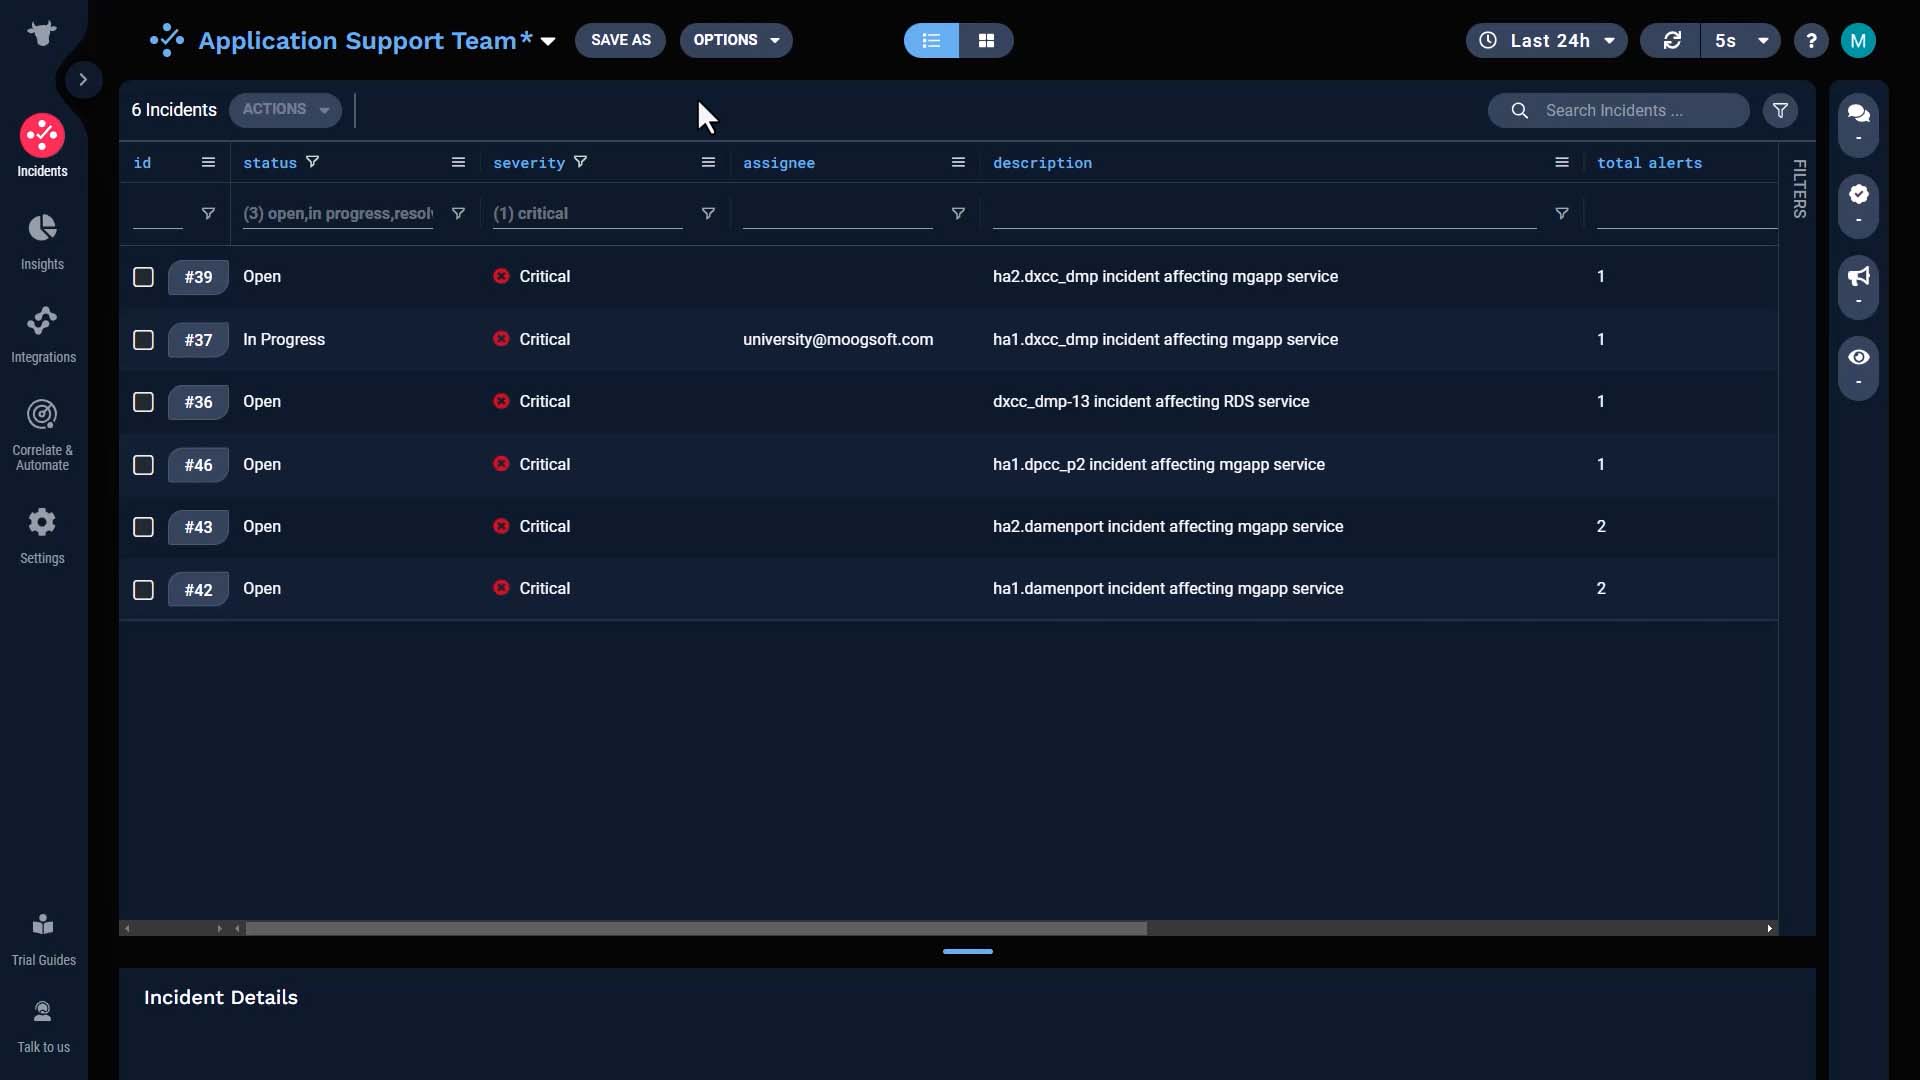
If you want to filter the list further you can do so here.
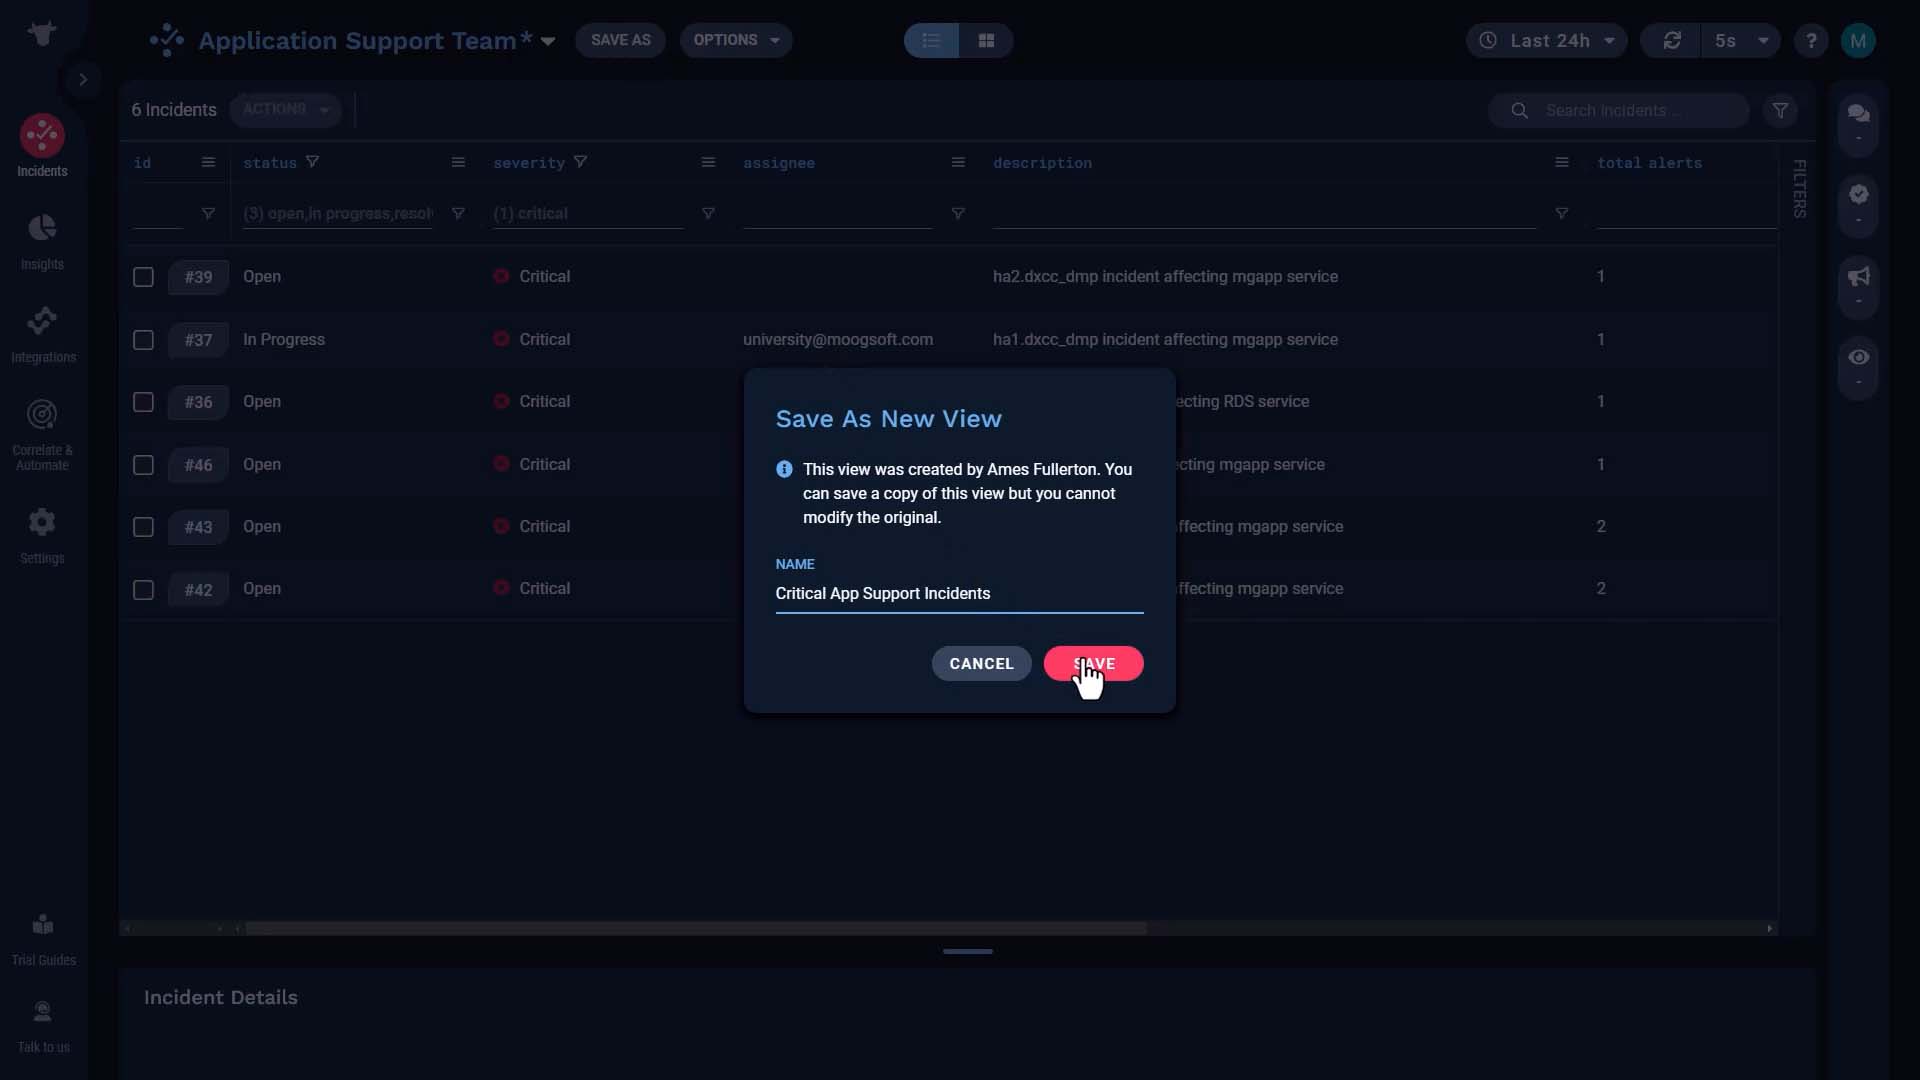
You can save the view for yourself without affecting the original view.
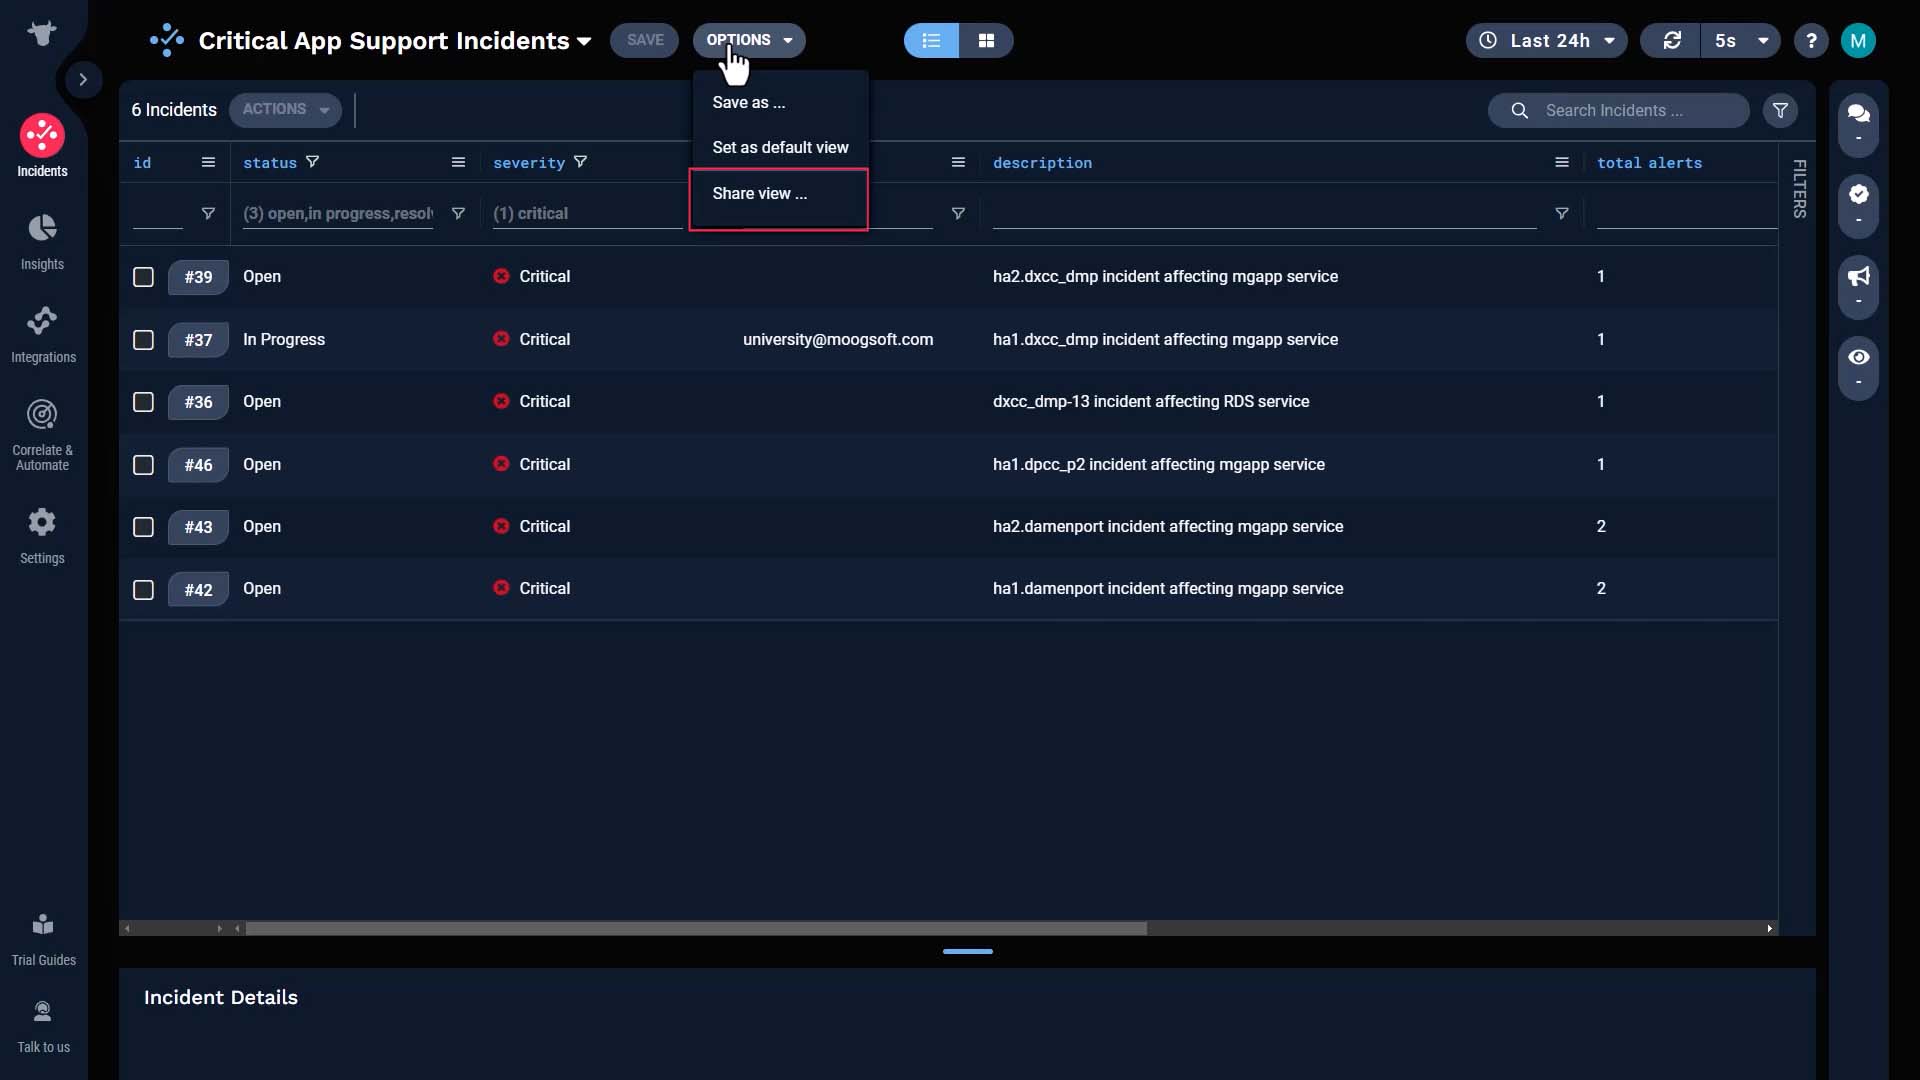
If you want to make it a shared view, you can do so here.
When you create a view, you also get a corresponding dashboard.
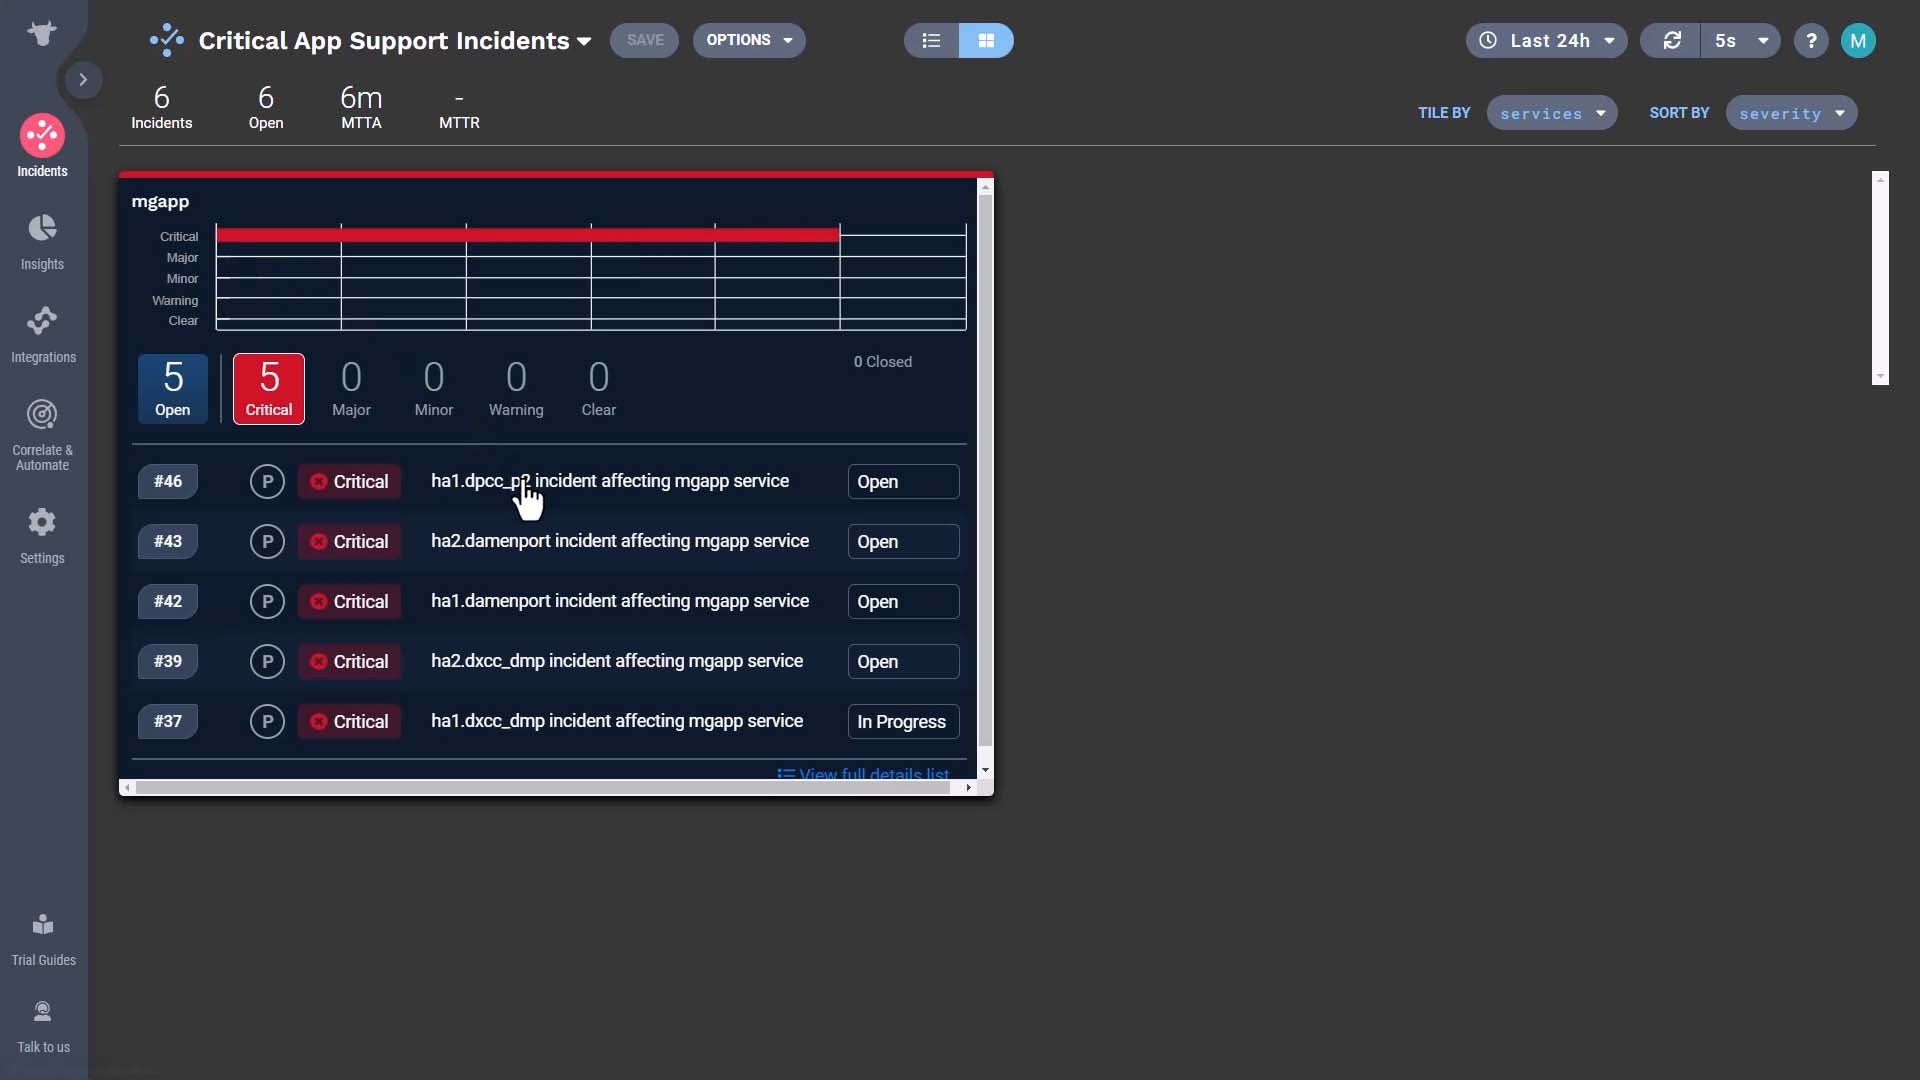
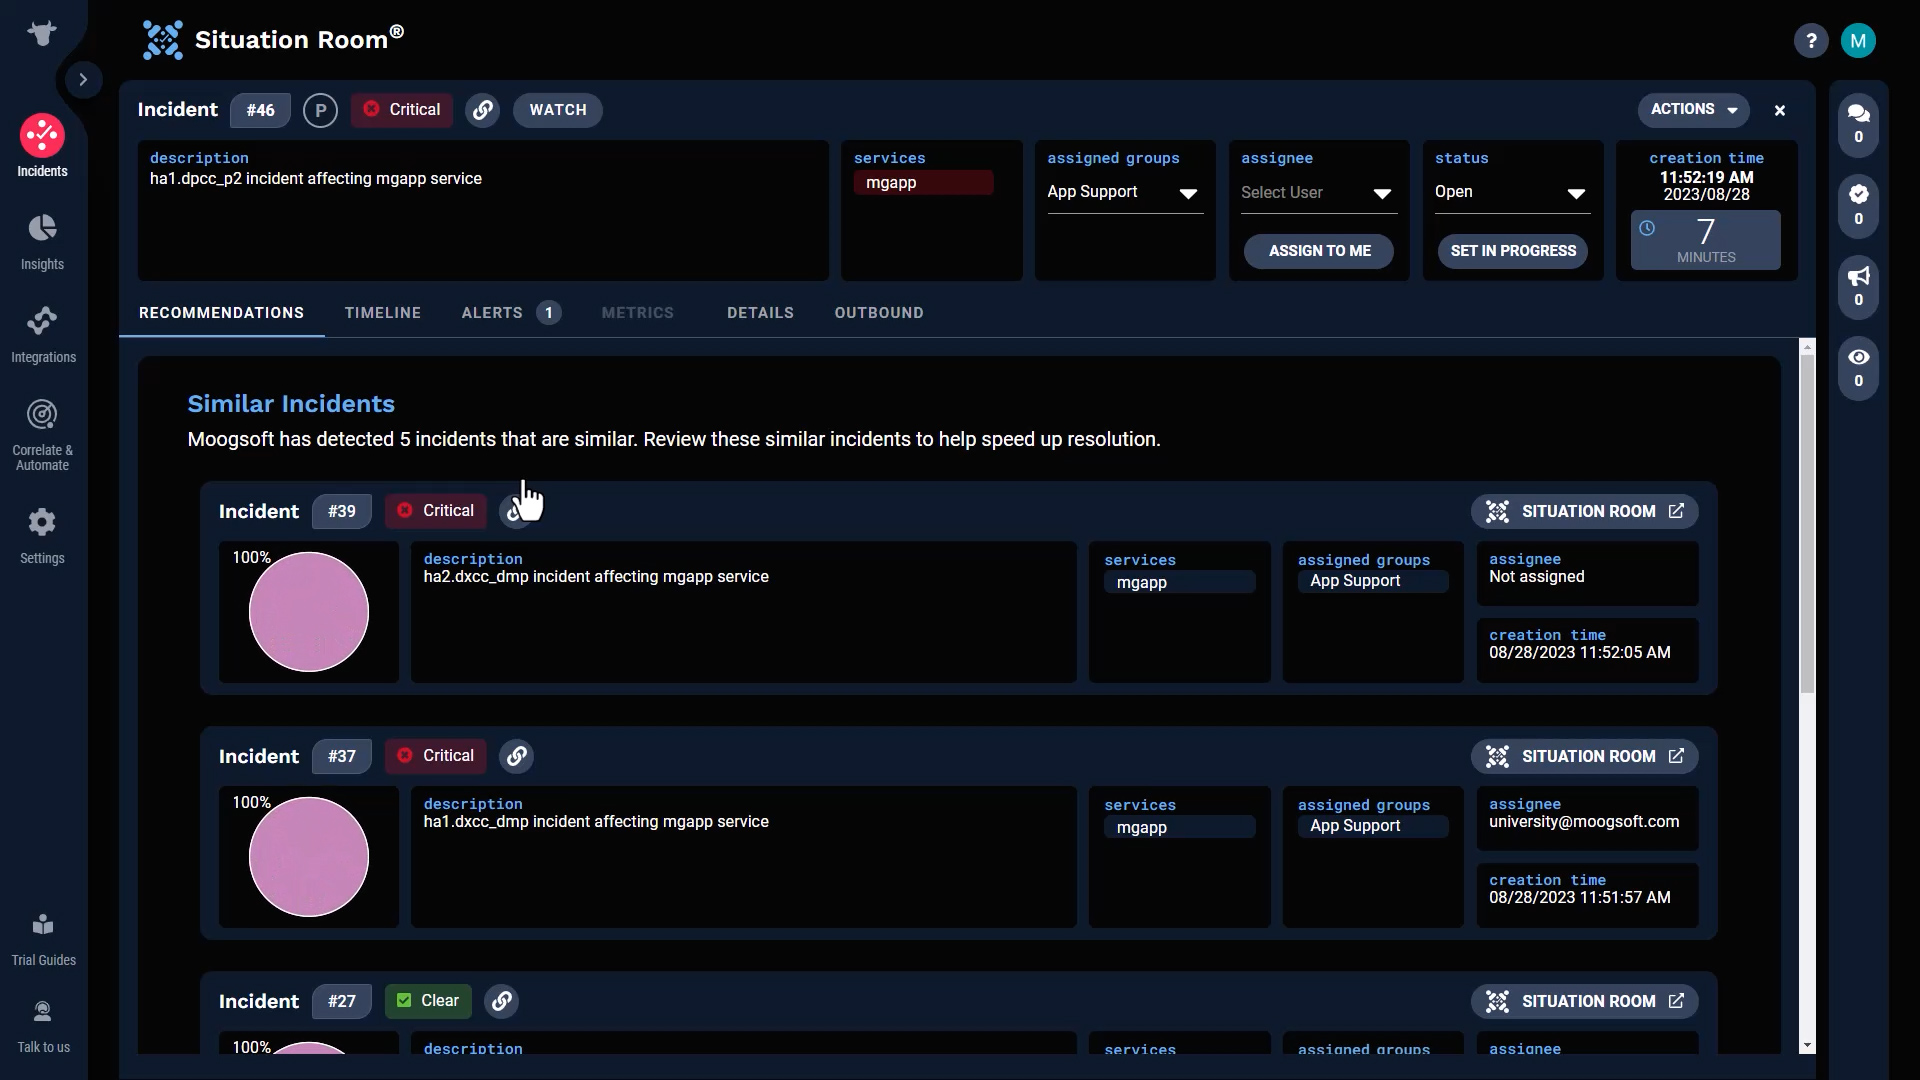
It presents data in a more visual manner, but you can also jump into a specific incident.
Now you know how to work with your incident queue. Thanks for watching!