Telegraf integration
Telegraf is a plugin-driven agent used with the InfluxData time series platform to collect, process, aggregate, and write metrics to one or more HTTP (or HTTPS) endpoints via Telegraf configuration file declarations. APEX AIOps Incident Management ingests, identifies anomalies, and visualizes Telegraf metrics. You can configure the Telegraf plugin to post data to Incident Management by modifying its configuration file and restarting the endpoint agent.
Before you begin
This integration was validated with Telegraf Version 1.19.1.
Before you start to set up your integration, make sure:
You have an active Telegraf agent on the endpoint(s) for which metrics are to be collected and sent to Incident Management. Refer to the Telegraf documentation for information about installing a Telegraf agent.
You can access and modify the Telegraf agent configuration file.
You have created an API key and have access to a copy of it.
Telegraf can make requests to external endpoints over port 443. This is the default.
Modify the Telegraf configuration file
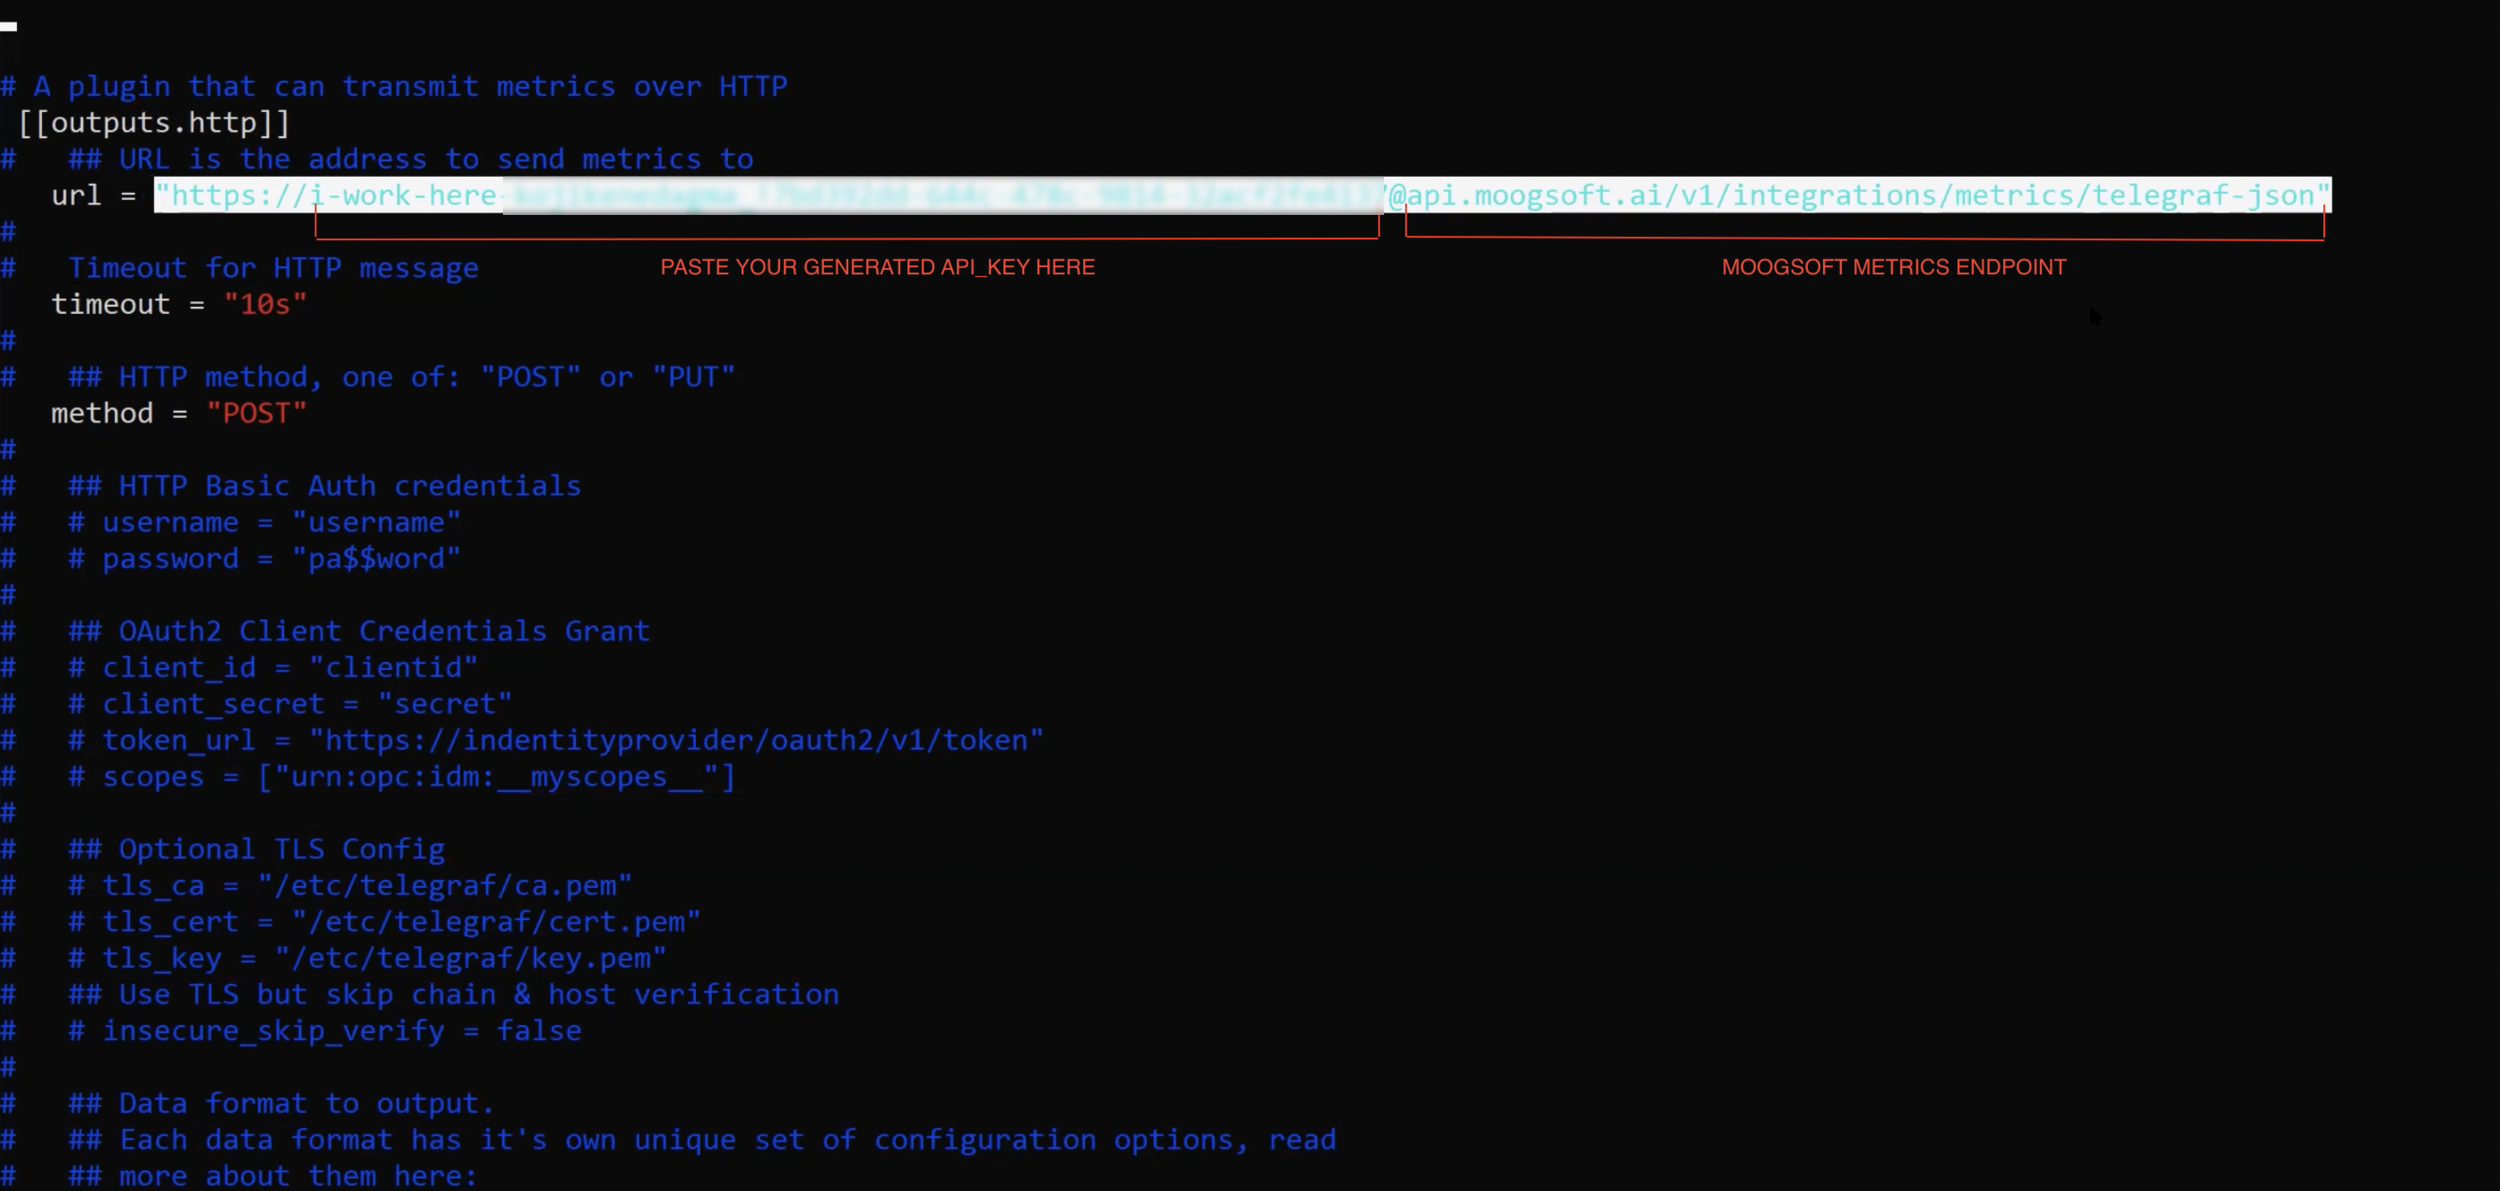
To create a new Telegraf integration, modify the Telegraf .config file HTTP block shown below as follows:
Open the configuration file for the Telegraf agent you wish to have write to Incident Management.
Locate the HTTP block in the .config file in the section [[outputs.http]].

Paste the Incident Management API_KEY and URL in the
URL=field.Example:
url = "https://IncidentManagementAPIKey@api.moogsoft.ai/v1/integrations/metrics/telegraf-json"Note
Be sure the METHOD is always set to POST in the configuration file HTTP block, and FORMAT is always set to JSON.
Save the Telegraf configuration file and restart the endpoint agent.
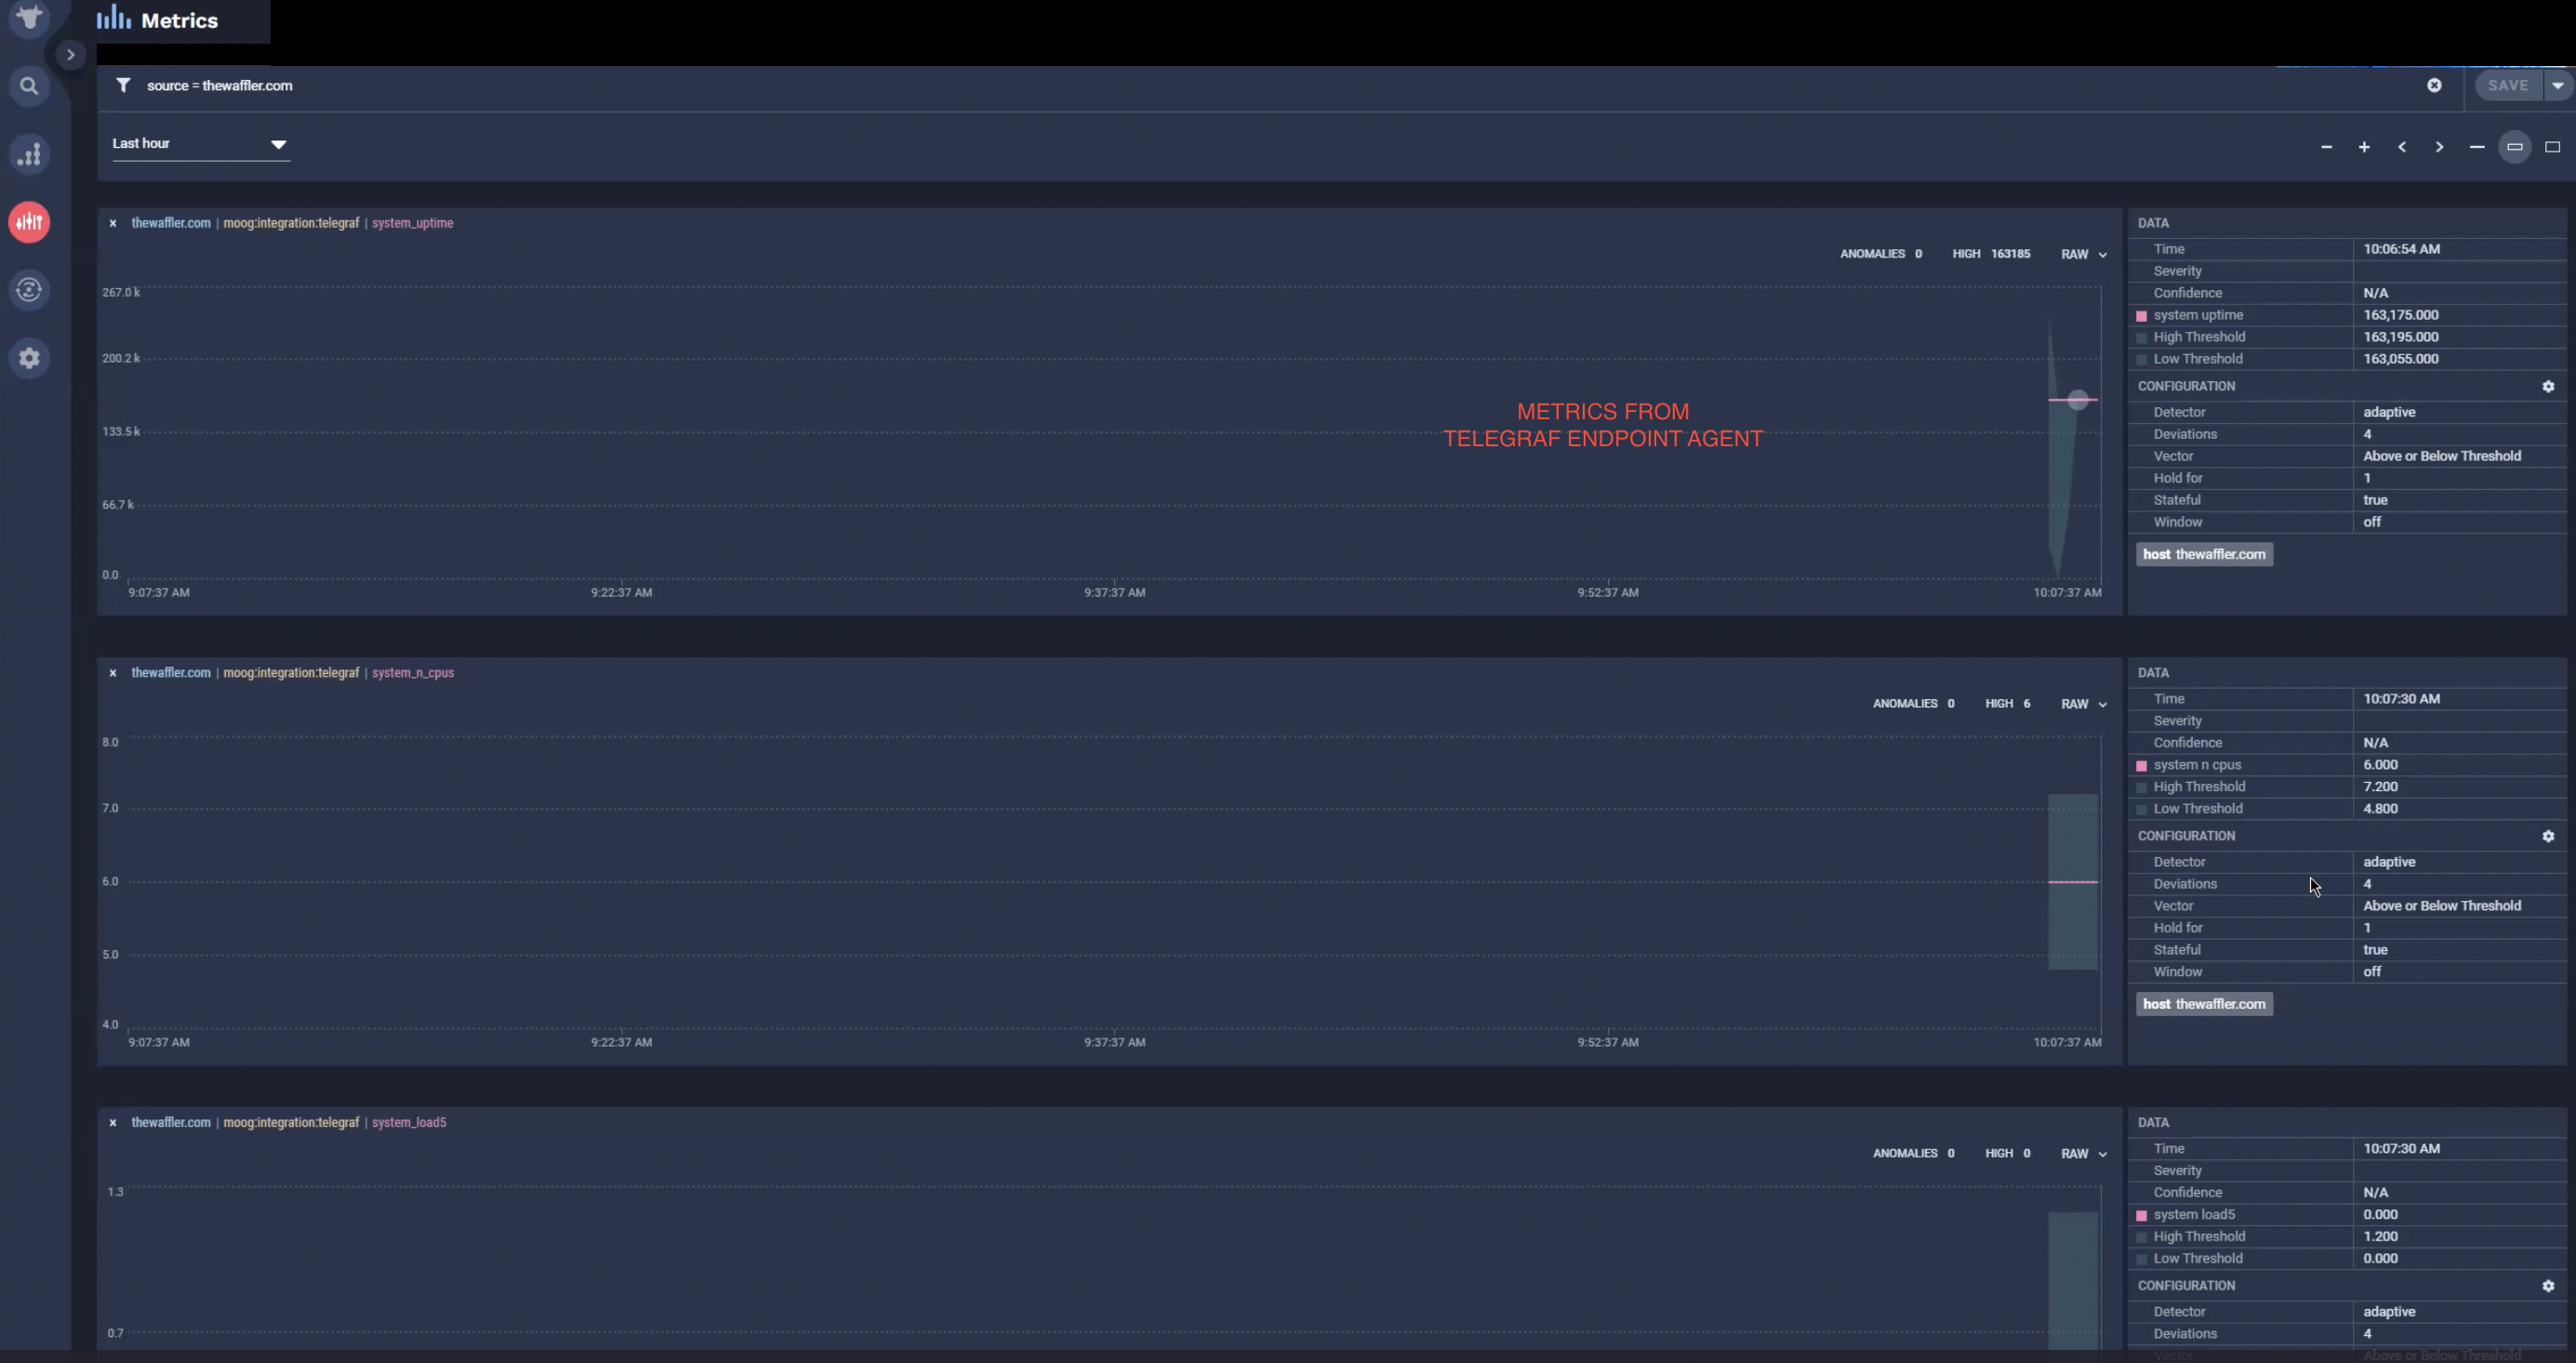
Navigate to the Incident Management Metrics tab to view Telegraf metrics and anomaly detection data.

If relevant to your organization, select the appropriate profile from the Alerting profile list. If your company has only one profile, you can leave this set to Default.