Incidents dashboard
 |
Navigate to Incidents > Incidents and then click the icon with four squares at the top center of the screen to access the incidents dashboard. You can control the incidents included in the dashboard by applying filters on the Incidents listpage and by creating and saving incident views. You can also access incident dashboards by navigating to Insights > Dashboards.
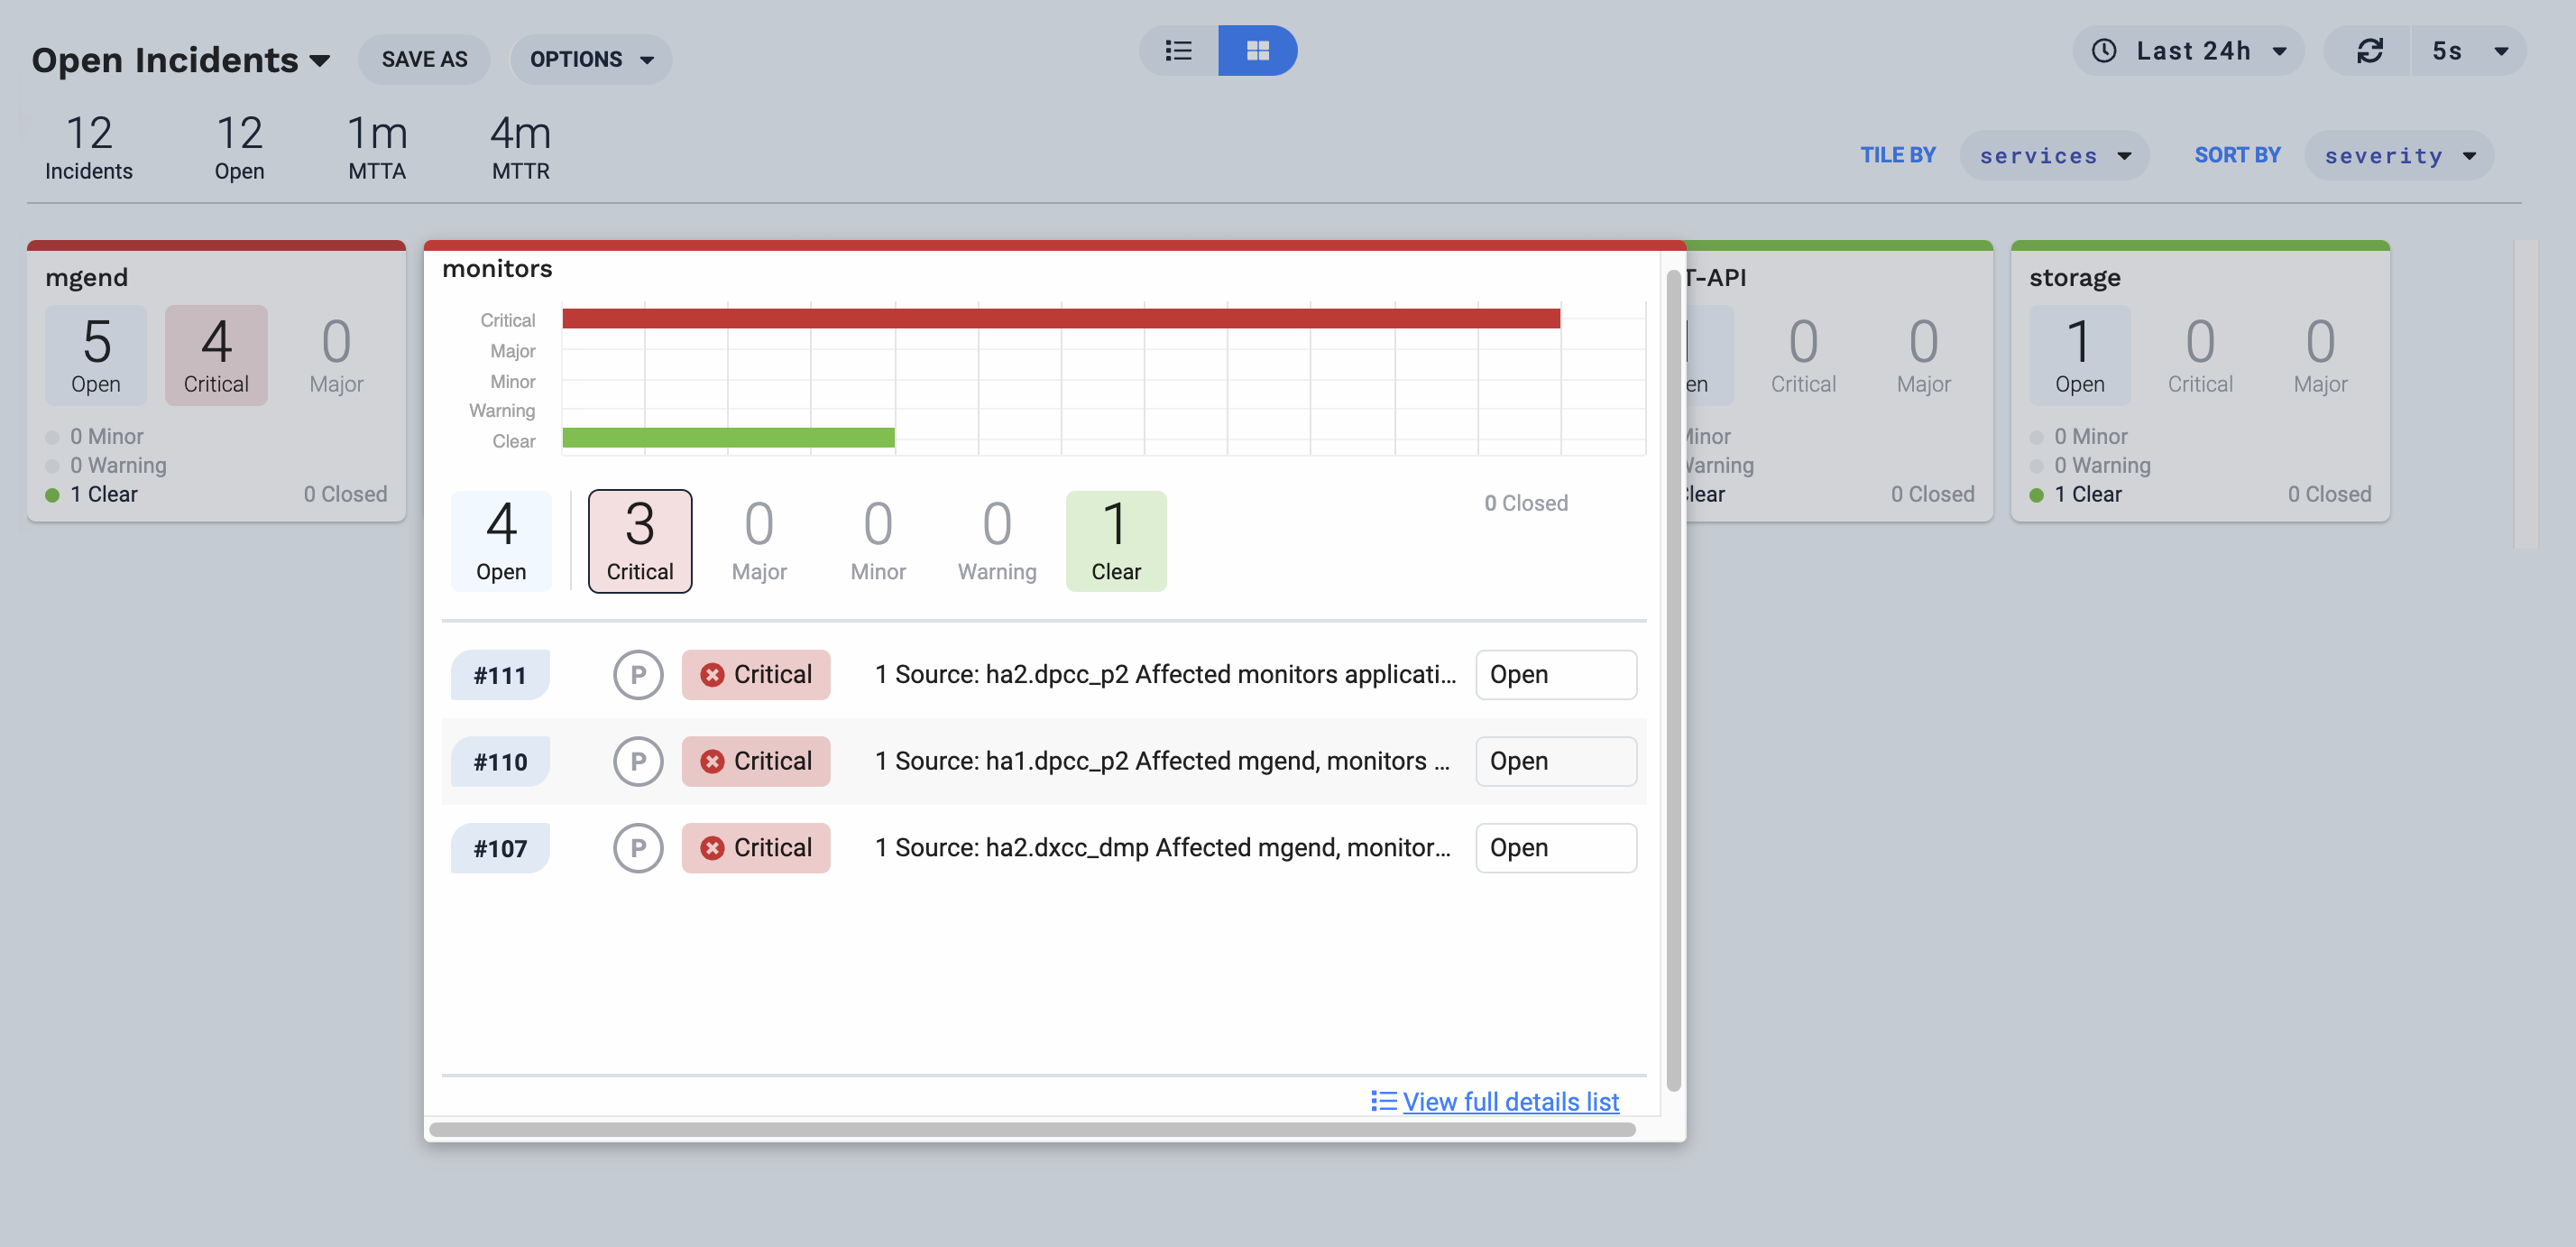
The dashboard gives you a concise overview of all the incidents in the current view aggregated into summary tiles. For example, the default view shows tiles for each impacted service with the distribution of incidents at each severity level. Click one of the tiles to see a bar graph and a list of member incidents. Click a row in that list to go to the Situation Room for the incident.
Explore the incidents dashboard UI
The following tables describe controls that are specifically relevant to the incidents dashboard. See Incidents list for descriptions of the controls in the top row of the incidents dashboard page.
These controls appear in the second row of the incidents dashboard page from left to right:
UI element | Description |
|---|---|
Performance statistics | Displays the number of open and total incidents, the Mean Time to Acknowledge (MTTA), and the Mean Time to Resolve (MTTR) for incidents included in the view. |
Tile aggregation selector | Choose whether to display summary tiles based on services, classes, types, or custom tags. |
Tile sorting selector | Choose whether to display incident counts, graphs, and lists for each tile by severity or by priority. |
These controls appear in the body of the incidents dashboard page:
UI element | Description |
|---|---|
Summary tile | Displays a breakdown of incidents by the selected criteria. |
Tile summary bar graph | Click a tile to view the distribution of incidents by severity or priority for the given tile. |
Tile incident list | Click a tile to view a list of incidents that meet the tile criteria, and click an incident row to go to the Situation Room for that incident. |
Supported actions
The following table describes actions you can take involving the incidents dashboard page. Note that if you are accessing dashboards from Insights > Incident Dashboards, you will not be able to modify dashboard contents directly as described below, except by selecting different incident views.
What you can do | How to do it |
|---|---|
Change the scope of the incidents summarized in the dashboard pane by selecting a different incident view | Click the incident view name in the upper left corner and choose from the available views. |
Manage incident views | |
Display summary tiles of incidents by class, service, type, or any tags you have defined | Click the Tile By list and select the attribute you want to use for summarizing incidents. |
Display incident counts by priority or severity for each tile | Click the Sort By menu and select severity or priority. |
Change the time period for incidents included in the dashboard tiles | Click the time period selector in the upper right and choose a time period (for example, last 8 hours or last 30 days). |
Display a graph of incident counts by severity or by priority for each tile | Click a tile to display a bar graph and list of incidents. |
Examine a list of incidents for each summary tile | Click a tile to display a bar graph and list of incidents. |
Navigate to an incident's Situation Room | Click a tile to display a list of incidents, and click an incident to go to its Situation Room. See Situation Room overviewfor more information. |
Set the refresh frequency for the incident dashboard | Click the menu in the upper right and select a refresh frequency (for example, 5 seconds or 1 minute). |
Access context-sensitive help | Click the question mark in the upper right. |