Use case walkthrough: Dashboards in APEX AIOps Incident Management ►
This video provides a use case walkthrough for using dashboards to easily view the performance of your teams and services in APEX AIOps Incident Management.
*Please note Moogsoft is now part of Dell's IT Operations solution called APEX AIOps, and changed its name to APEX AIOps Incident Management. The UI in this video may differ slightly but the content covered is still relevant.
You can now create dashboards to view the team’s performance at a glance.
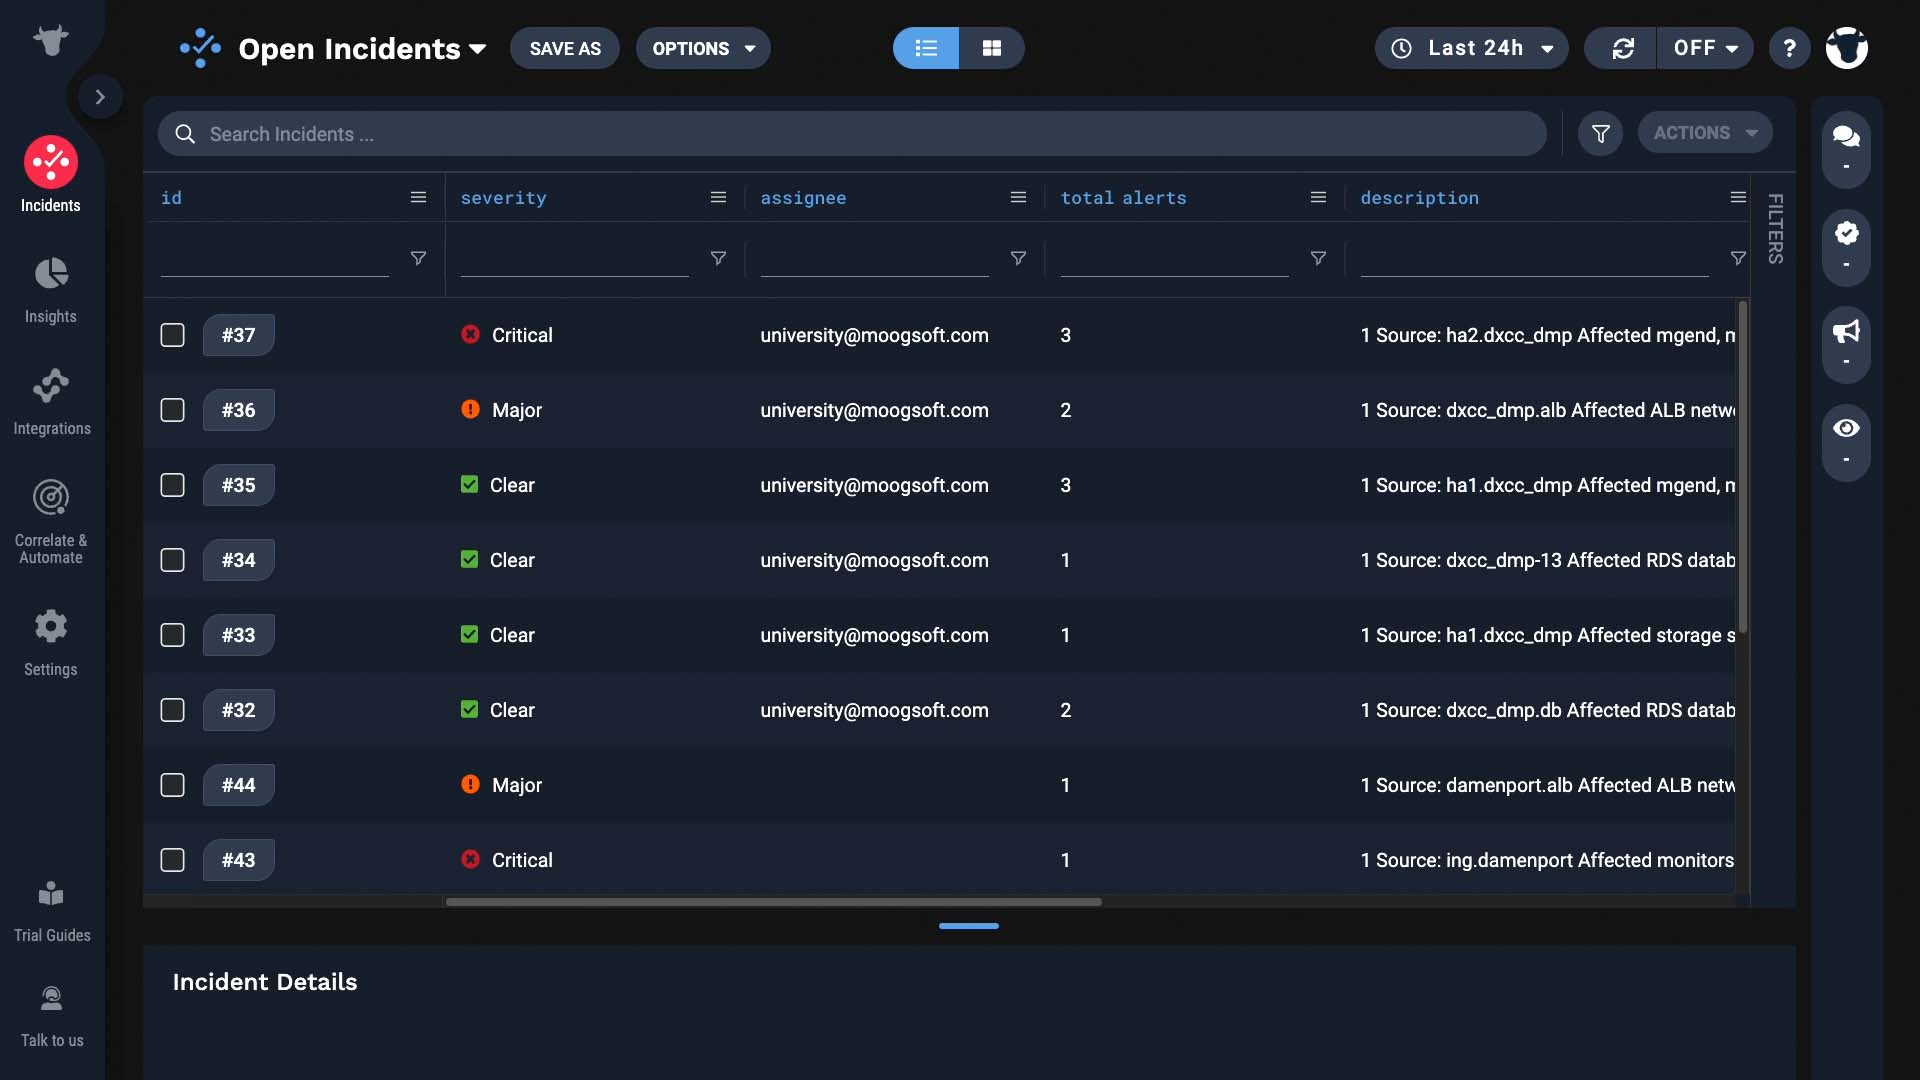
The incident list is useful for operations staff.
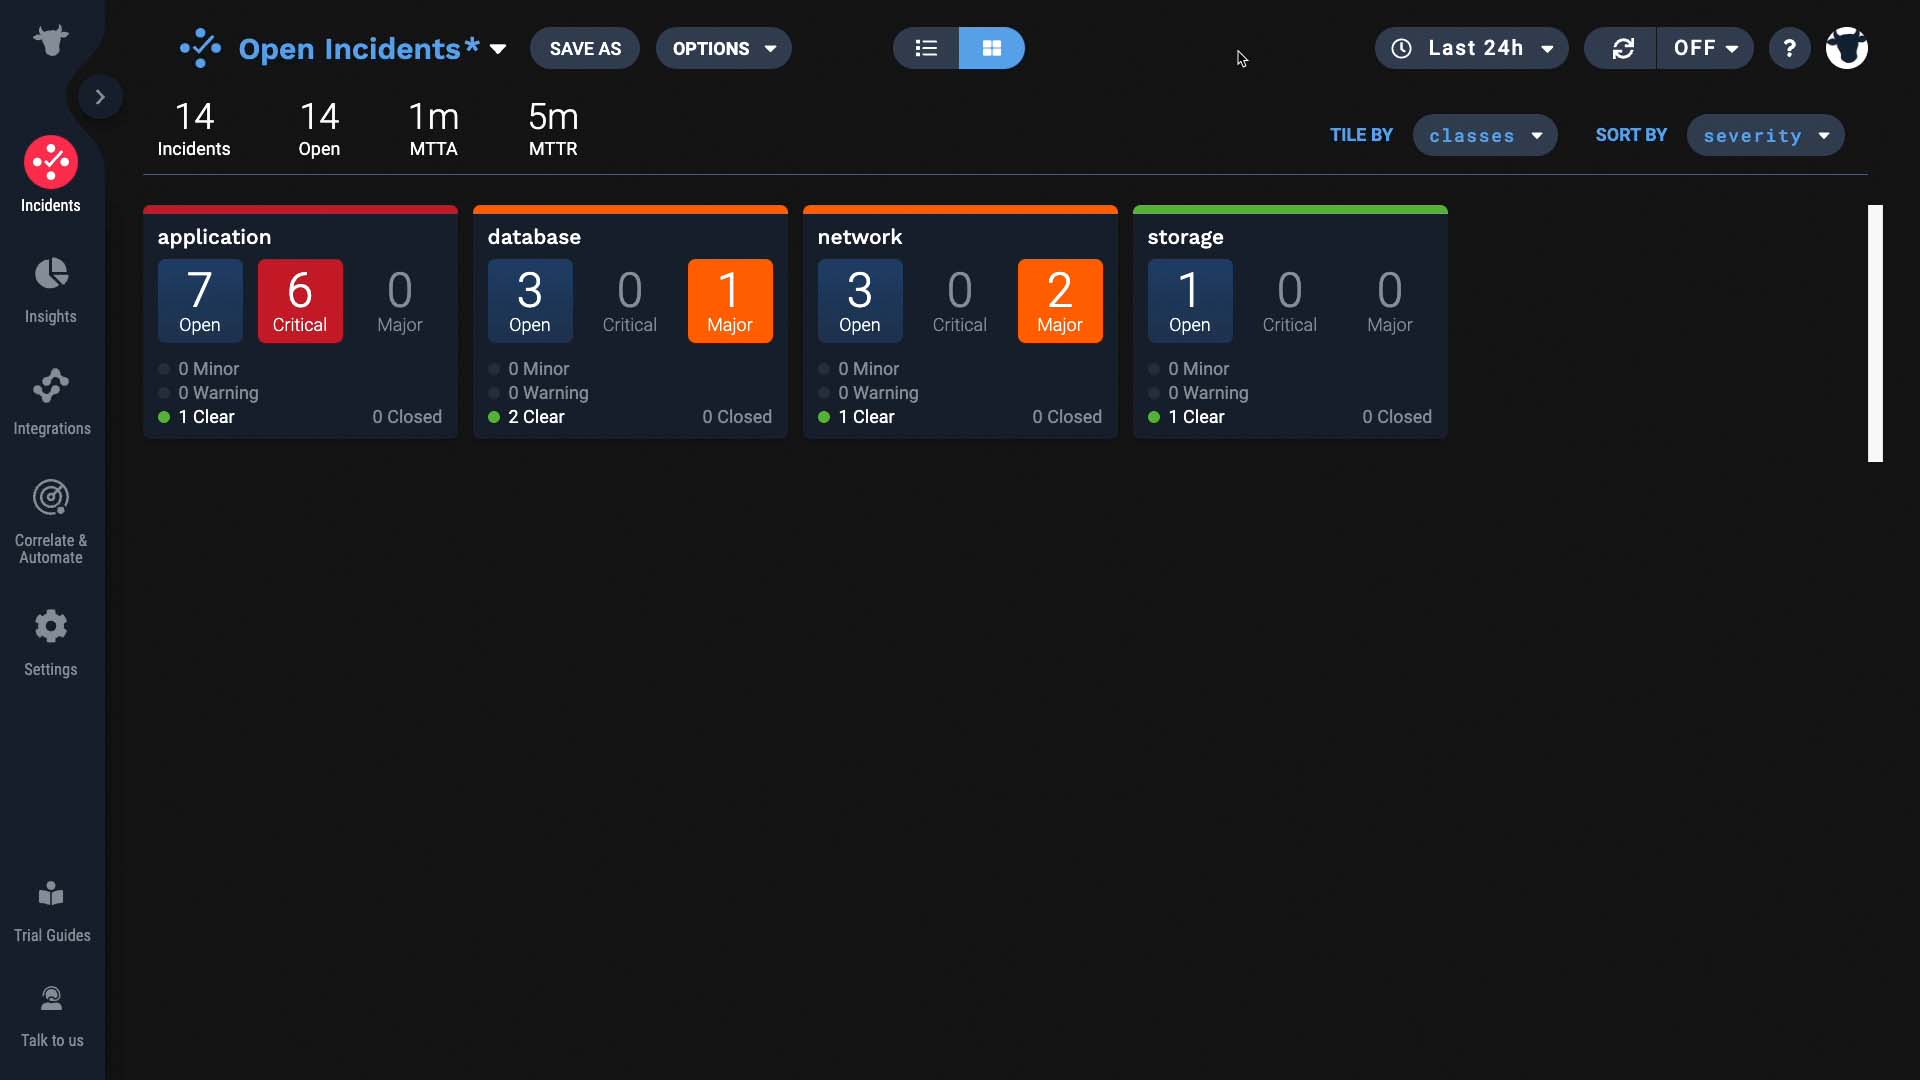
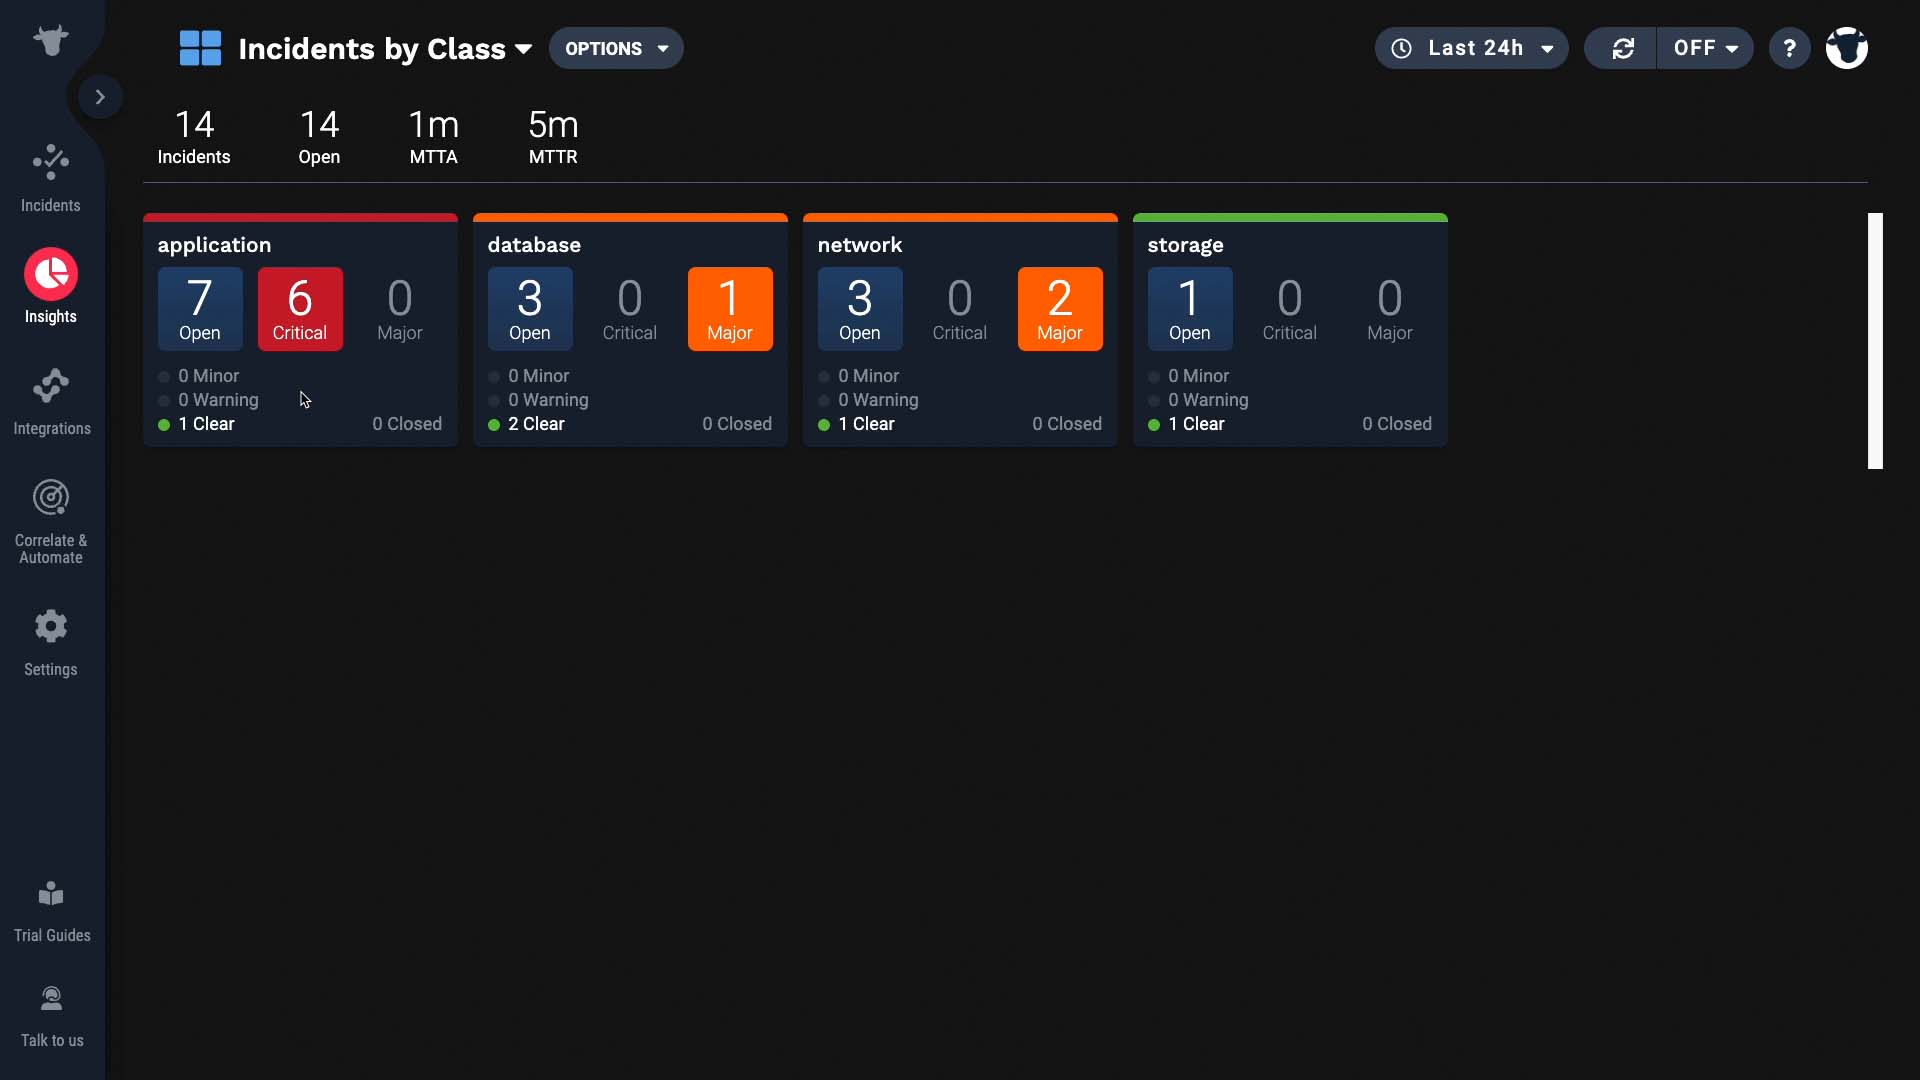
But as a manager you may need something to show how your teams or services are doing at a glance. The dashboard views are perfect for that. Here are the overall stats.
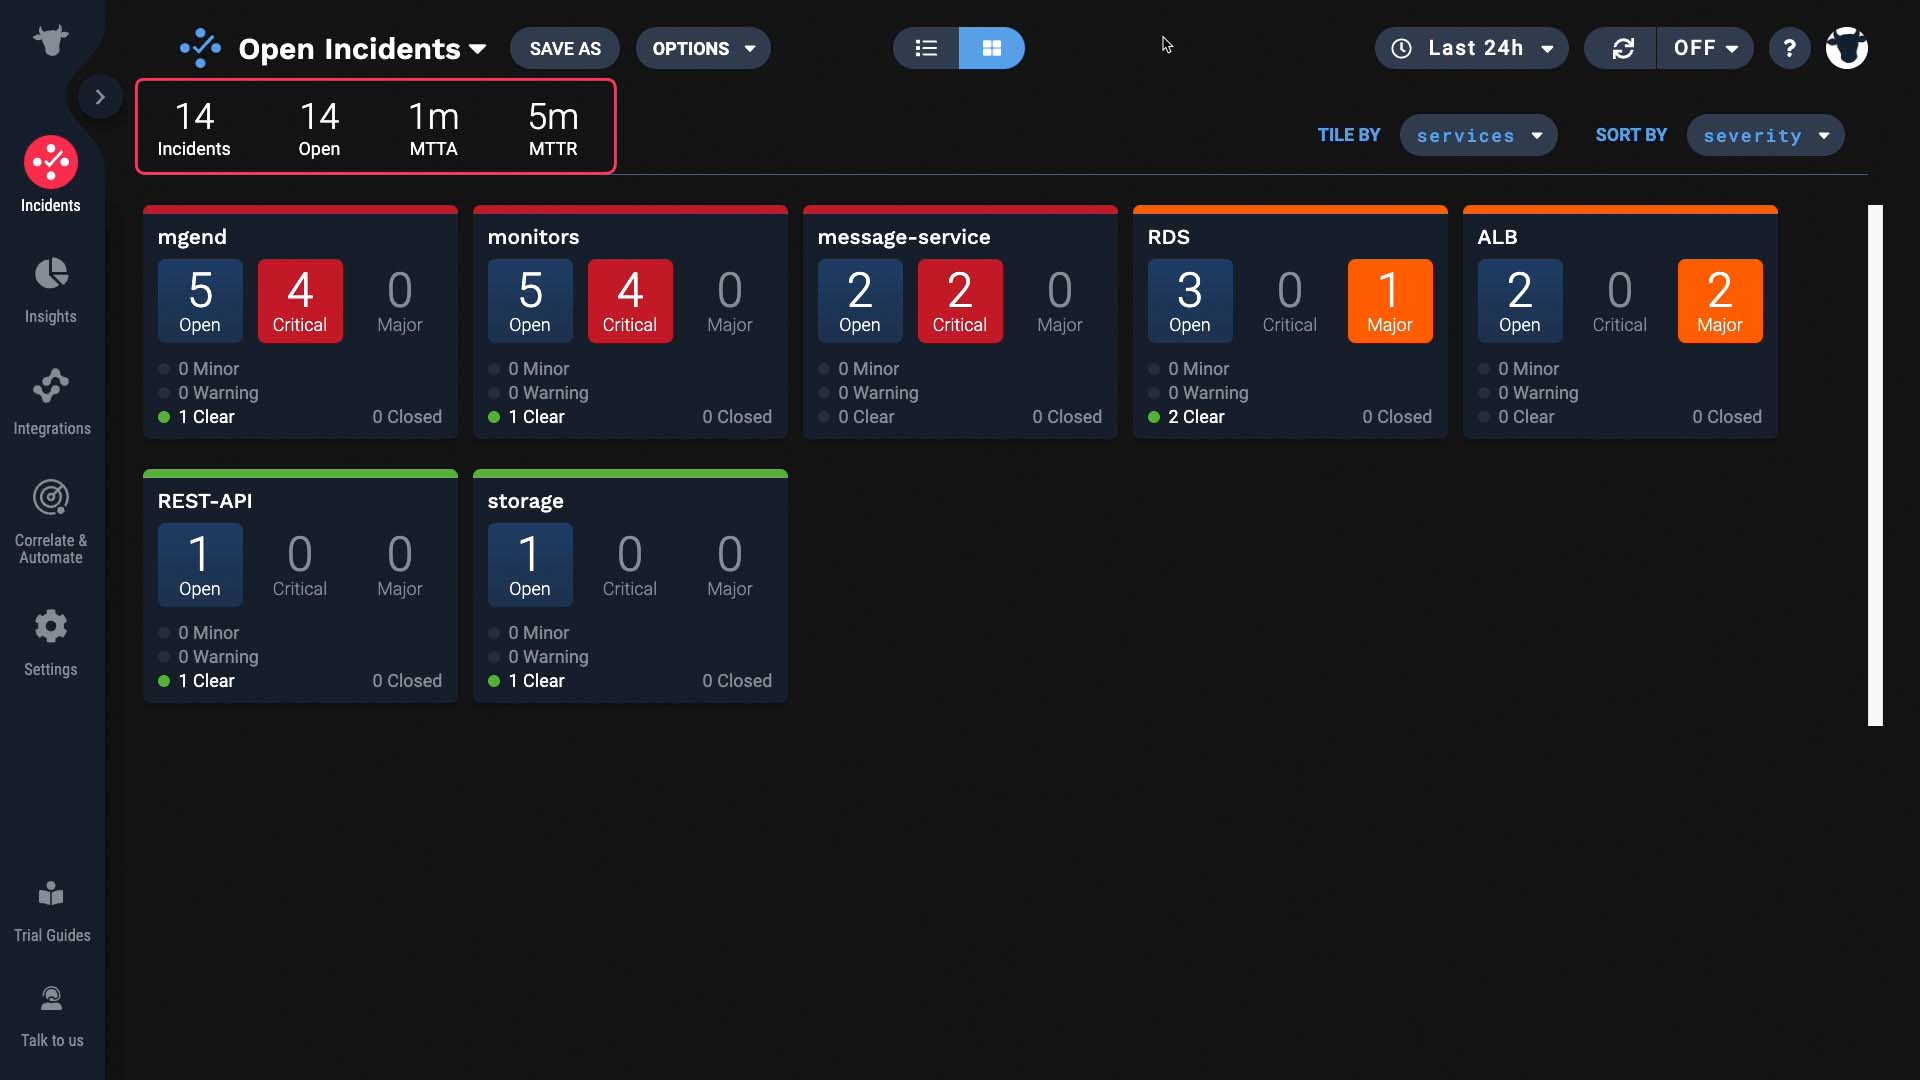
Right now it’s tiled by service, but now it’s categorized by type.
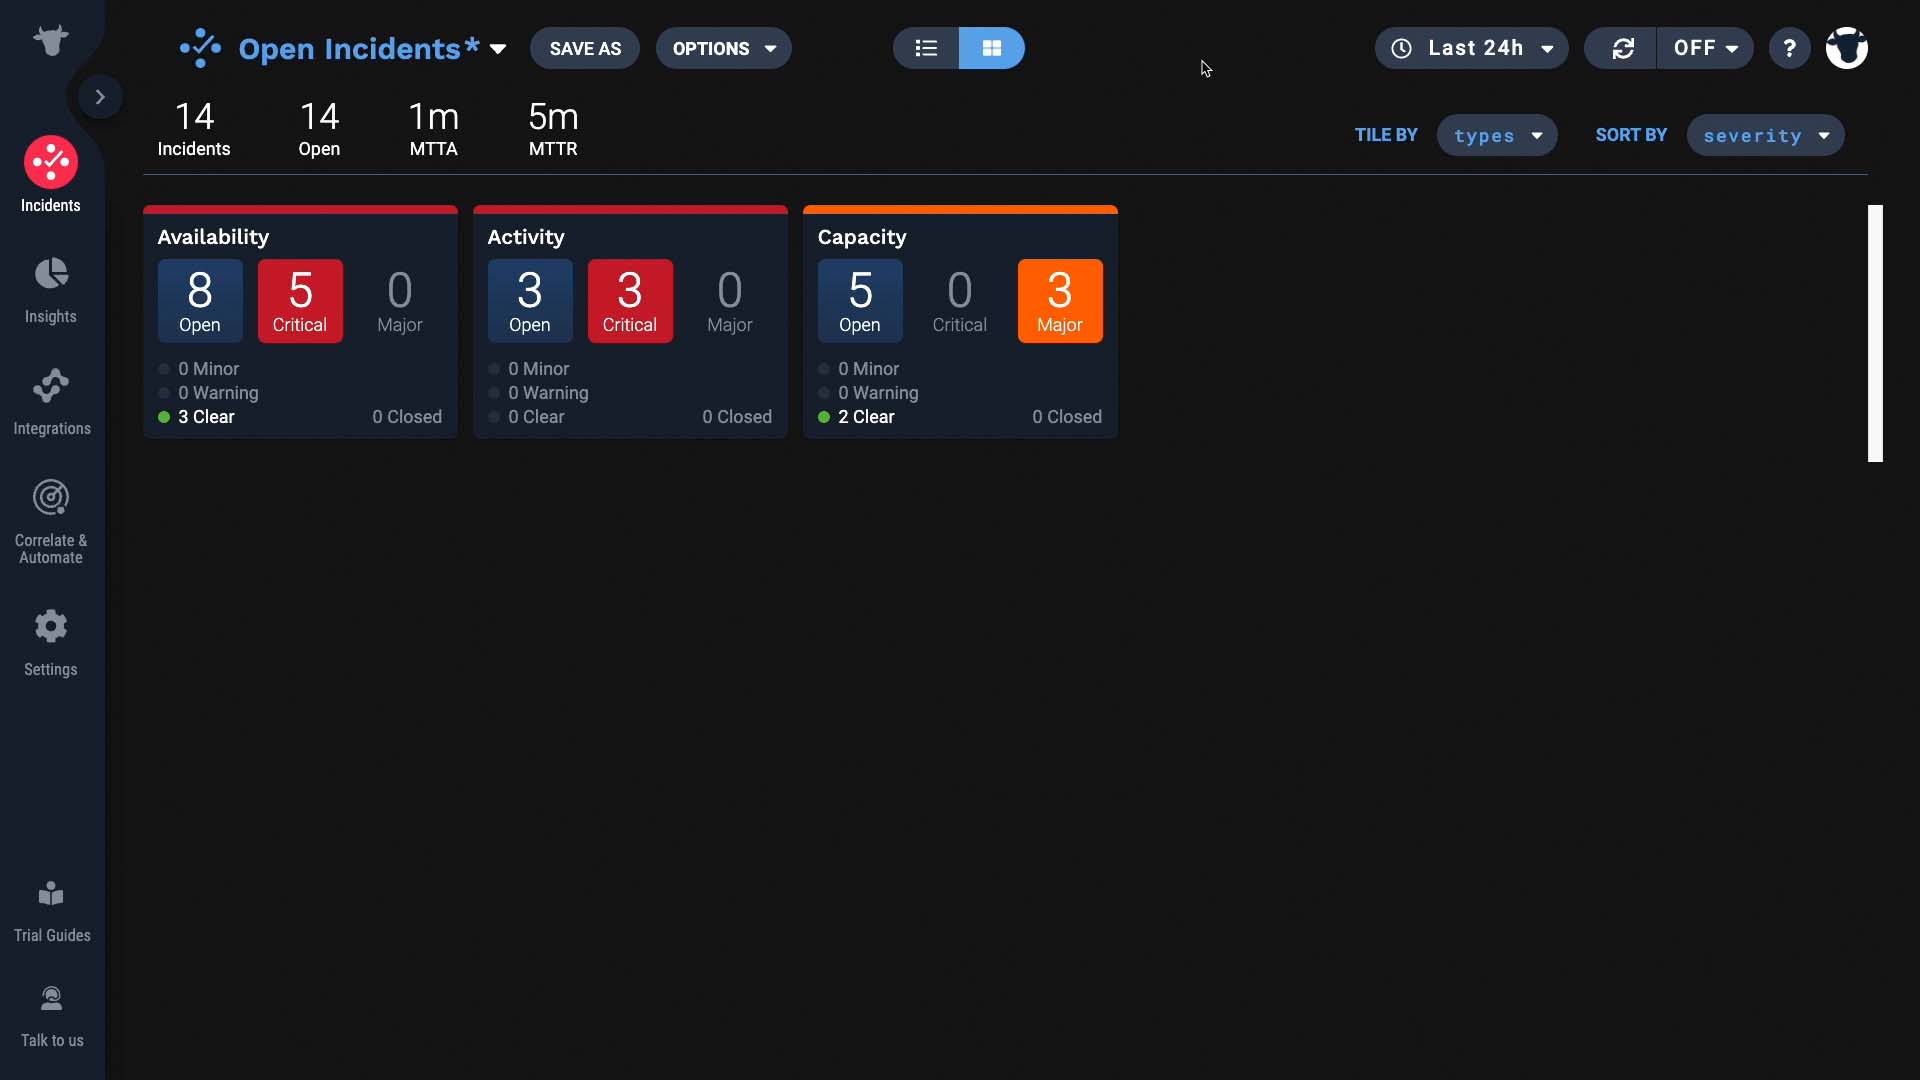
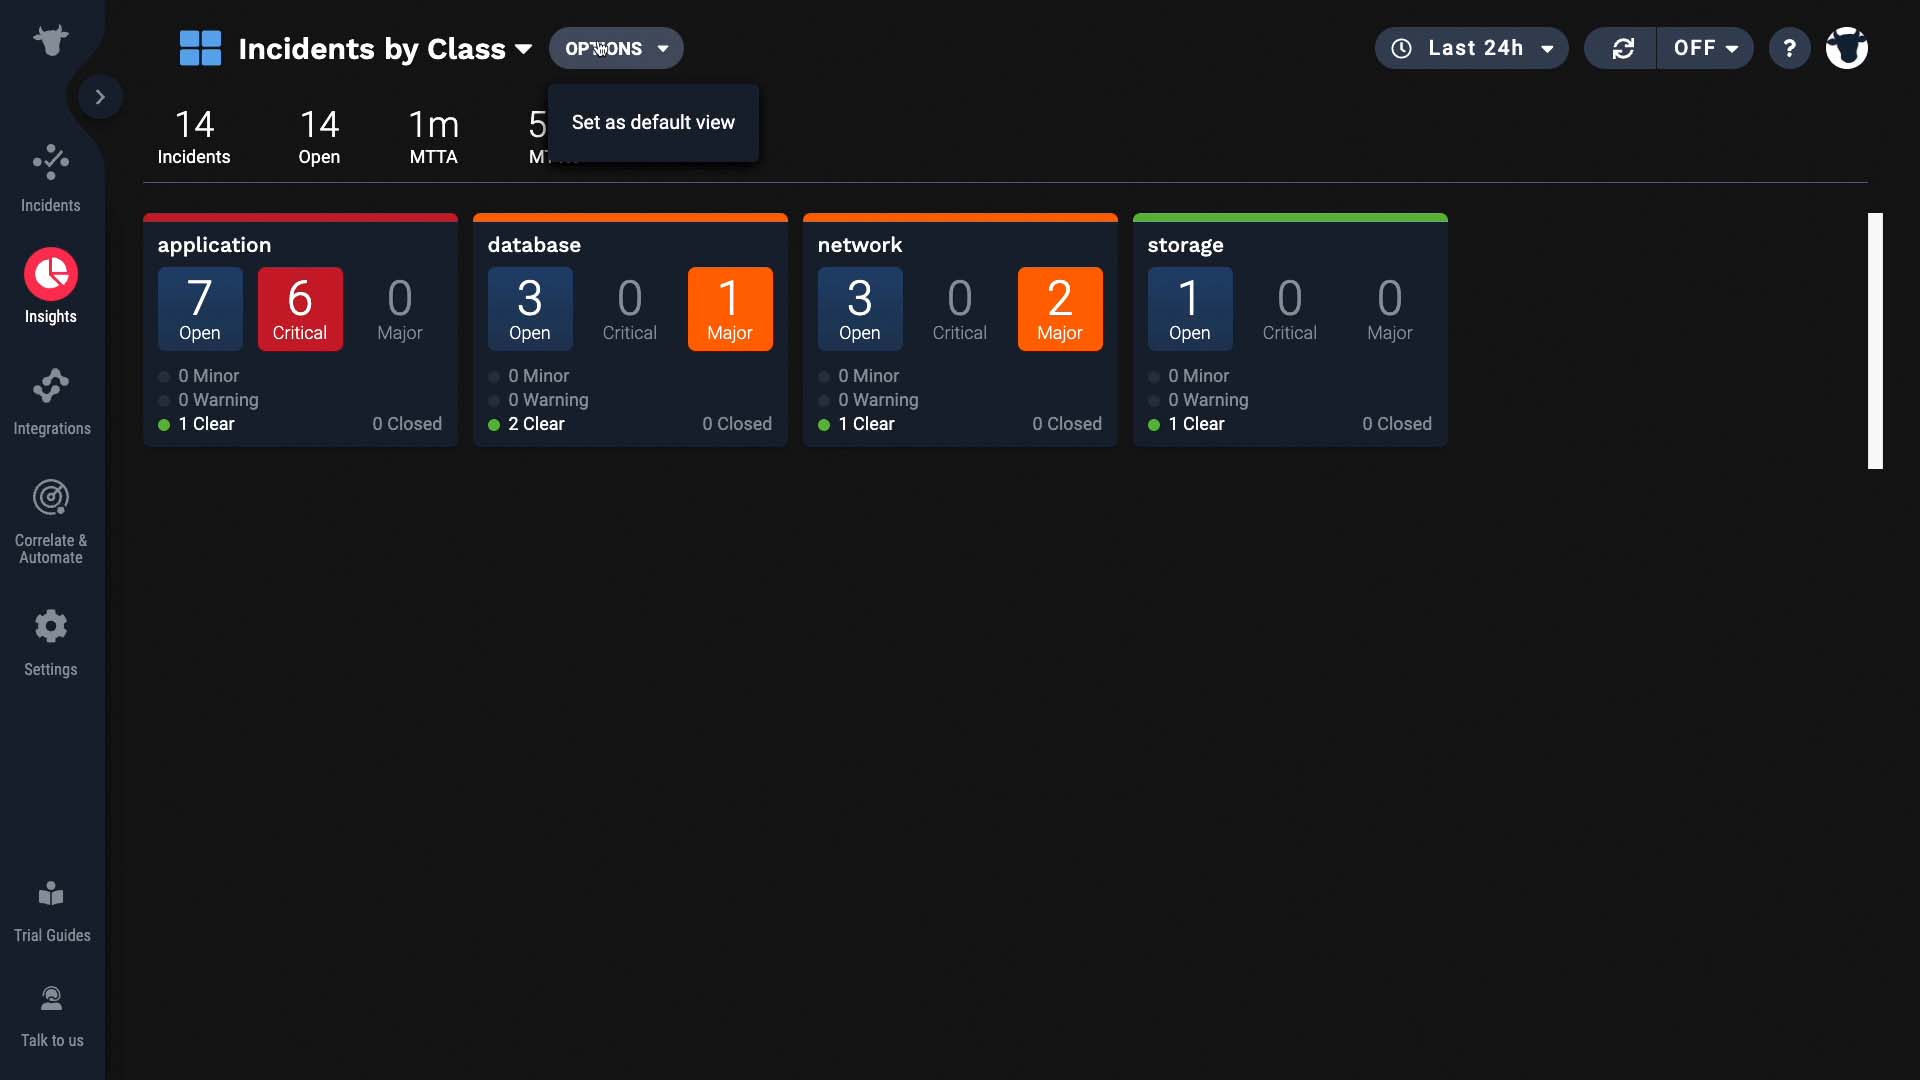
Or classes. You can slice and dice the overall category to suit your needs.
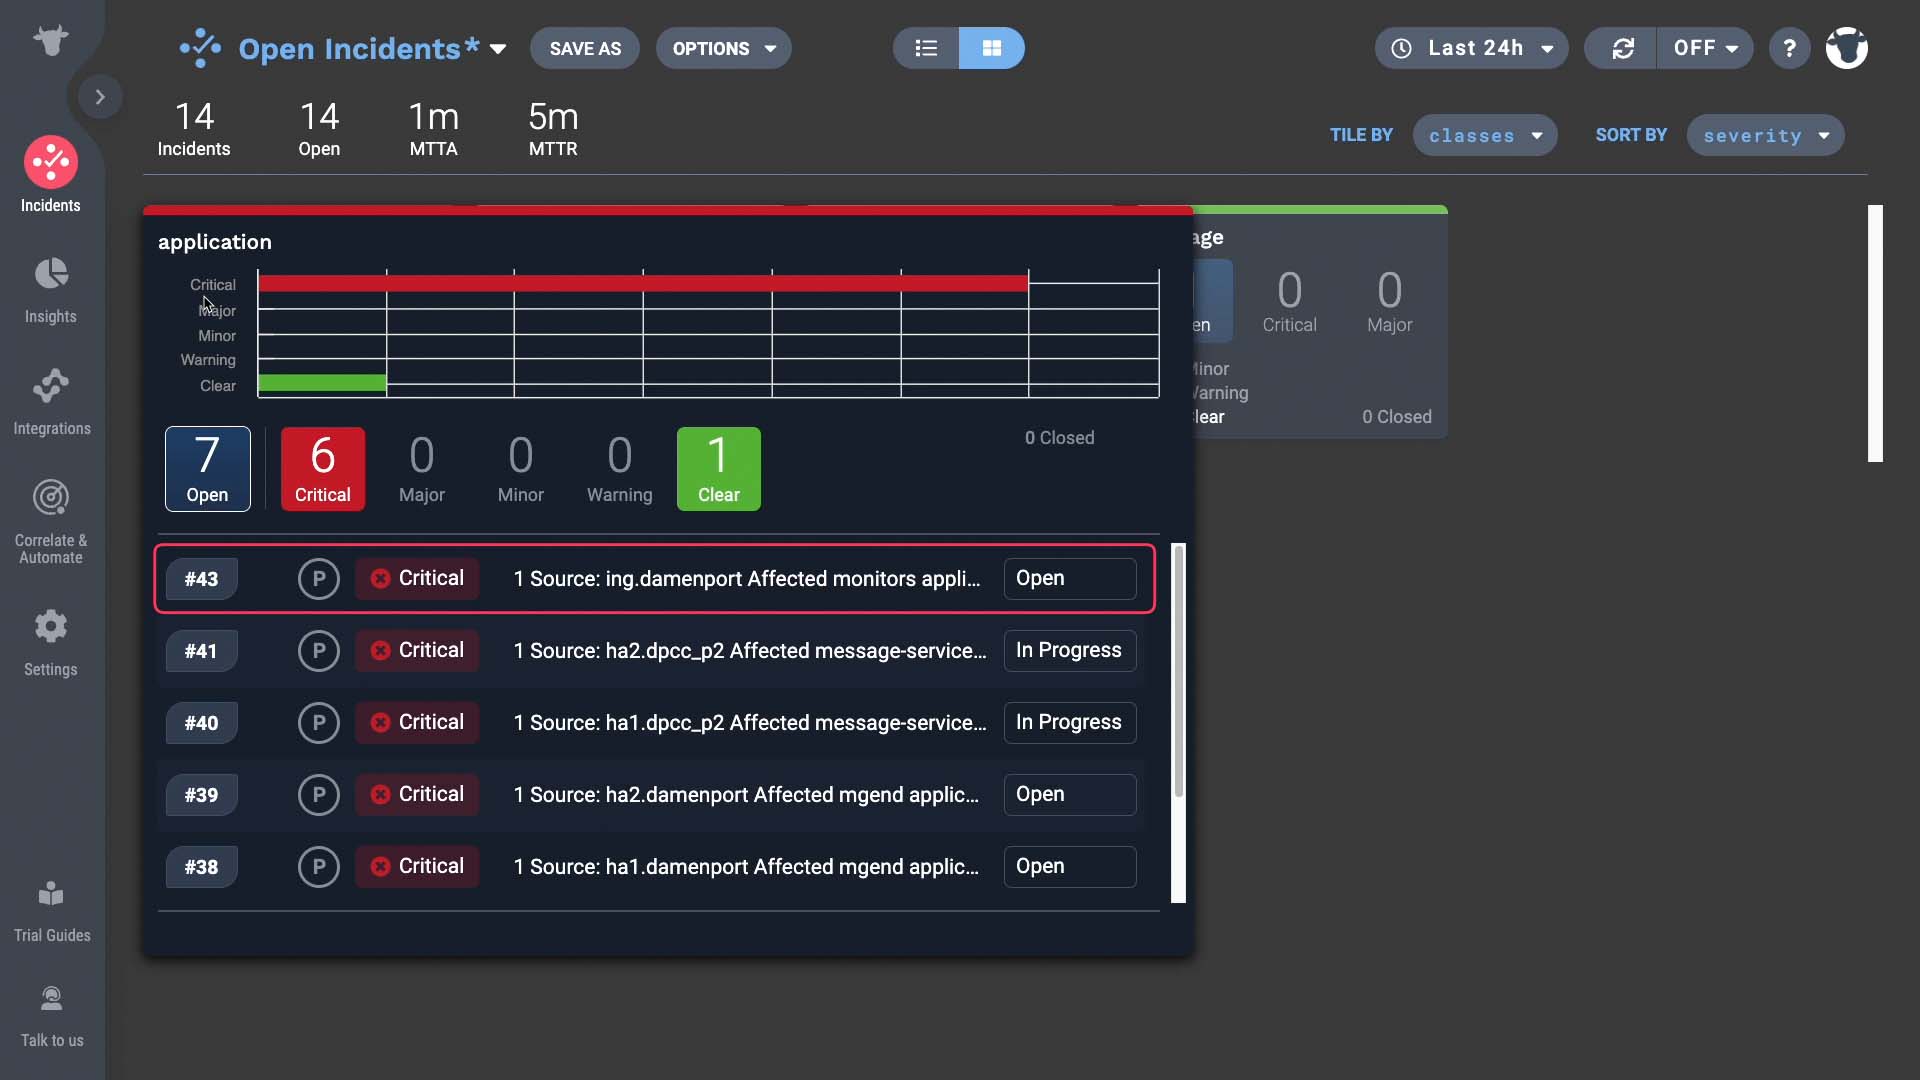
You can narrow down the list like this.
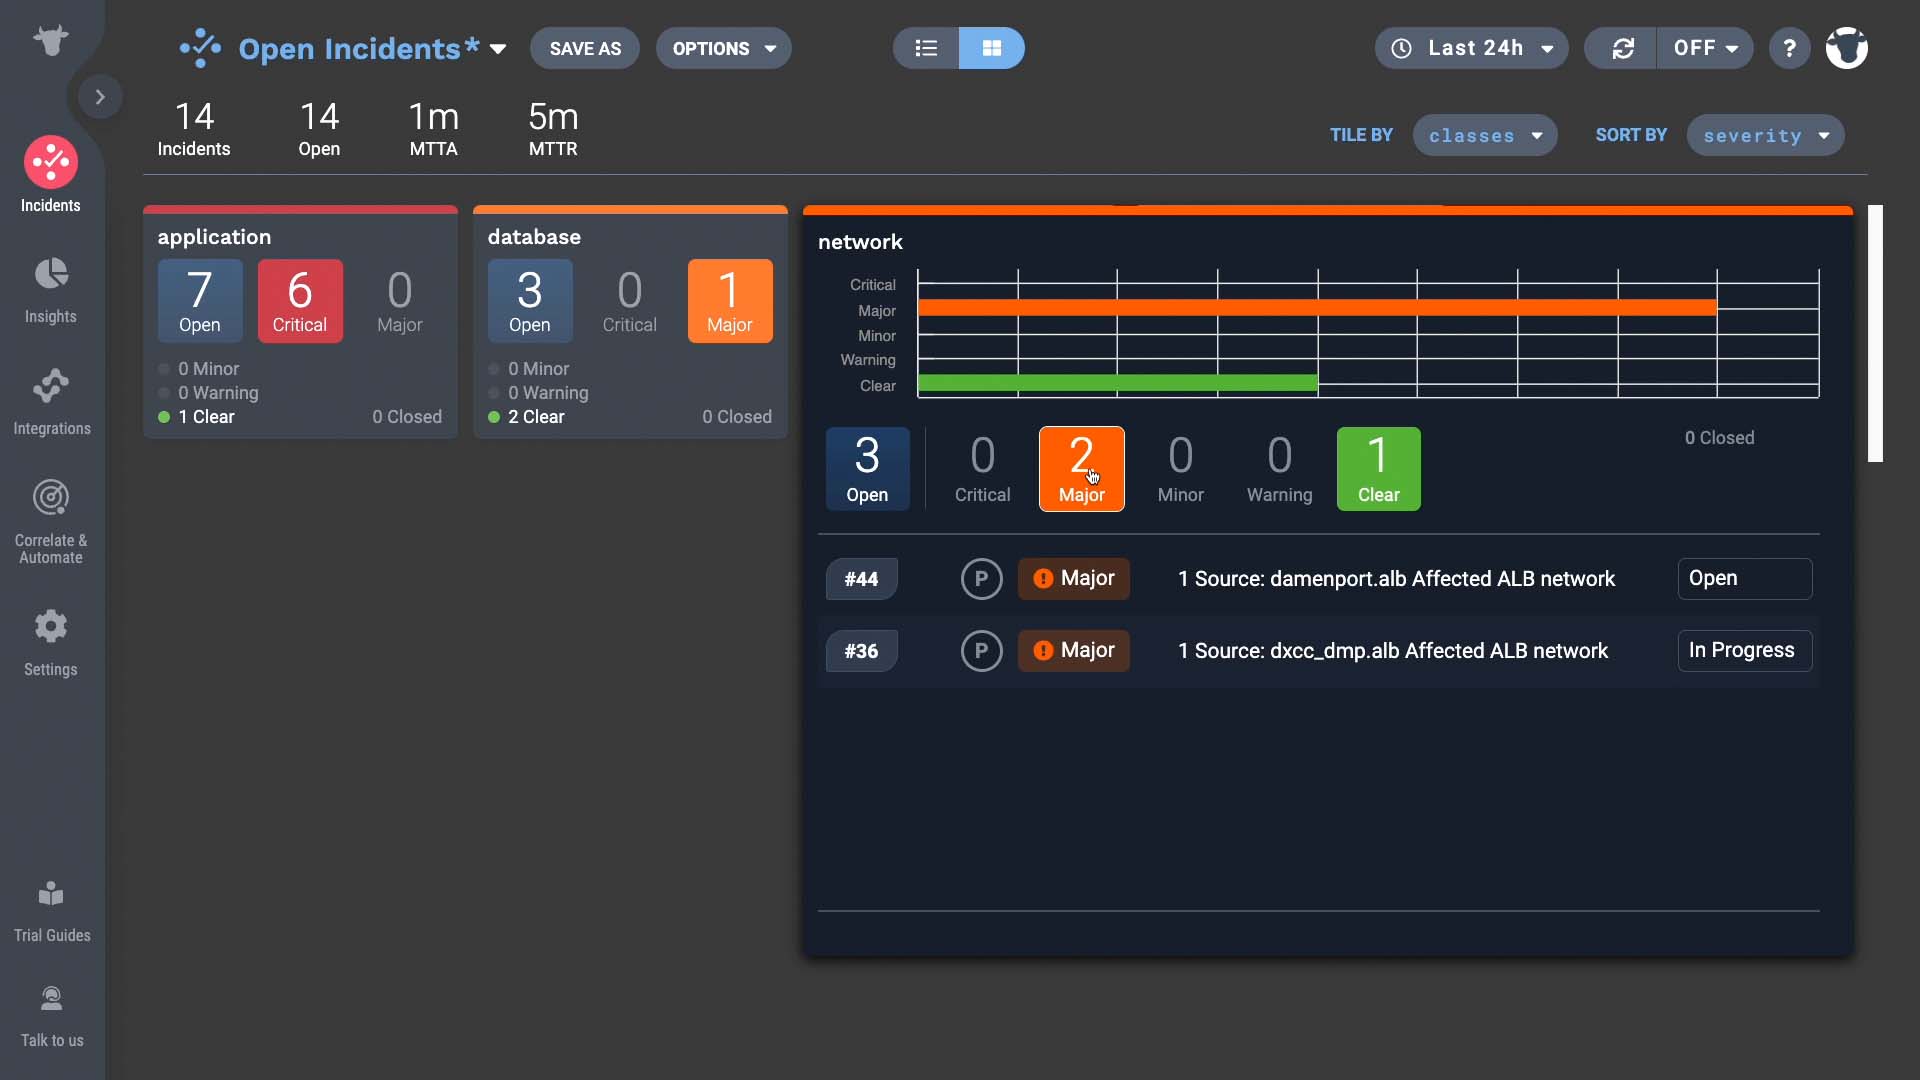
So if I wanted to learn more about critical application incidents it’s easy to do so. And, of course, go right into the Situation Room from here to start troubleshooting an incident.
Once you get the exact data you are looking for, you can save that dashboard.
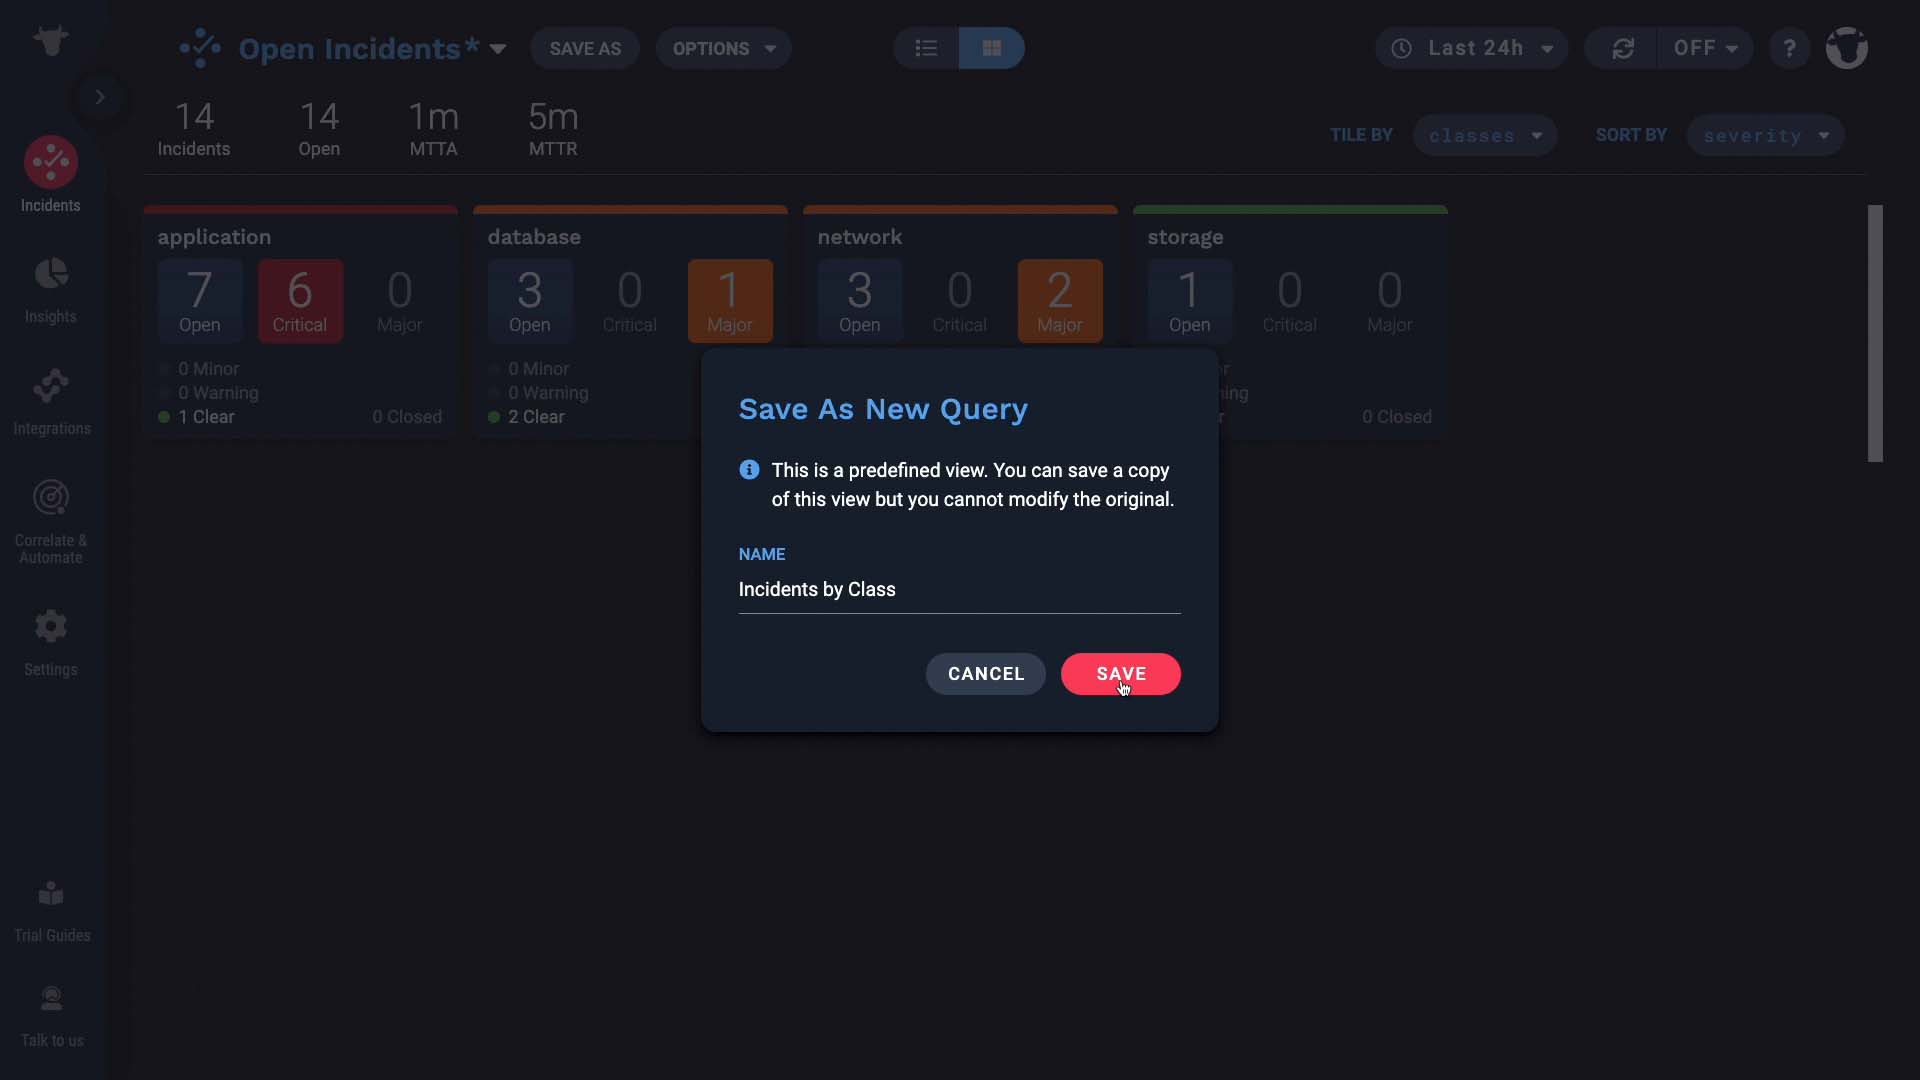
Now you have one-click access to the team’s stats!
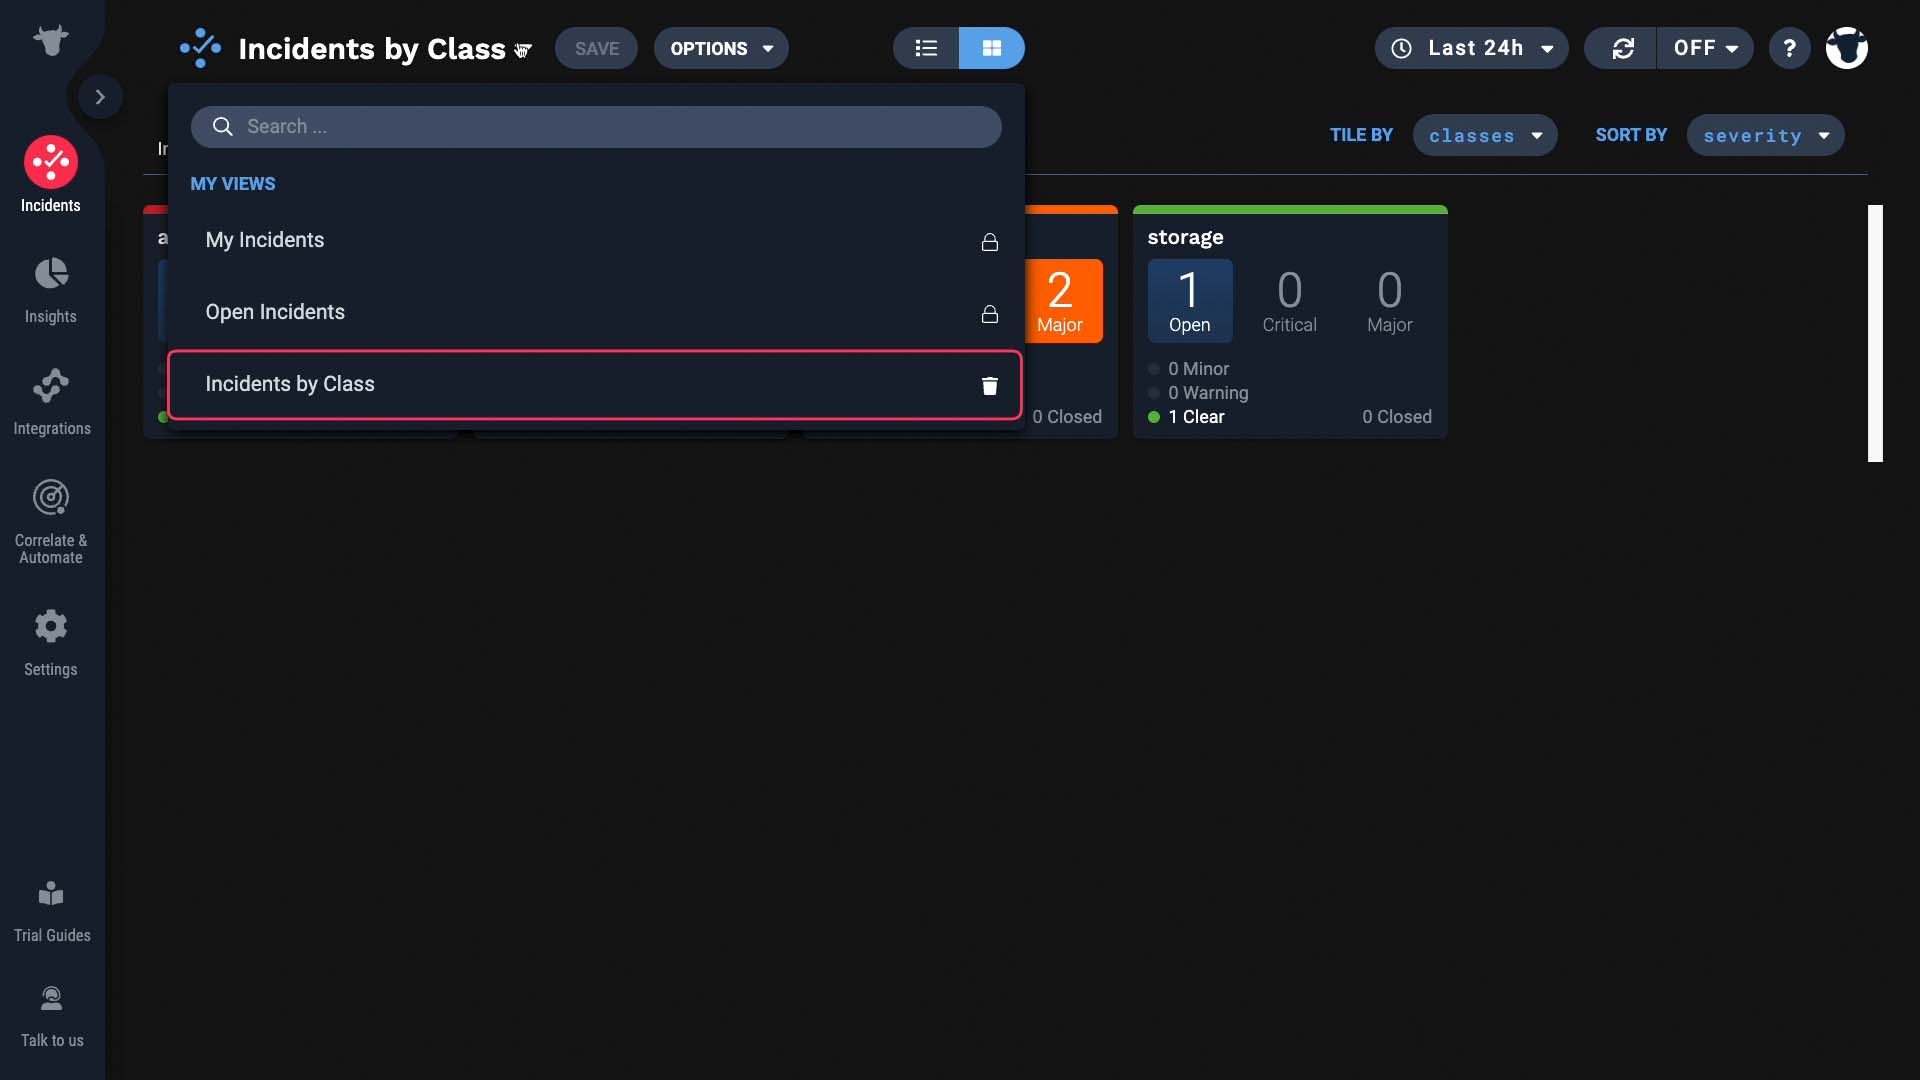
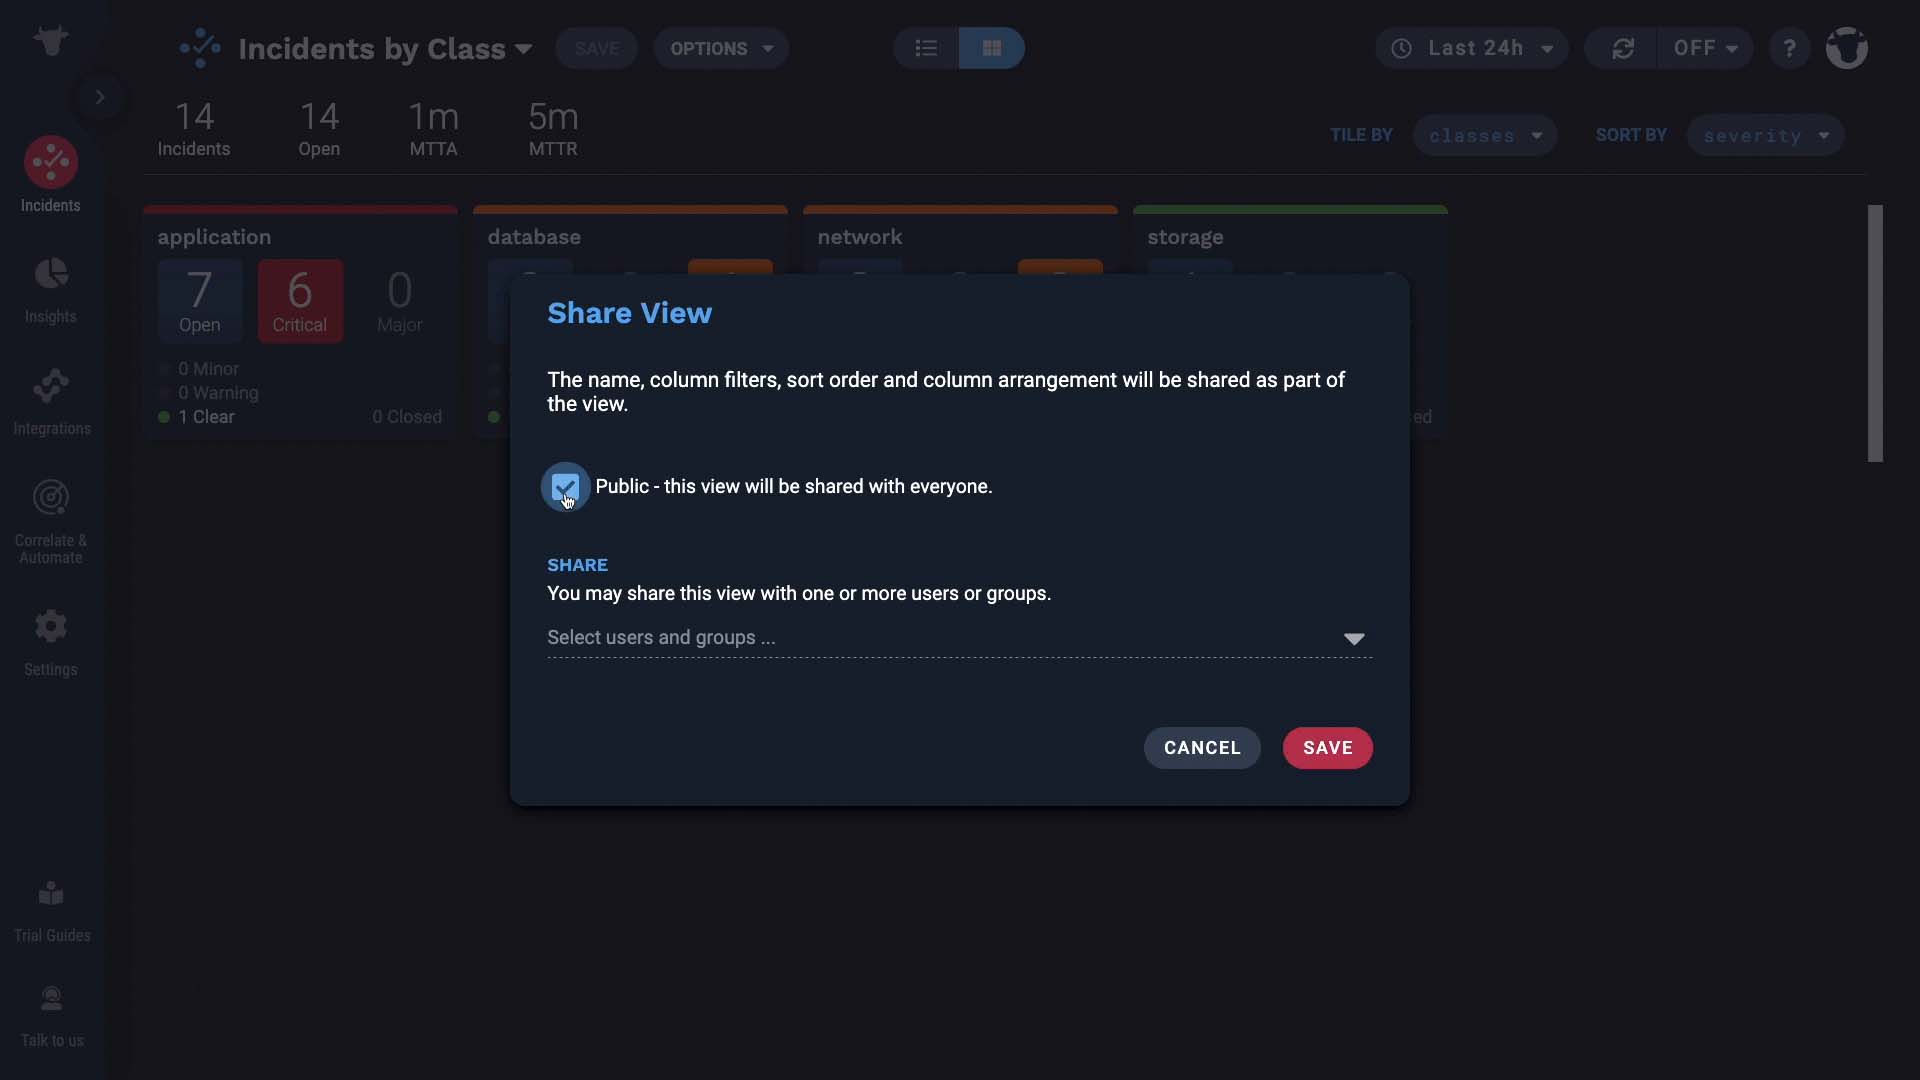
And the saved dashboards can be shared with specific groups or with everyone.
Shared dashboards are accessible from here…
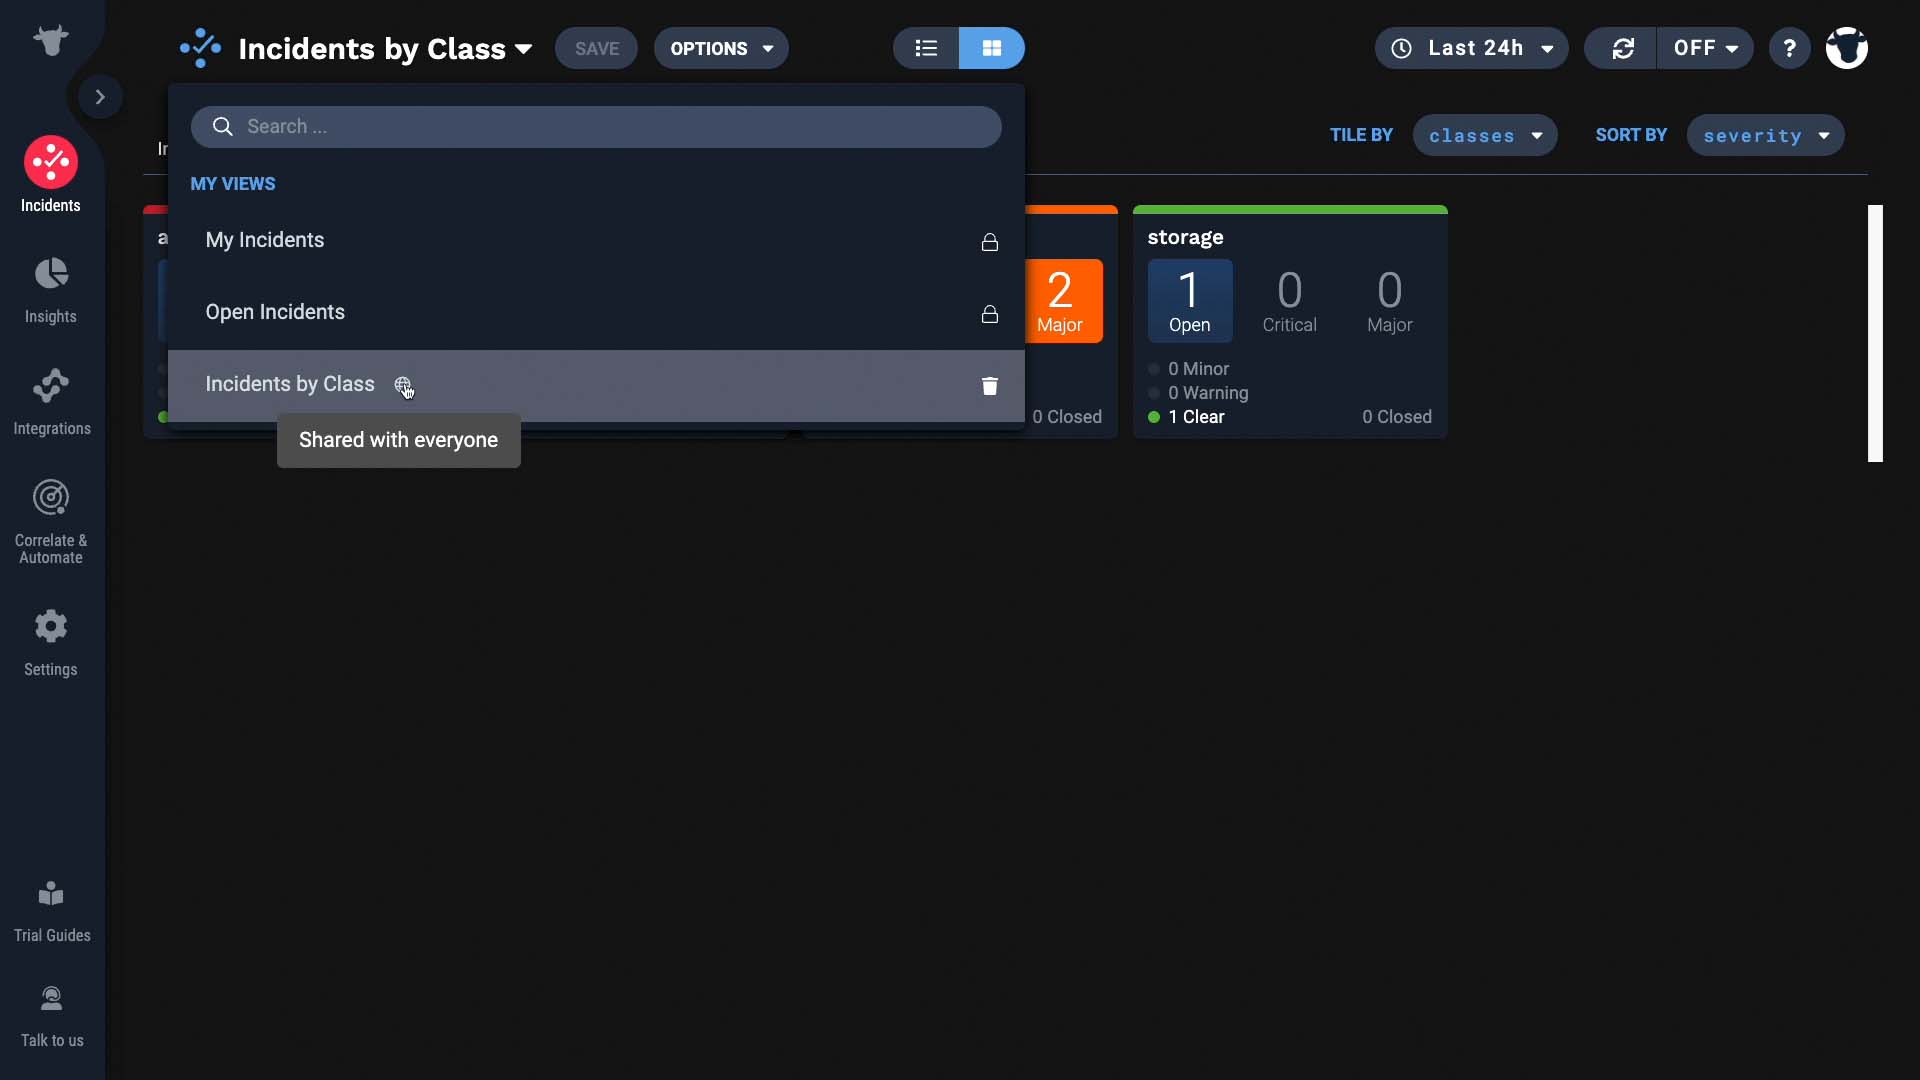
…and also from the Insight section.
Now everyone can view this dashboard, and even set it as their default view! Thanks for watching!