Demo video: Configure a correlation engine ►
This video explains how to configure a correlation engine in APEX AIOps Incident Management.
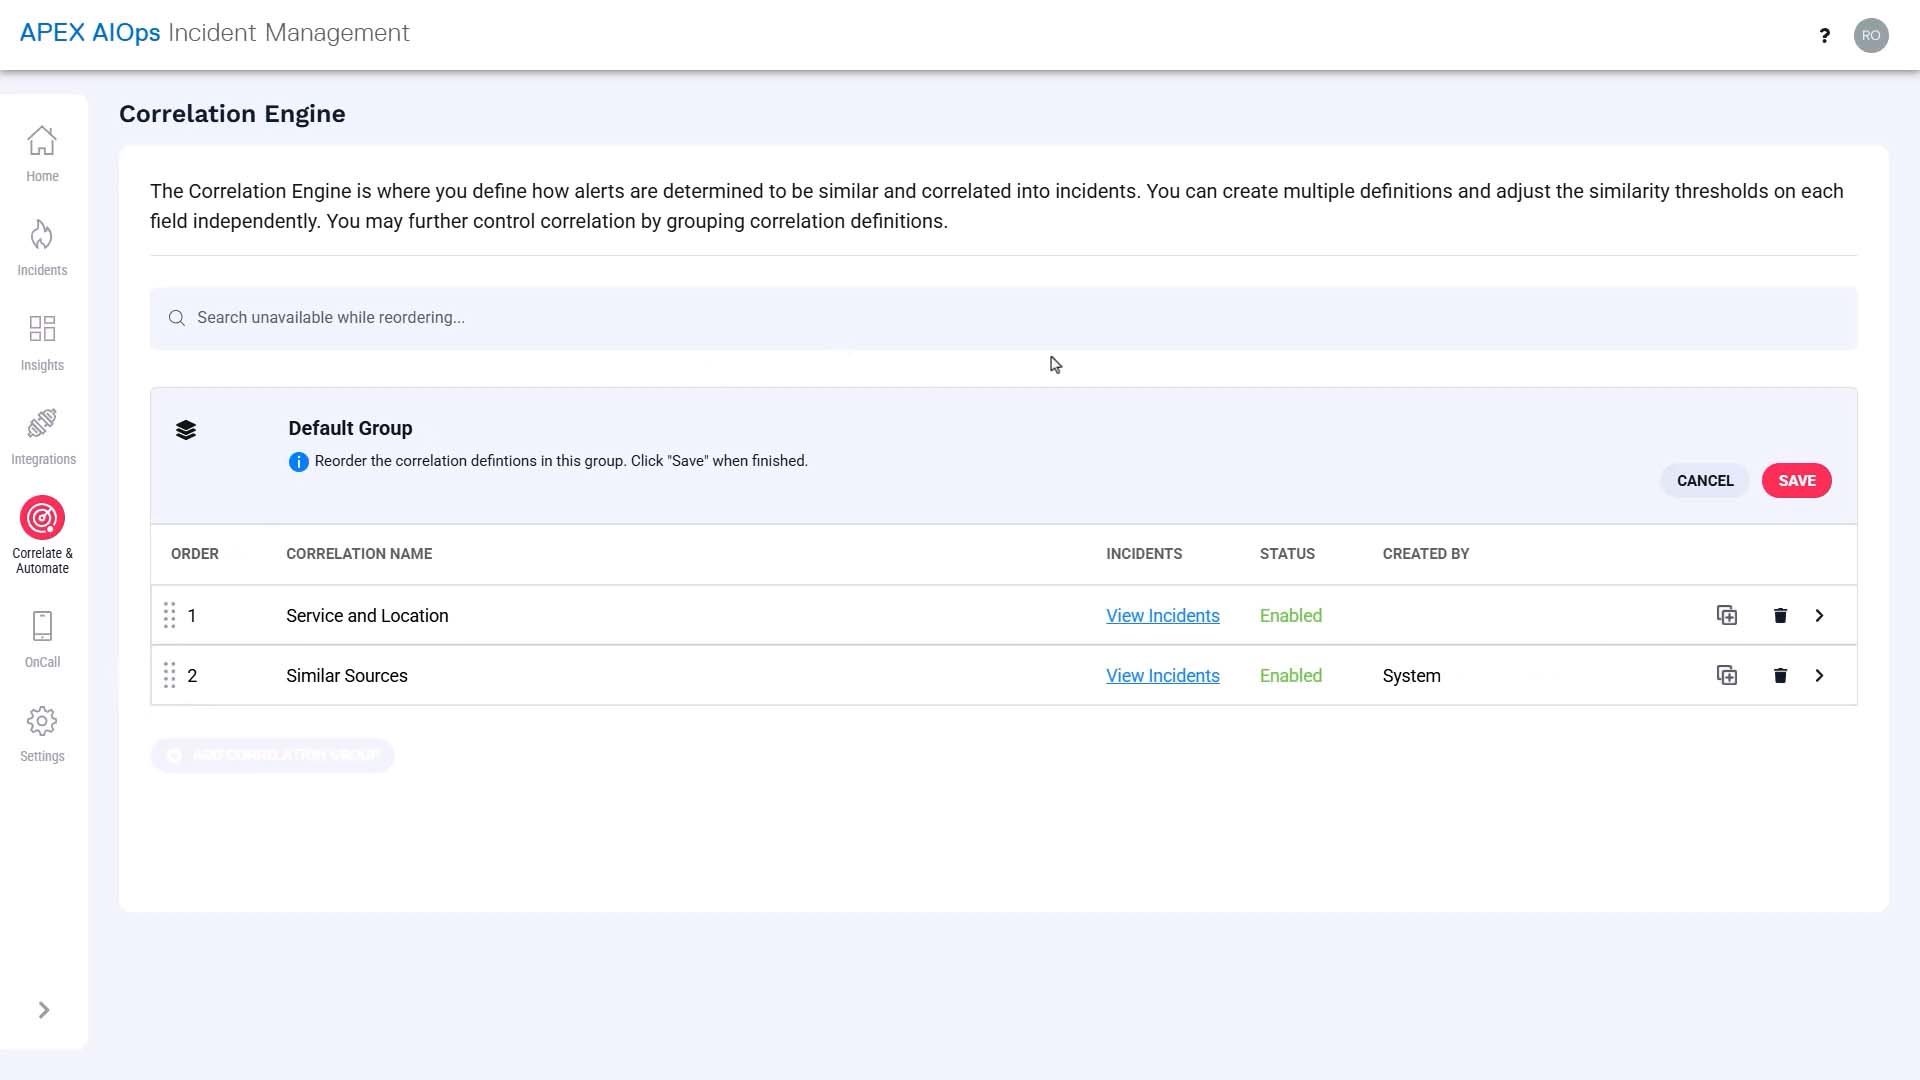
Incident Management’s correlation engine groups related alerts and forms incidents. This happens automatically with no configuration. But in this video, you’ll learn how to create additional correlation settings to tailor it to your specific needs.
We will use a sample use case to step through the process of surfacing the requirements and configuring the product.
Suppose you are implementing Incident Management to facilitate collaboration between the infrastructure team and the application team.
The infrastructure team is organized by region, and each regional team breaks down into a few service categories.
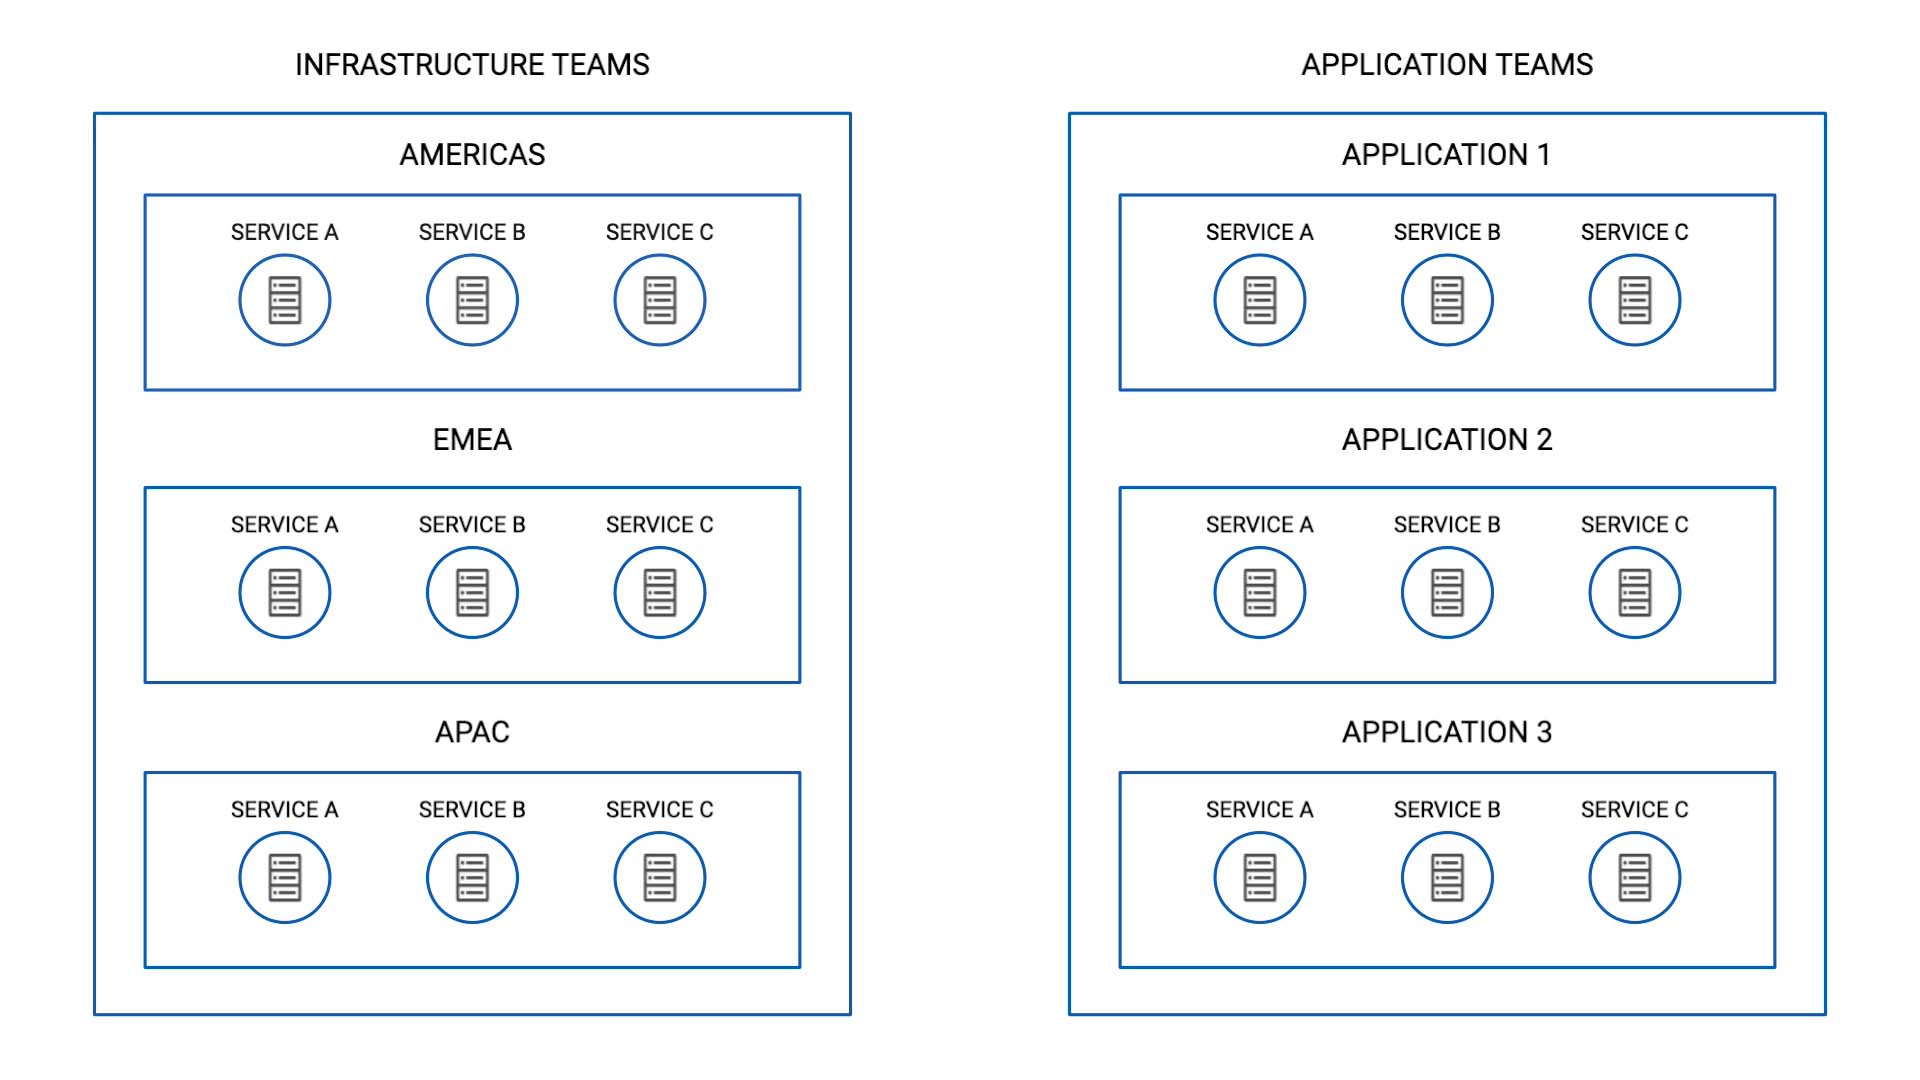
So, if the server that supports service A in the US suffers, you want this team (AMERICAS - service A) and this team (Application 1 - service A) to come together and investigate.
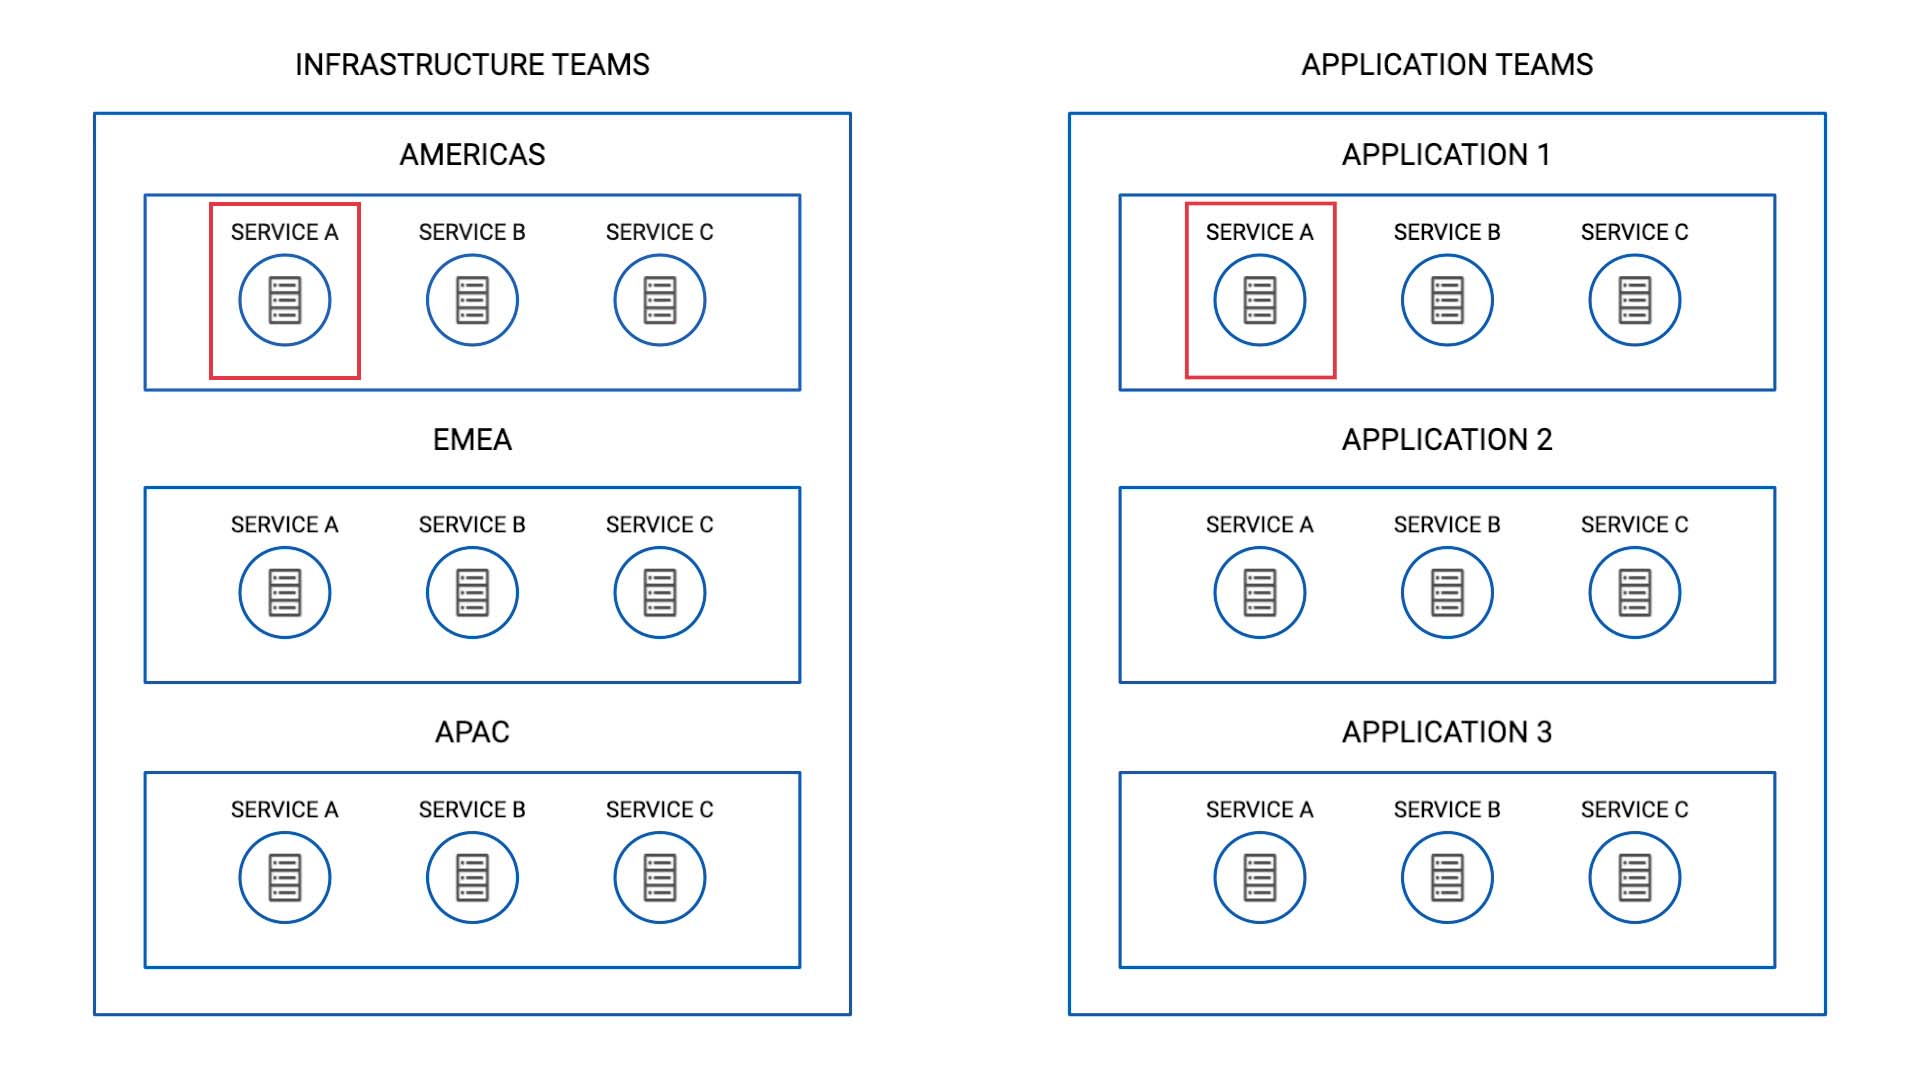
Also, since the infrastructure teams are organized by location, you need to differentiate the events originated in different regions.
So this means just because service A is impacted, you don’t want to bundle alerts from the AMERICAS and EMEA clusters together.
You also noted that in the CMDB some of the values are not spelled consistently, like this for example. But we want to treat these as the same location.

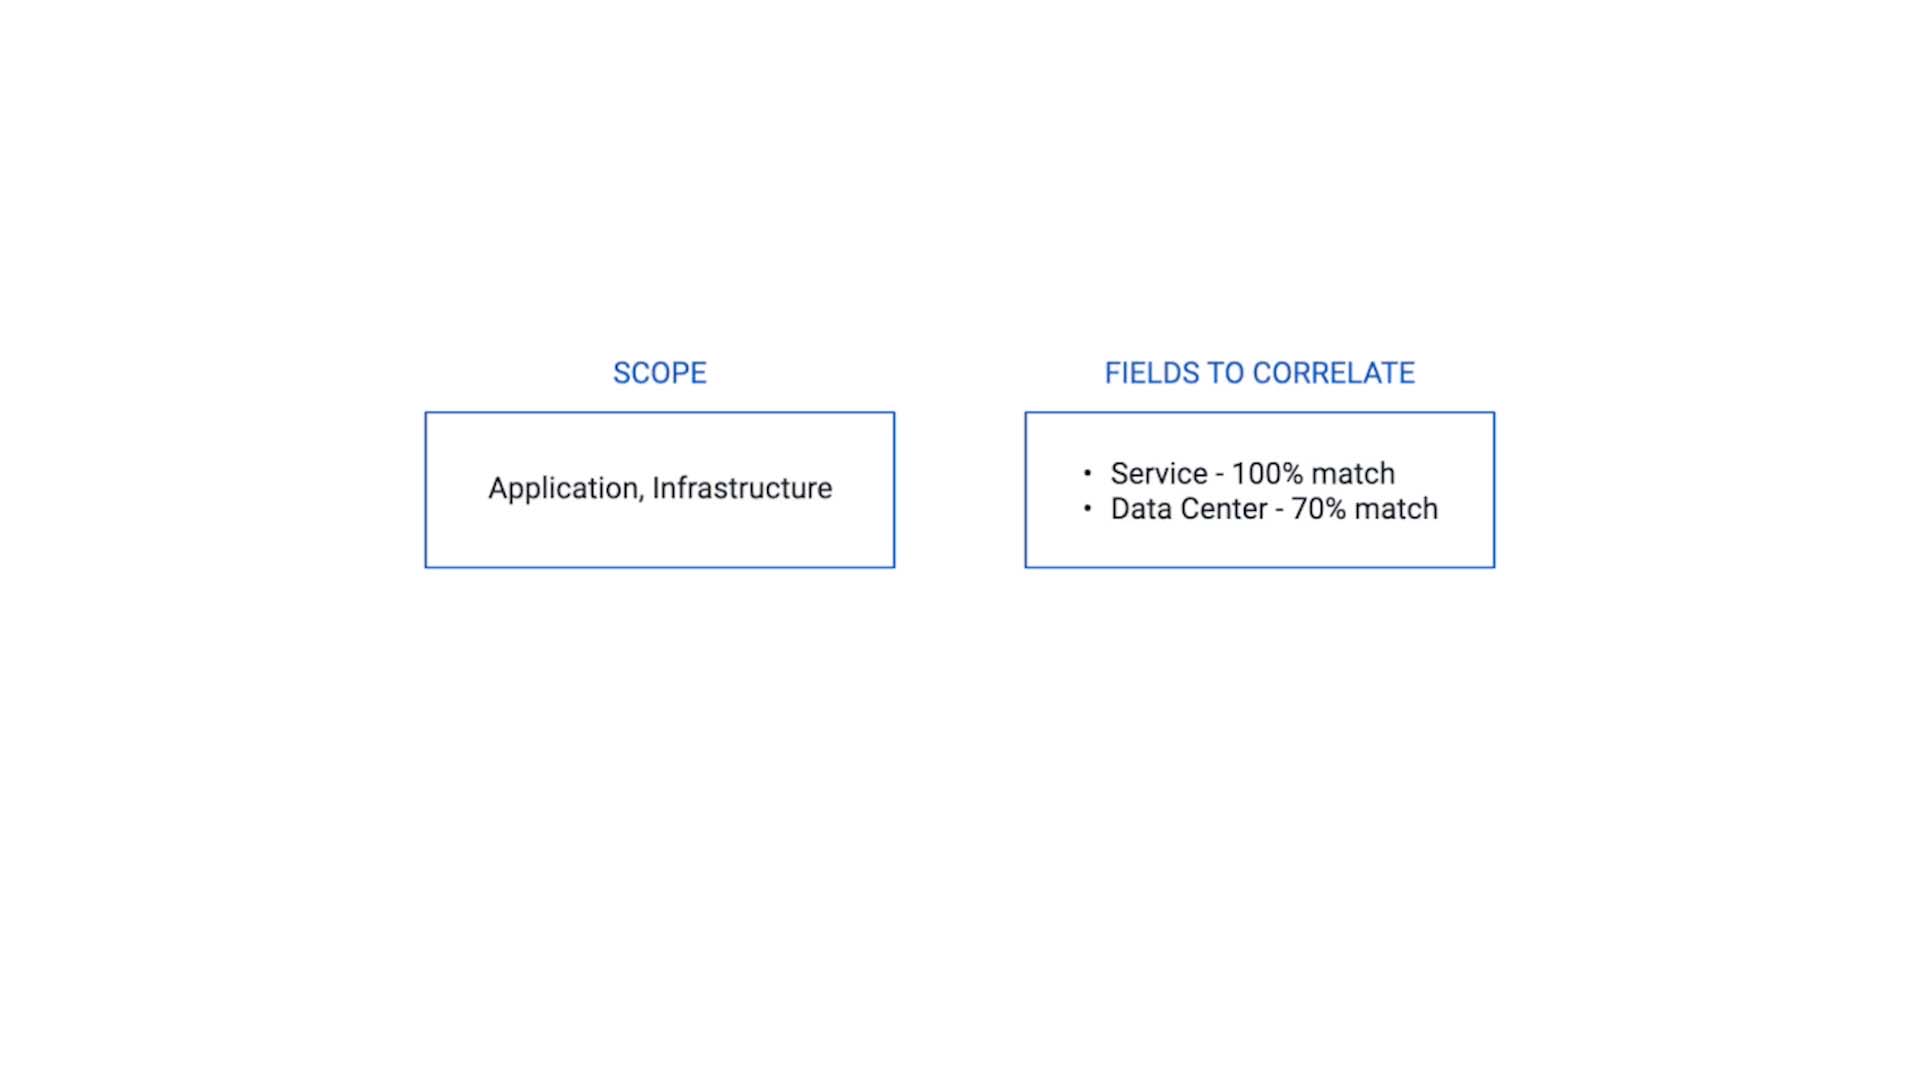
Based on the analysis so far, here’s how we want to correlate our alerts for this use case.
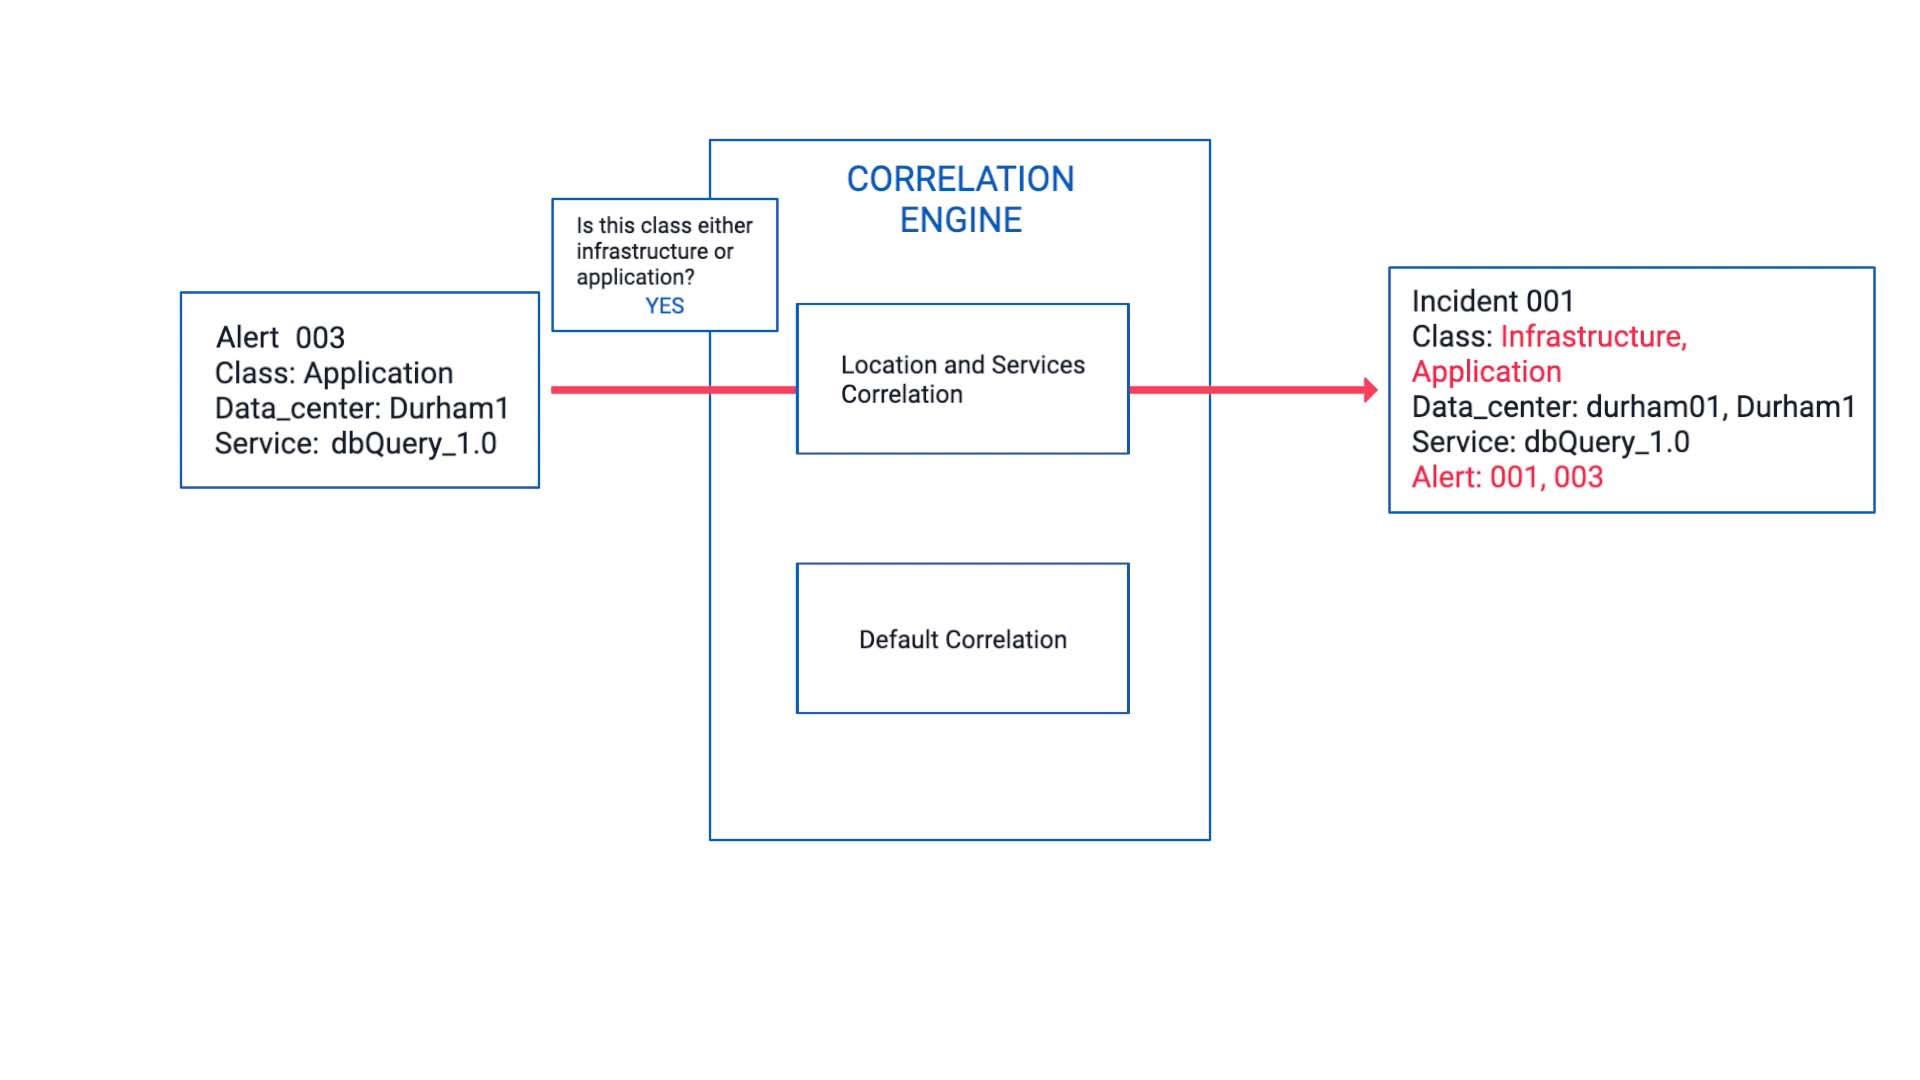
Evaluate only the alerts whose class are Application or Infrastructure
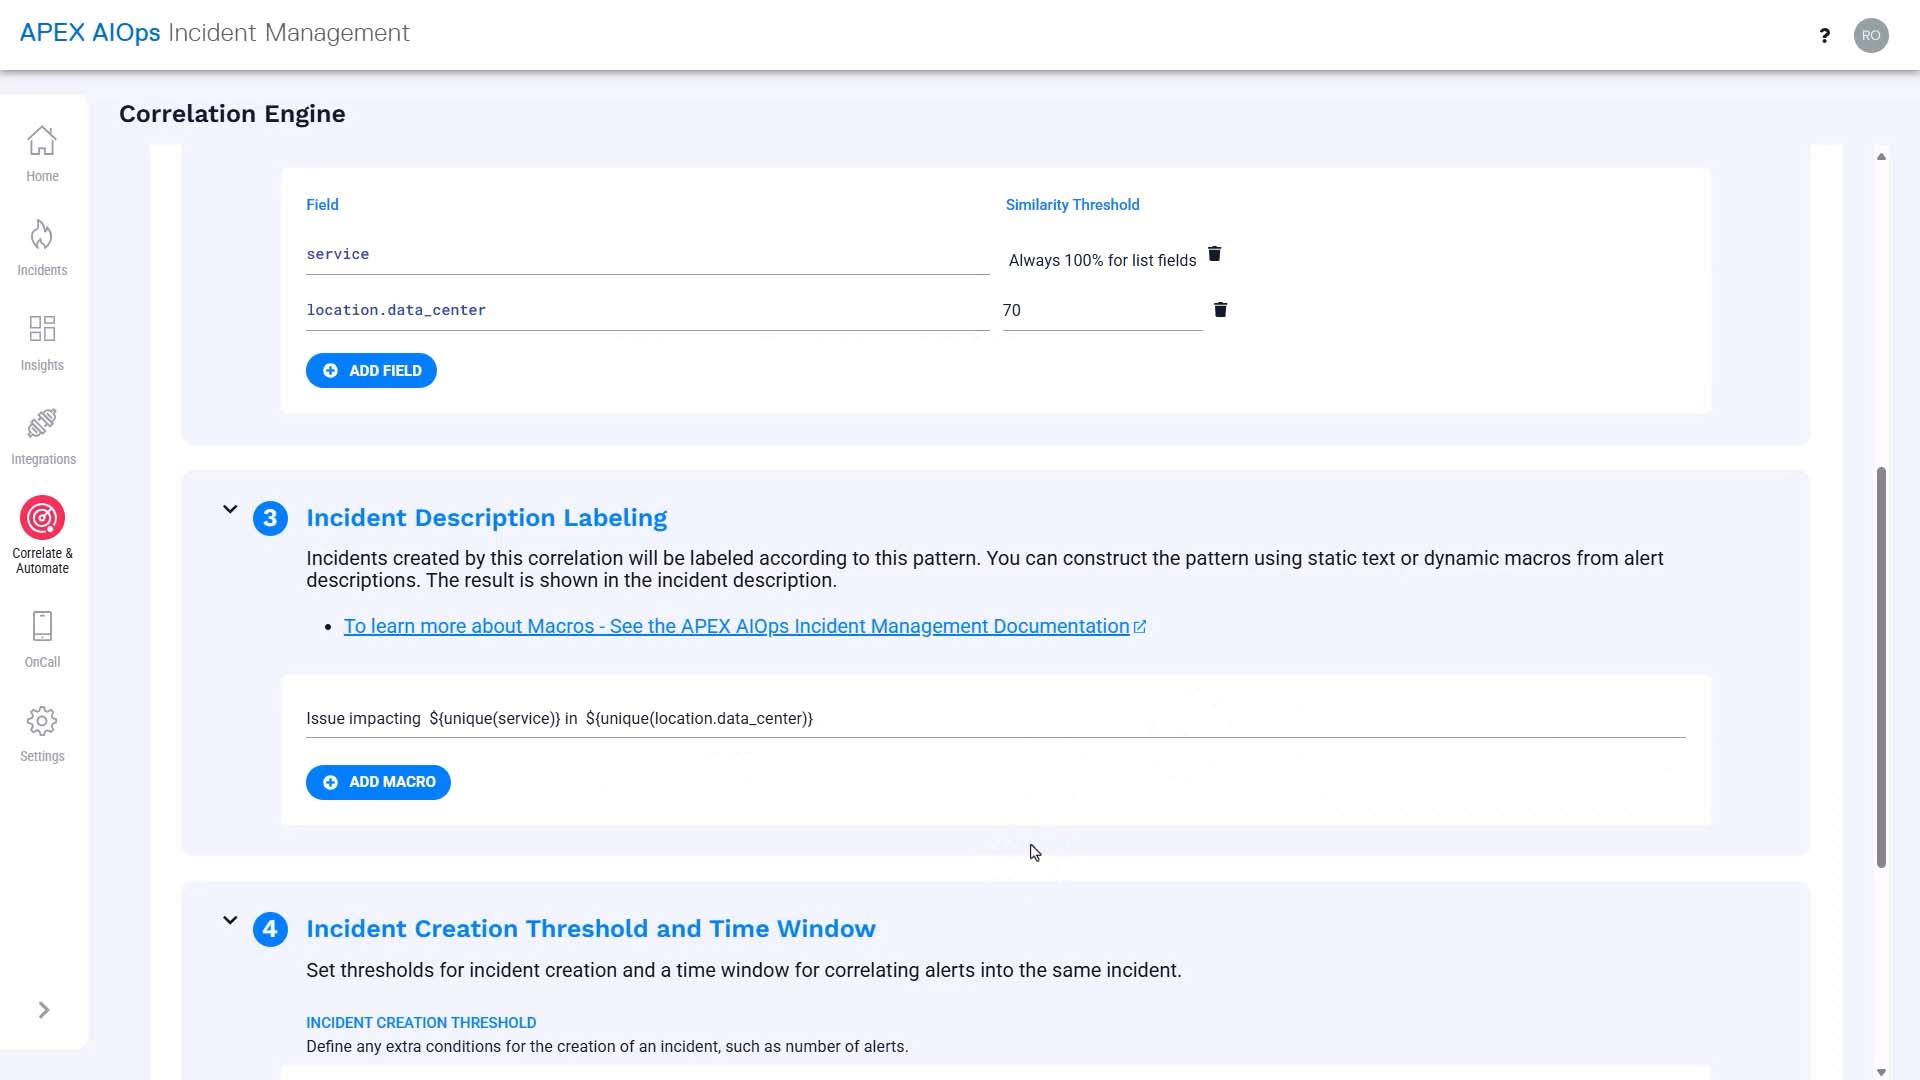
Service - 100% match
Data Center - 70% match to accommodate the variation in spelling.
Now let me show you how to set this up.
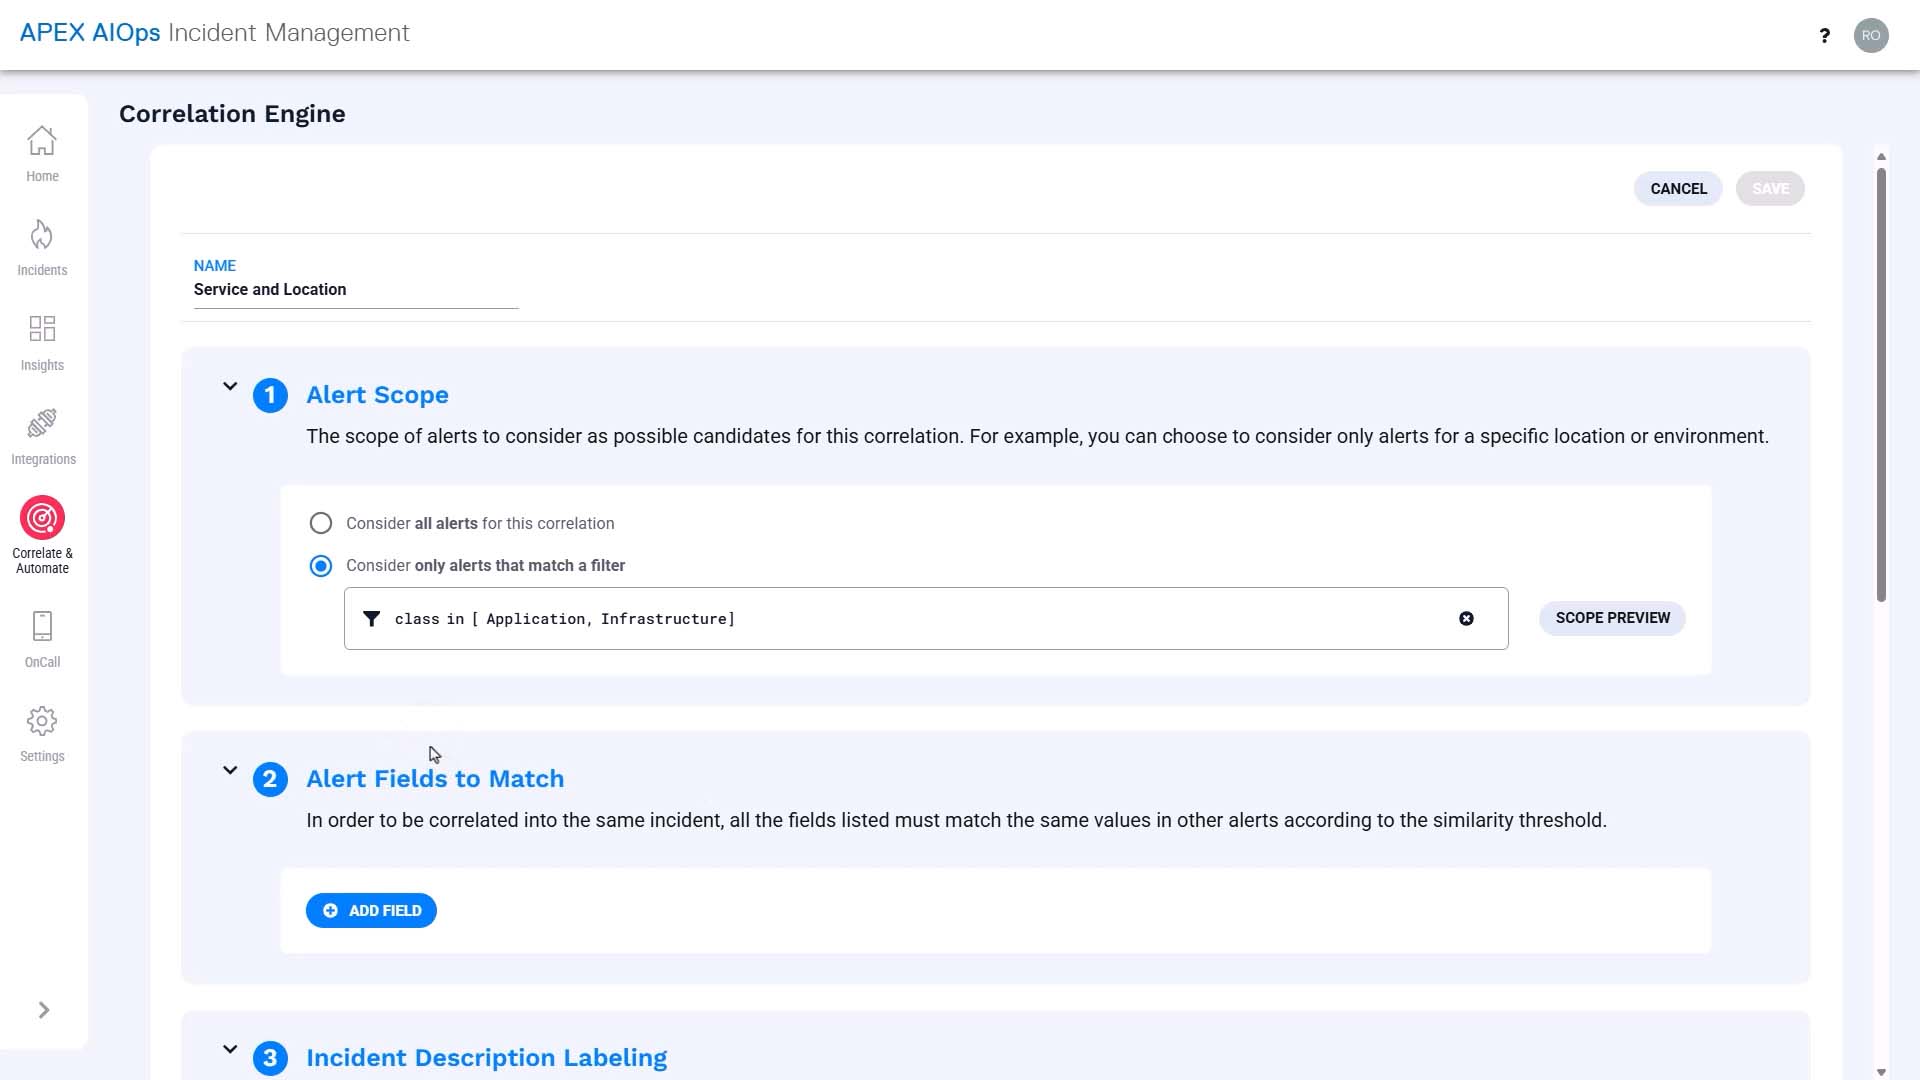
Provide a name that makes sense to other administrators, too.
Scope is basically an entry filter.
In our use case, this correlation only applies to the alerts whose class is application or infrastructure.
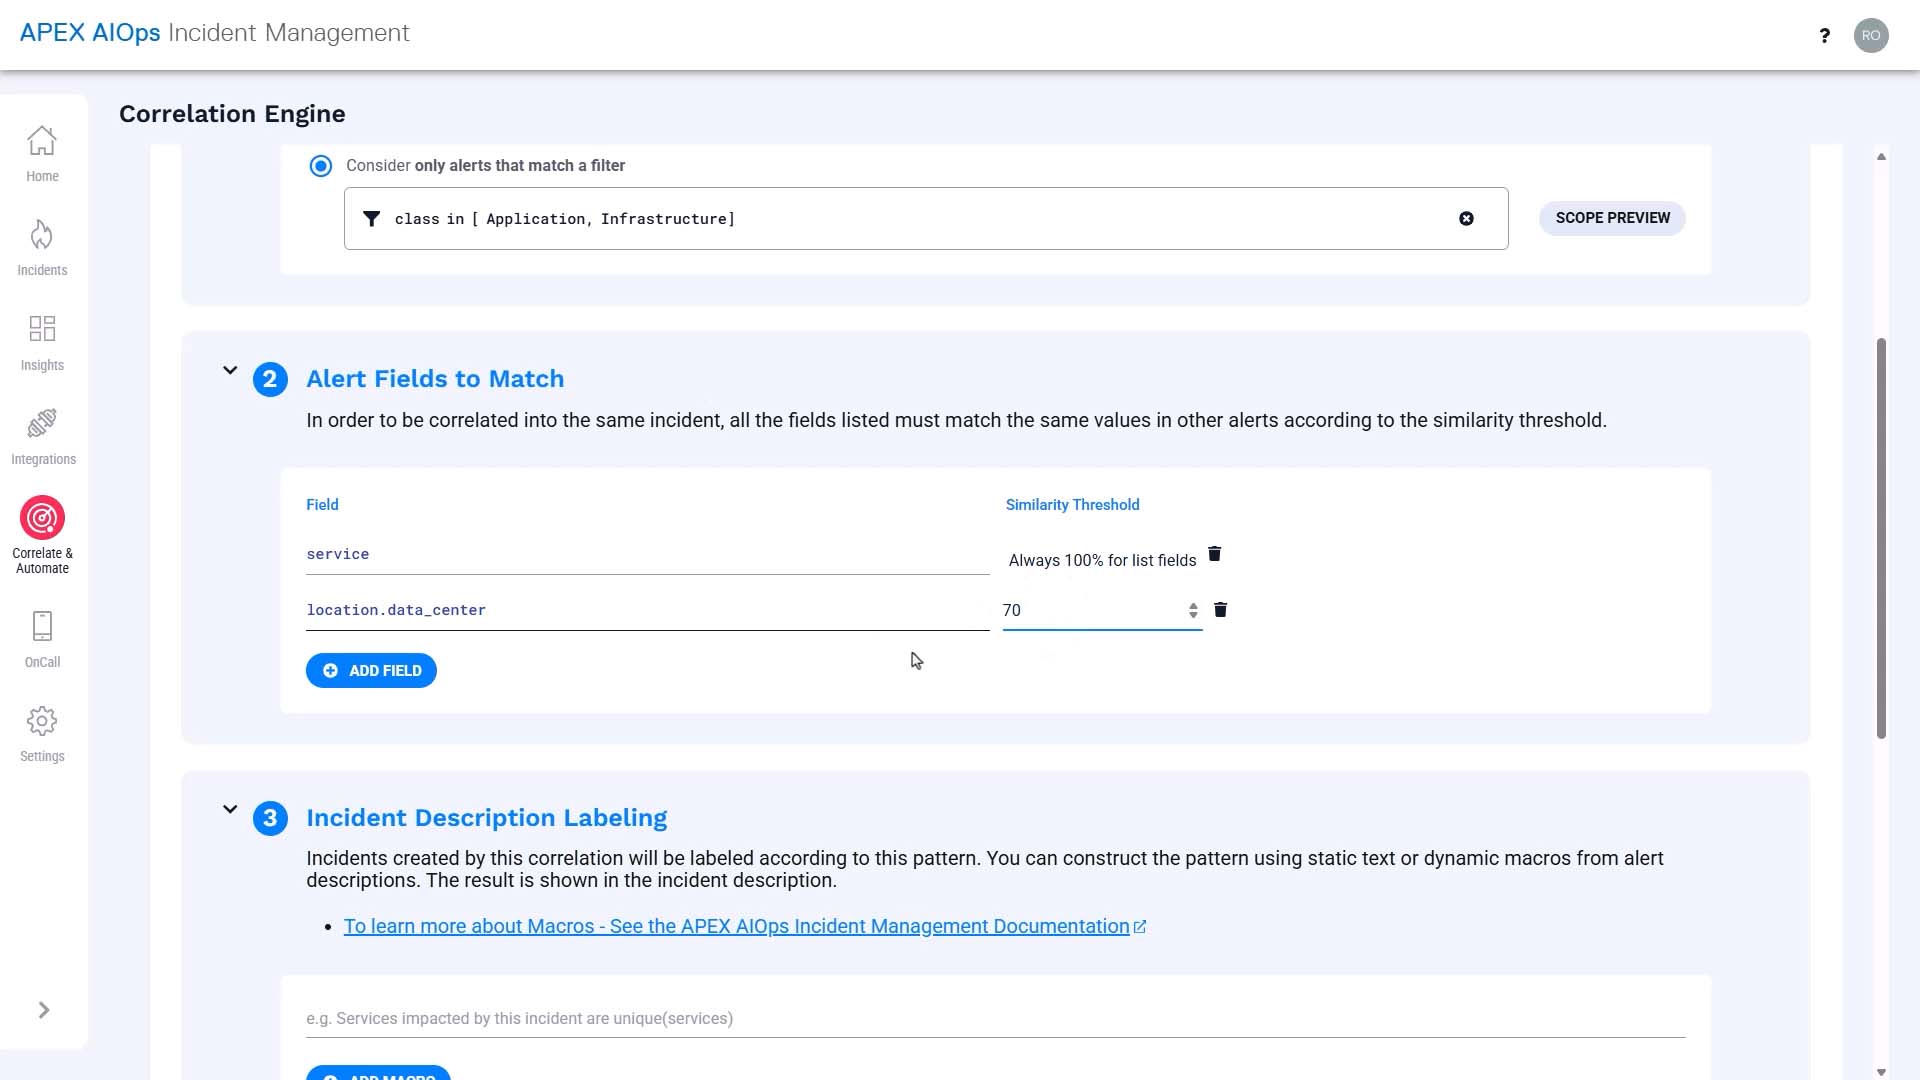
And we want to cluster alerts from the same service. Service defaults to 100% similarity because it is a list-based field.
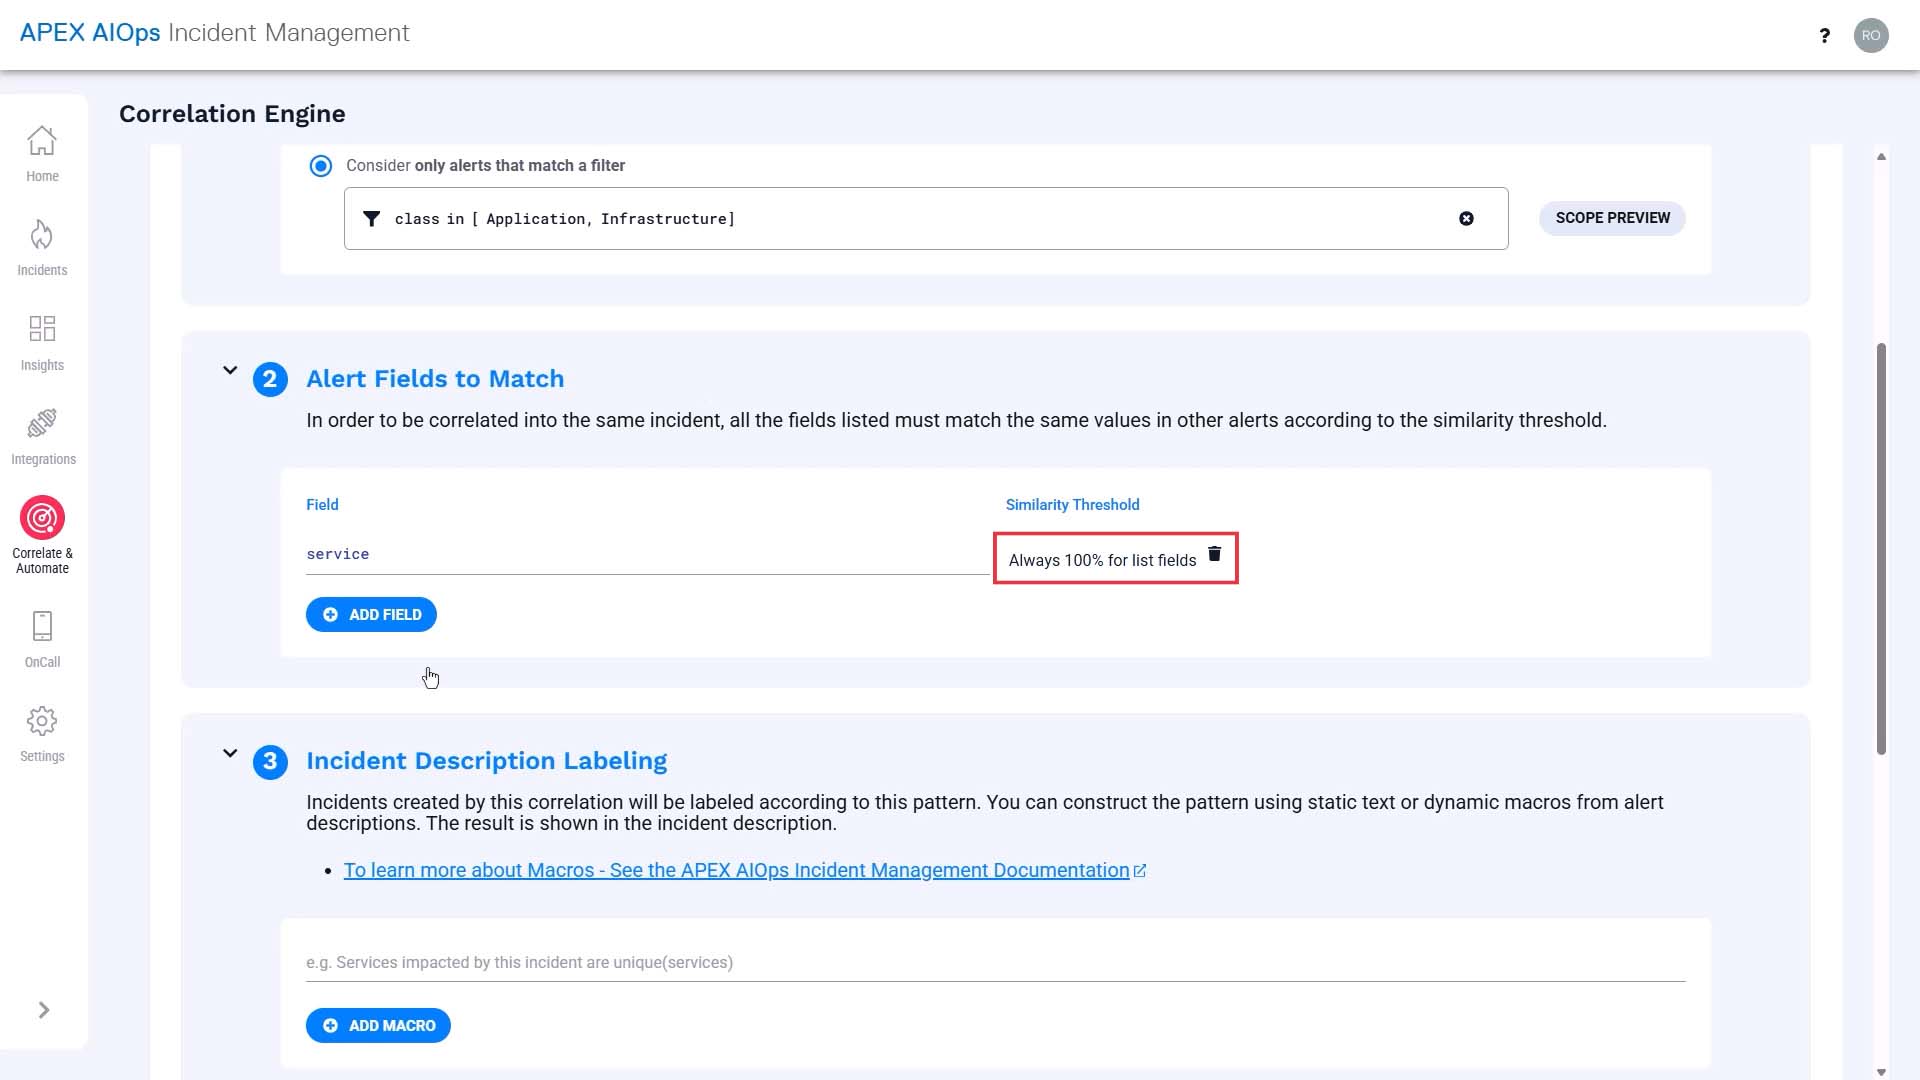
And we want to cluster alerts from the same location, but considering the variation in spelling, we’ll set the similarity value at 70%.
What you put into the description field will be used as the incident description, so you want to make it as helpful as possible.
We are going to use macros to insert dynamic information here.
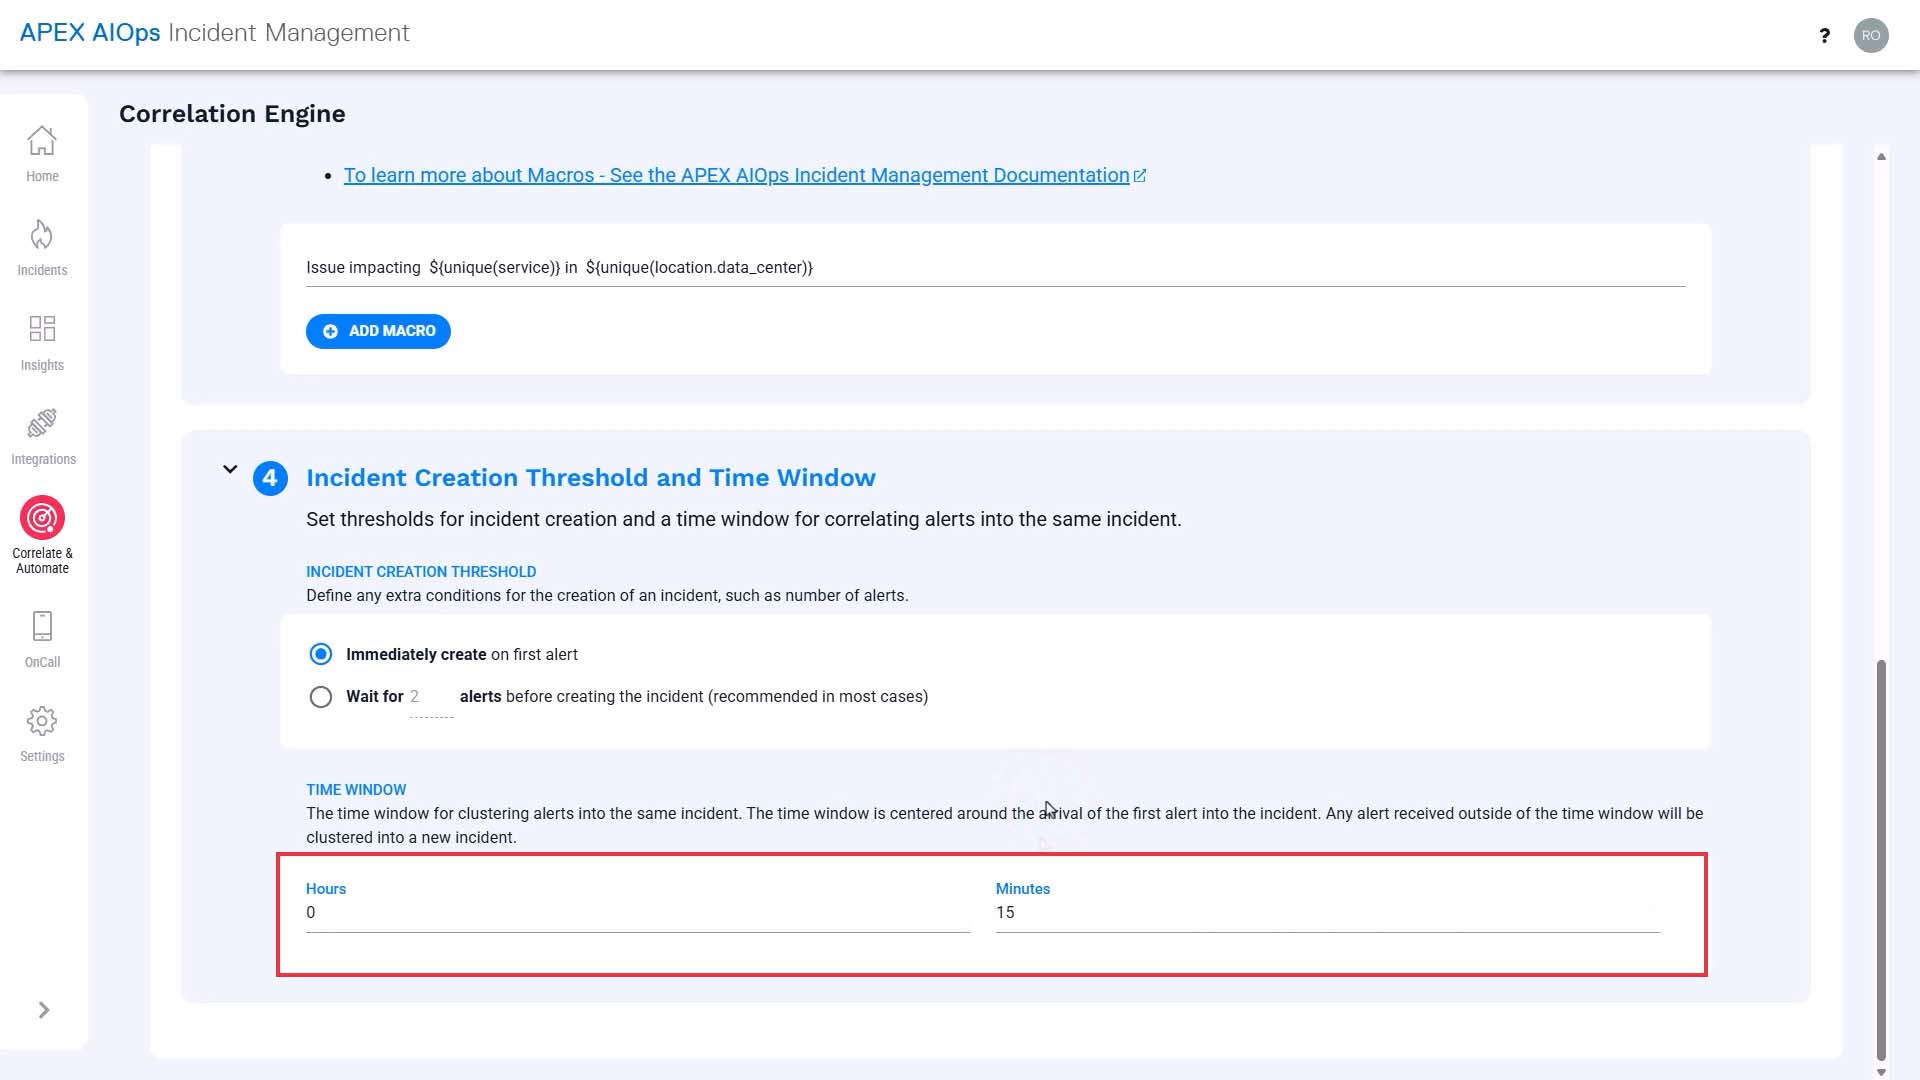
We’ll set the time window to 15 minutes. To understand the correlation time window, watch the “Alert Correlation Method in Incident Management” video.
Now, let’s also modify the correlation group settings, so the alerts evaluated by the new correlation setting won’t be evaluated by the default correlation, and end up in two separate incidents.
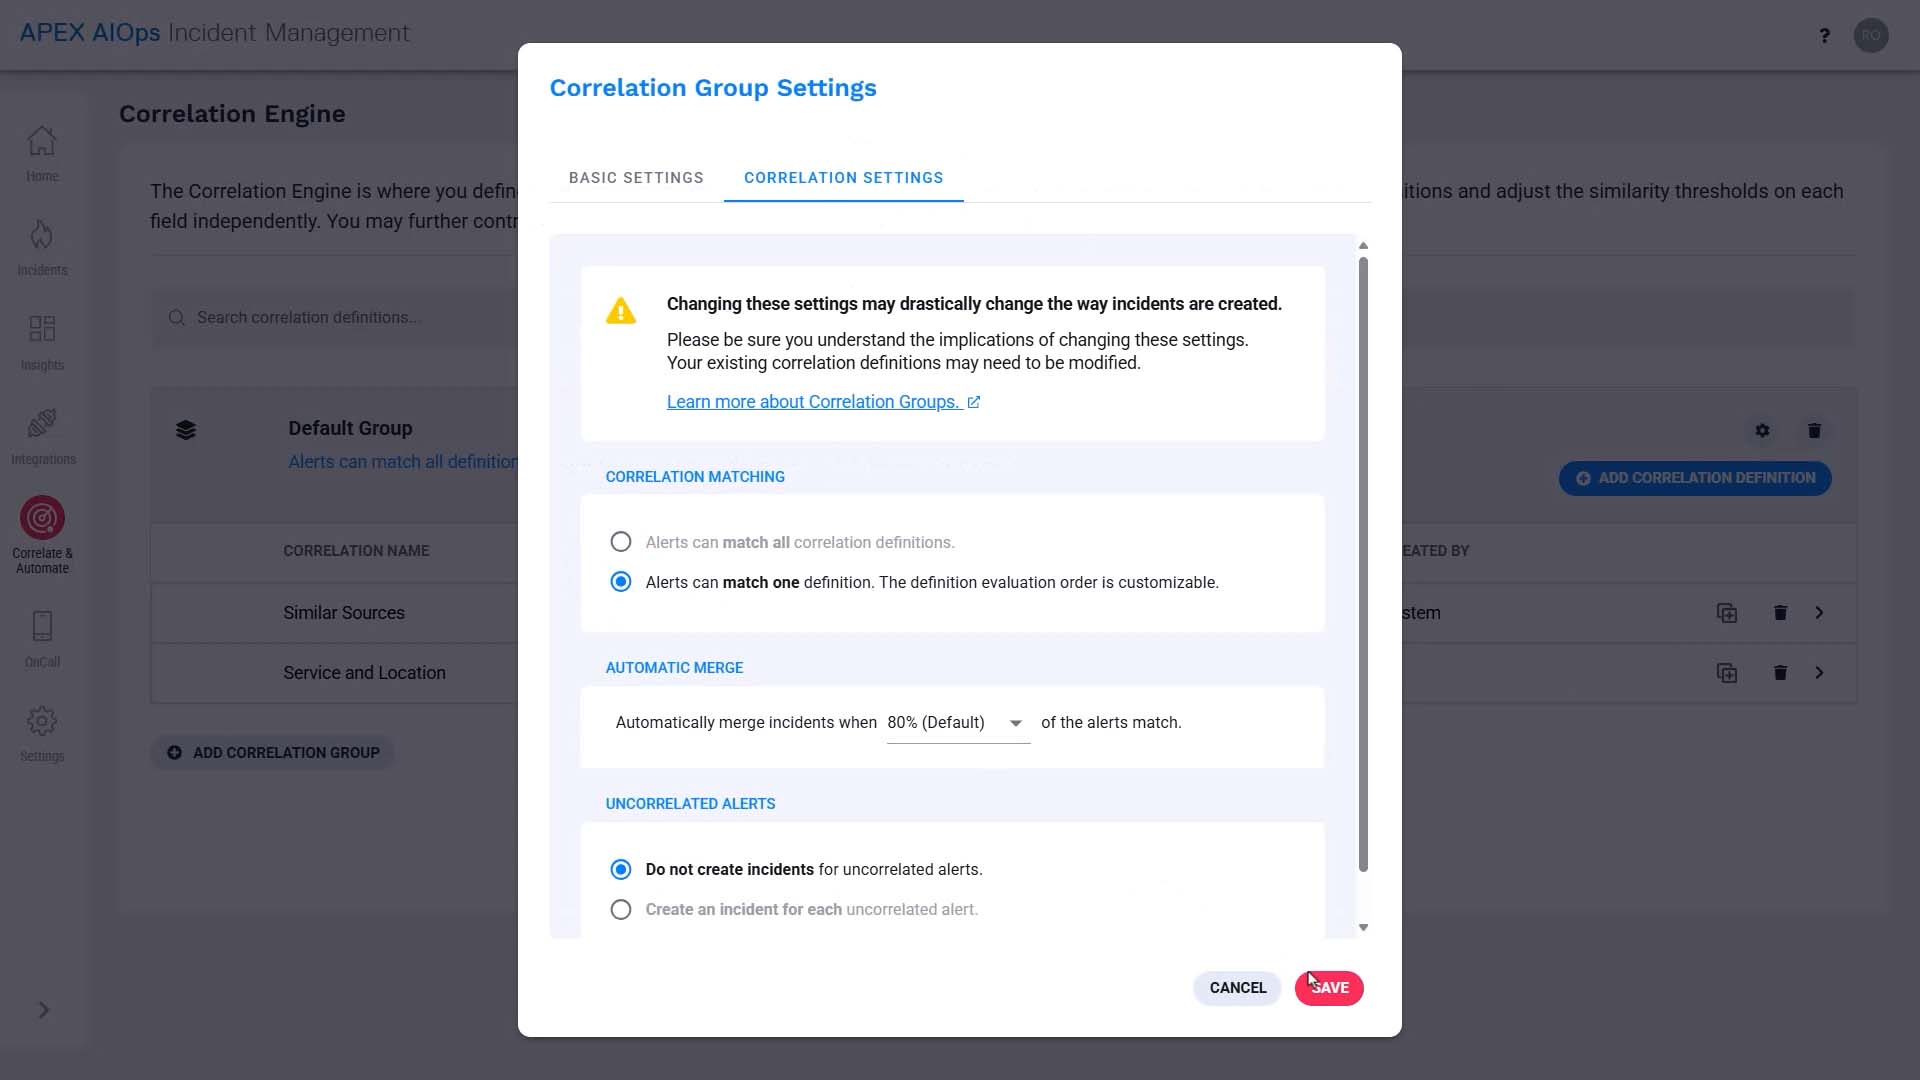
Let's change the order so our new definition is evaluated first.
Now let’s simulate what happens to the alerts with this new correlation definition.
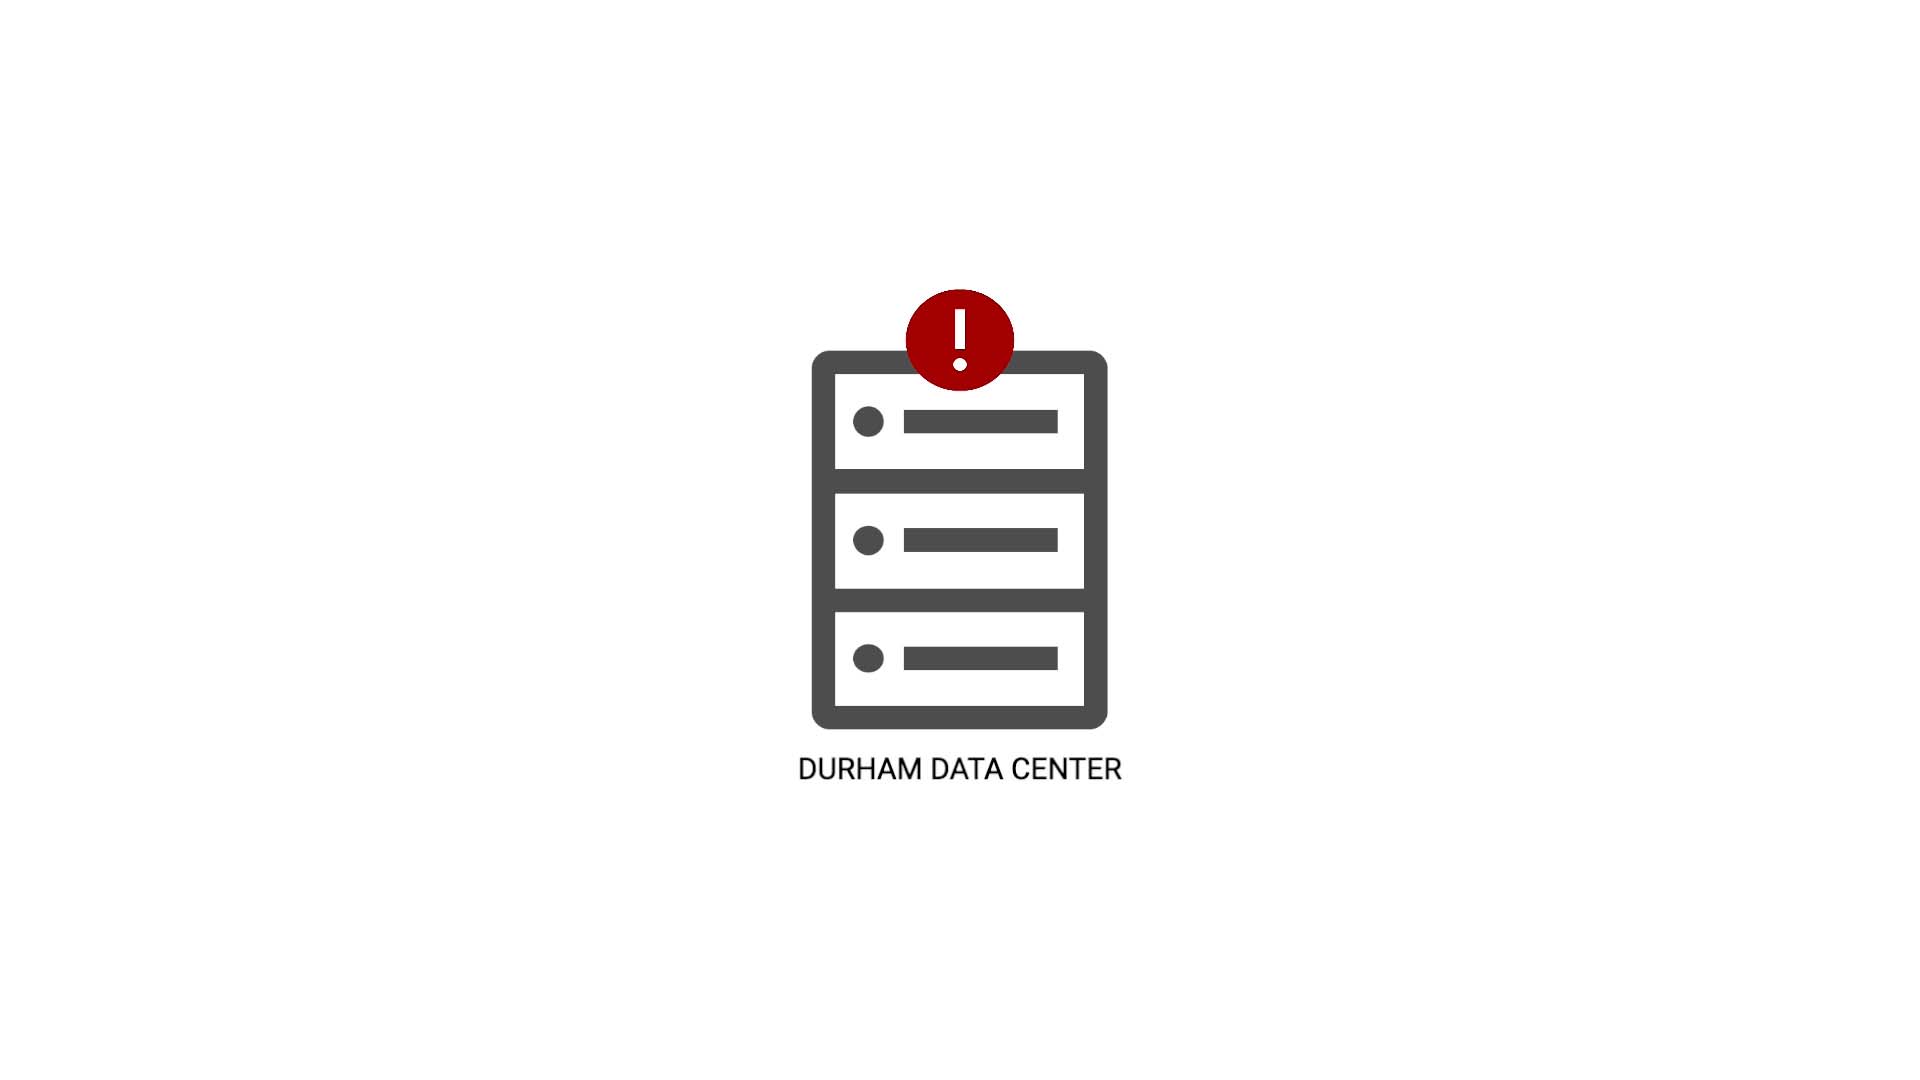
Here’s the scenario. The server in our San Francisco data center that supports a database query service has overheated and started to fail. Of course, no one knows that yet.
The first event comes in…
The event goes through enrichment to add value to the service field and gets deduplicated into an alert.
Right now, this is the first event of its kind so it simply becomes an alert, but of course if another event with the same dedupe key value arrives, it will be deduplicated into this alert.
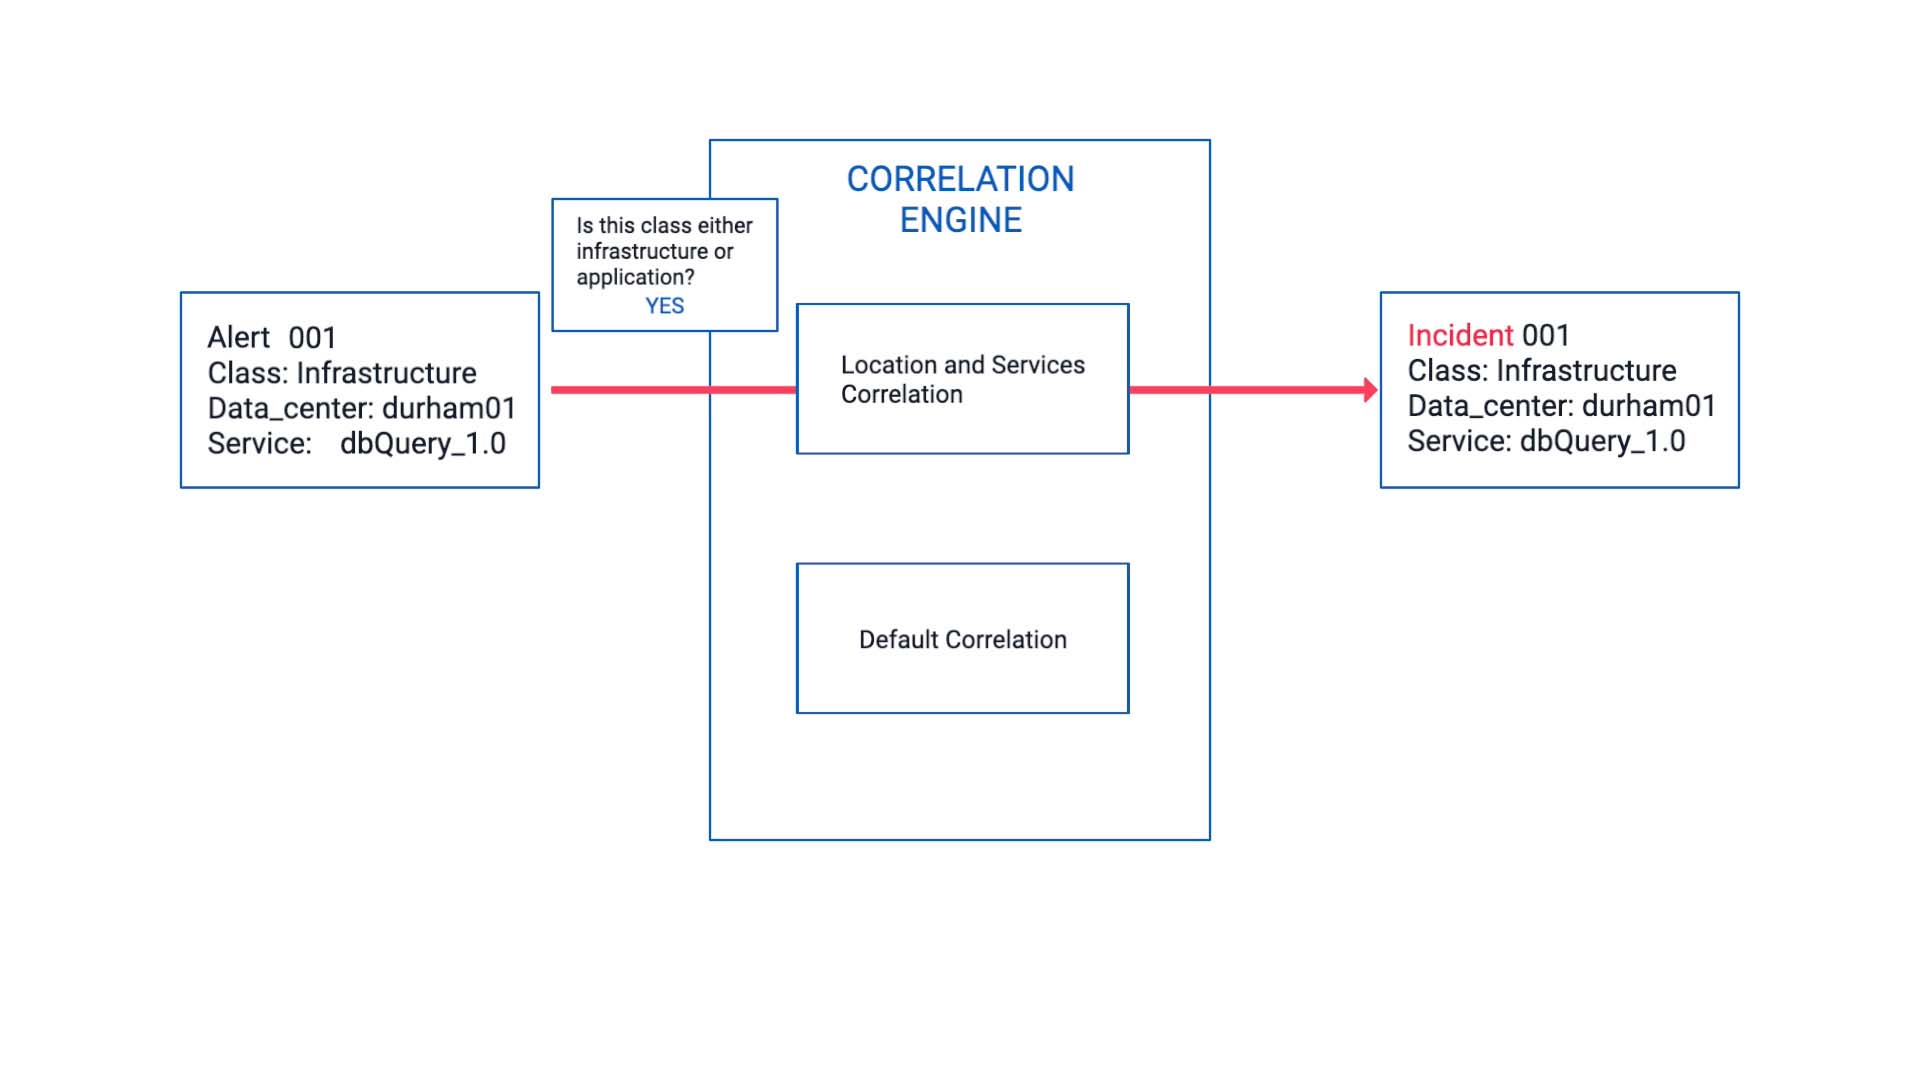
Now it arrives at the correlation engine.
The class field value meets the scope, so it enters the correlation we just configured.
Since this is the very first one, it becomes an incident on its own.
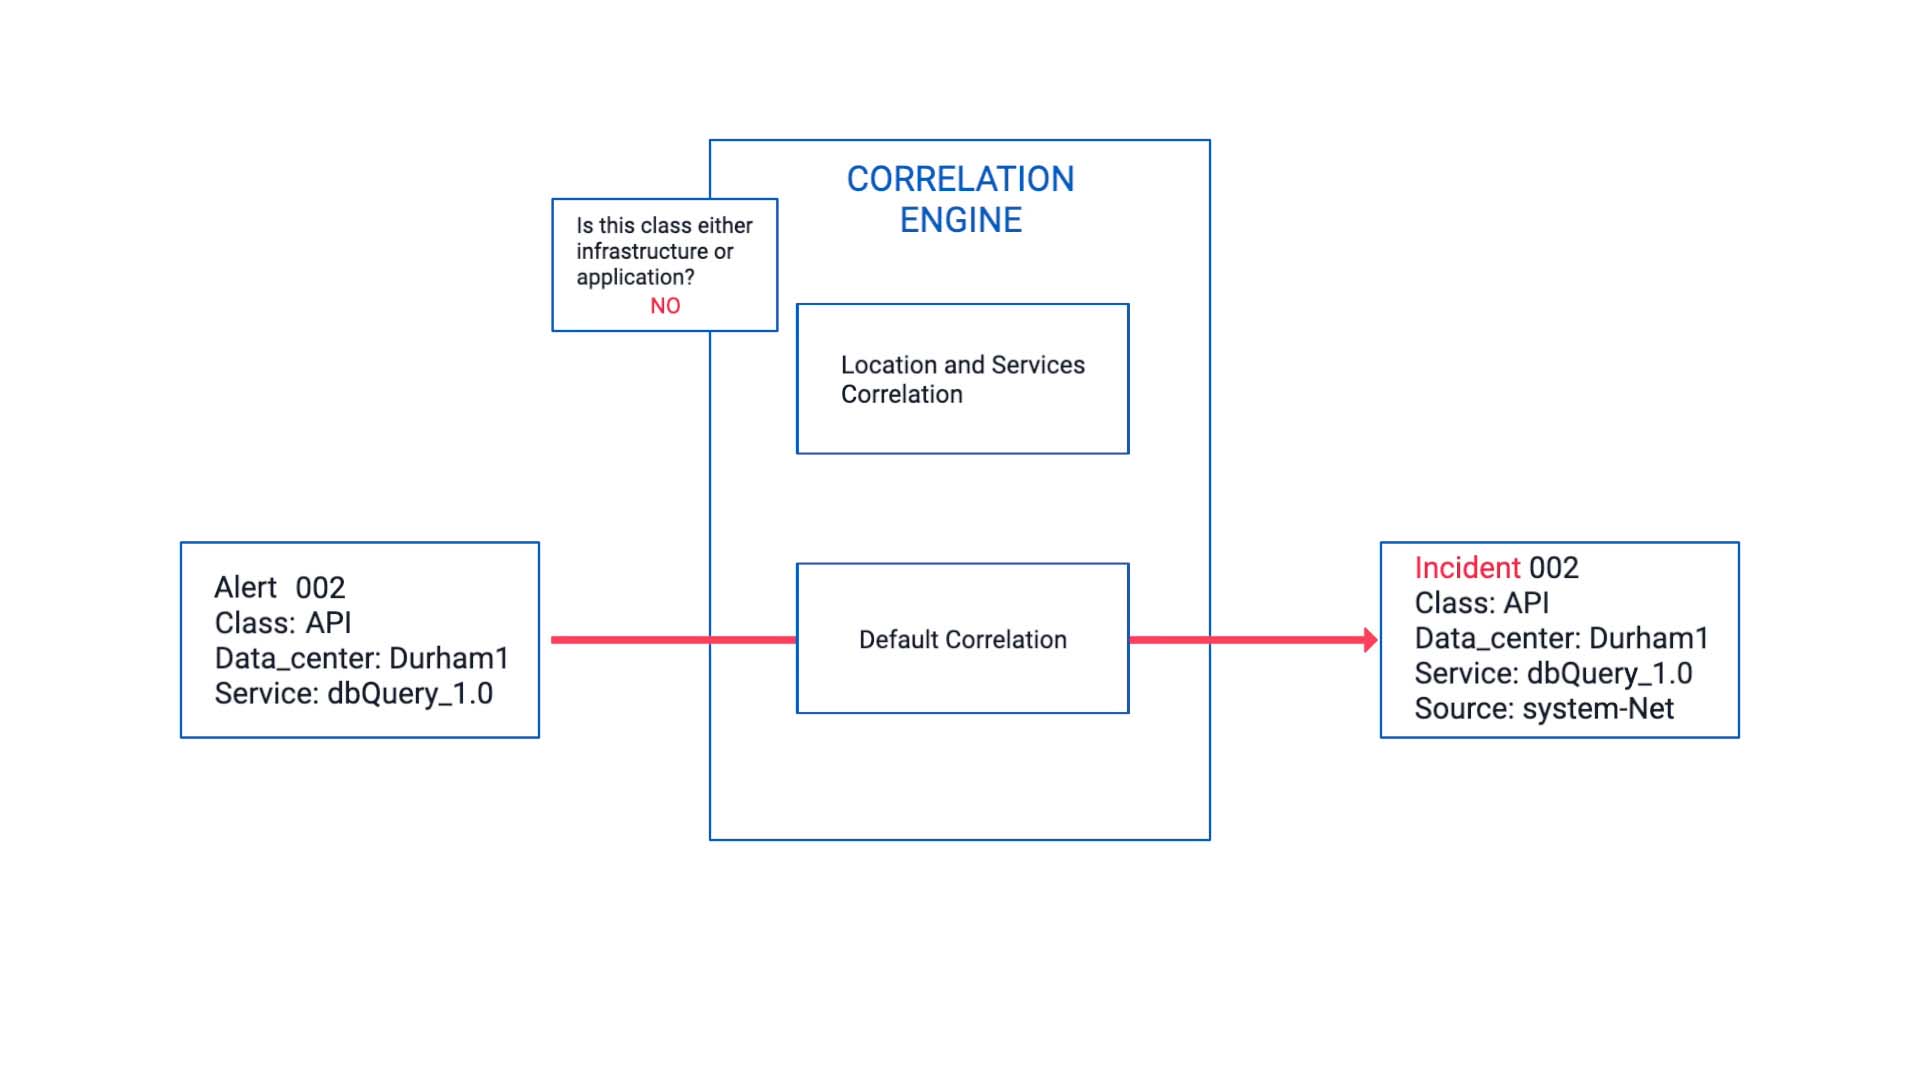
The next event arrives.
It is also impacting the same service as the last event but note that its class value is not Infrastructure or Application.
So, it is filtered by the correlation we set up. Instead, it goes into the default correlation and becomes a new and separate incident.
Here comes another event. It’s enriched, deduplicated, and...
Now, this meets the correlation criteria we’ve defined, so this alert is bundled together with the first alert and becomes part of the incident 001.
Since we set the data center match percentage to 70 rather than 100%, it accommodates the difference in capitalization.
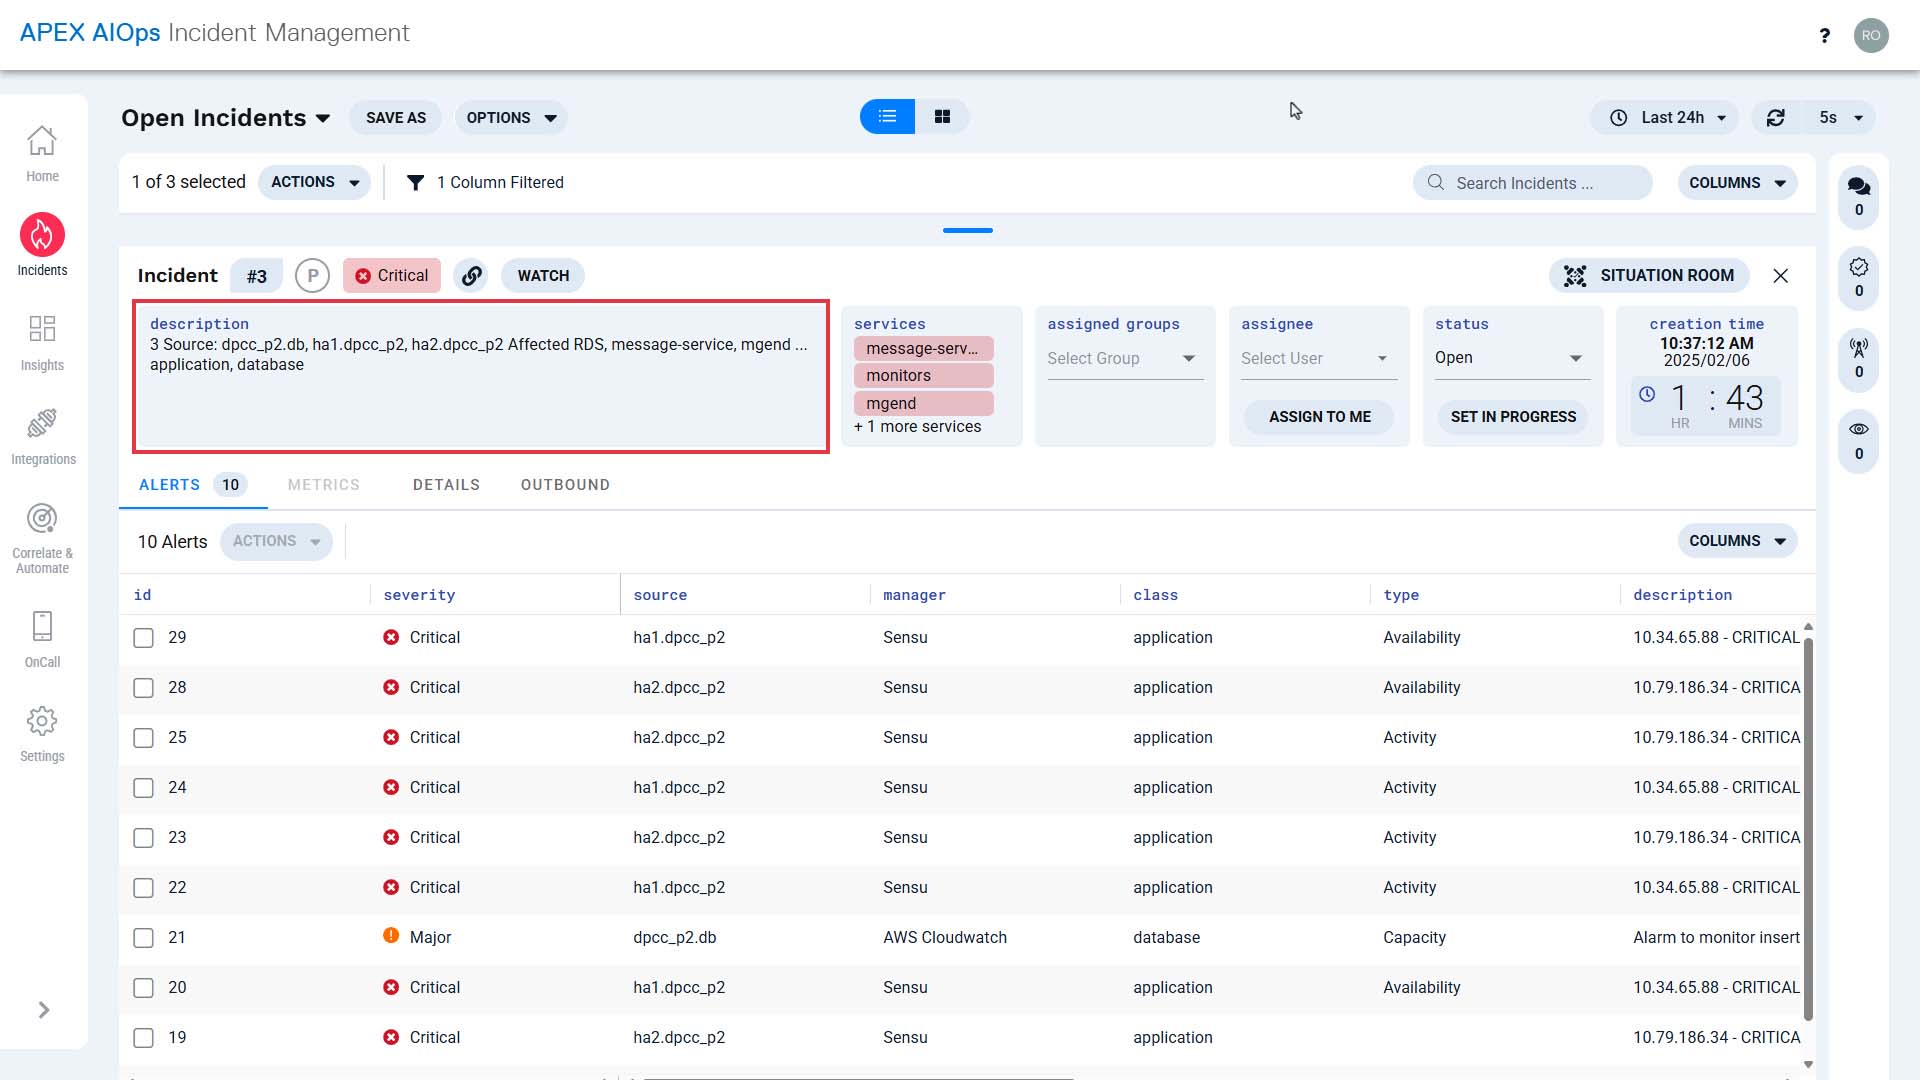
Now, this incident contains an infrastructure alert and an application alert on the same service in one place, and the applicable infrastructure team and the application team have been notified.
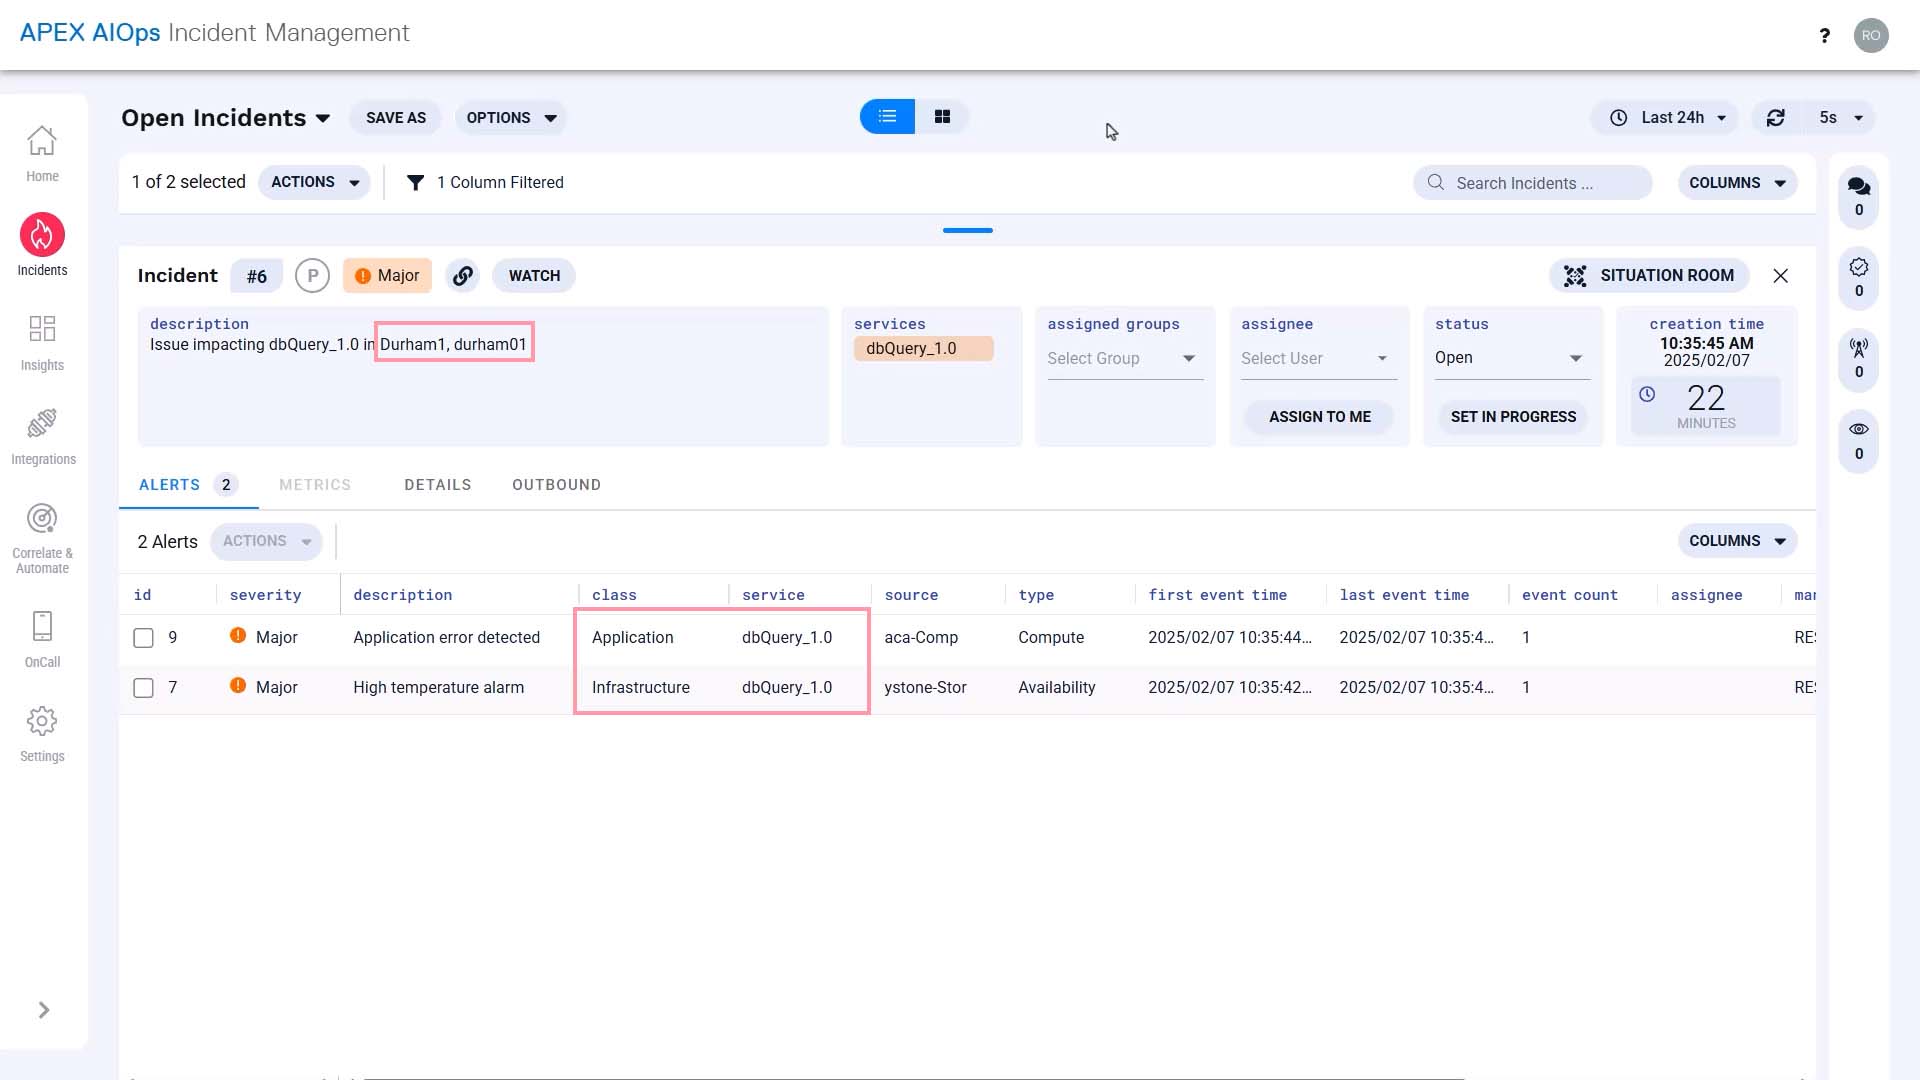
Looking at the timeline together, they quickly identified the issue originated in the hardware.
Without this incident correlating the two alerts together, the application team would not have been able to rule out other potential causes.
Now you know how Incident Management correlates alerts. thanks for watching