Step 3: Check alert correlation
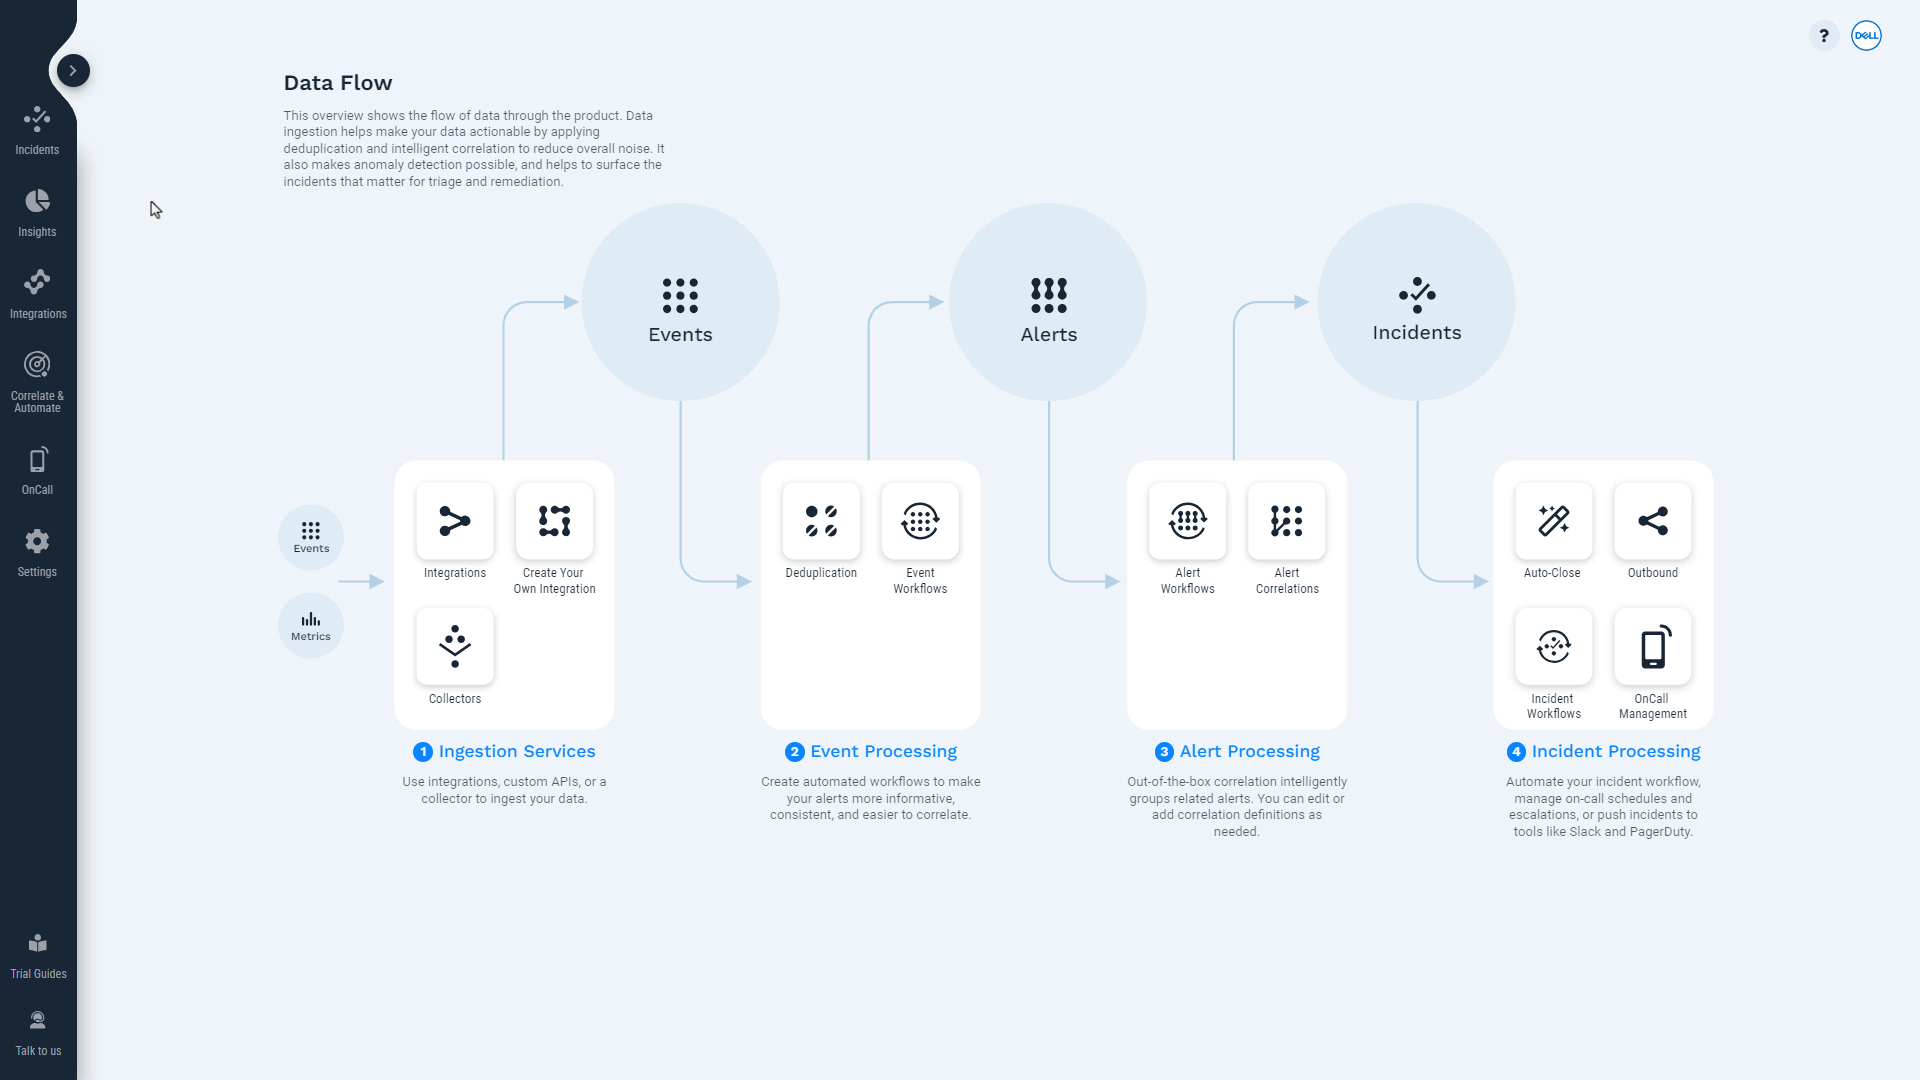
The Correlation Engine groups alerts by their relatedness, and creates incidents. It works out of the box, although you can fine tune it by adjusting the settings, and set up multiple correlation engines to process different types of data. The default correlation engine groups alerts from the same or similar sources. Let's see how well the default settings are working for you.
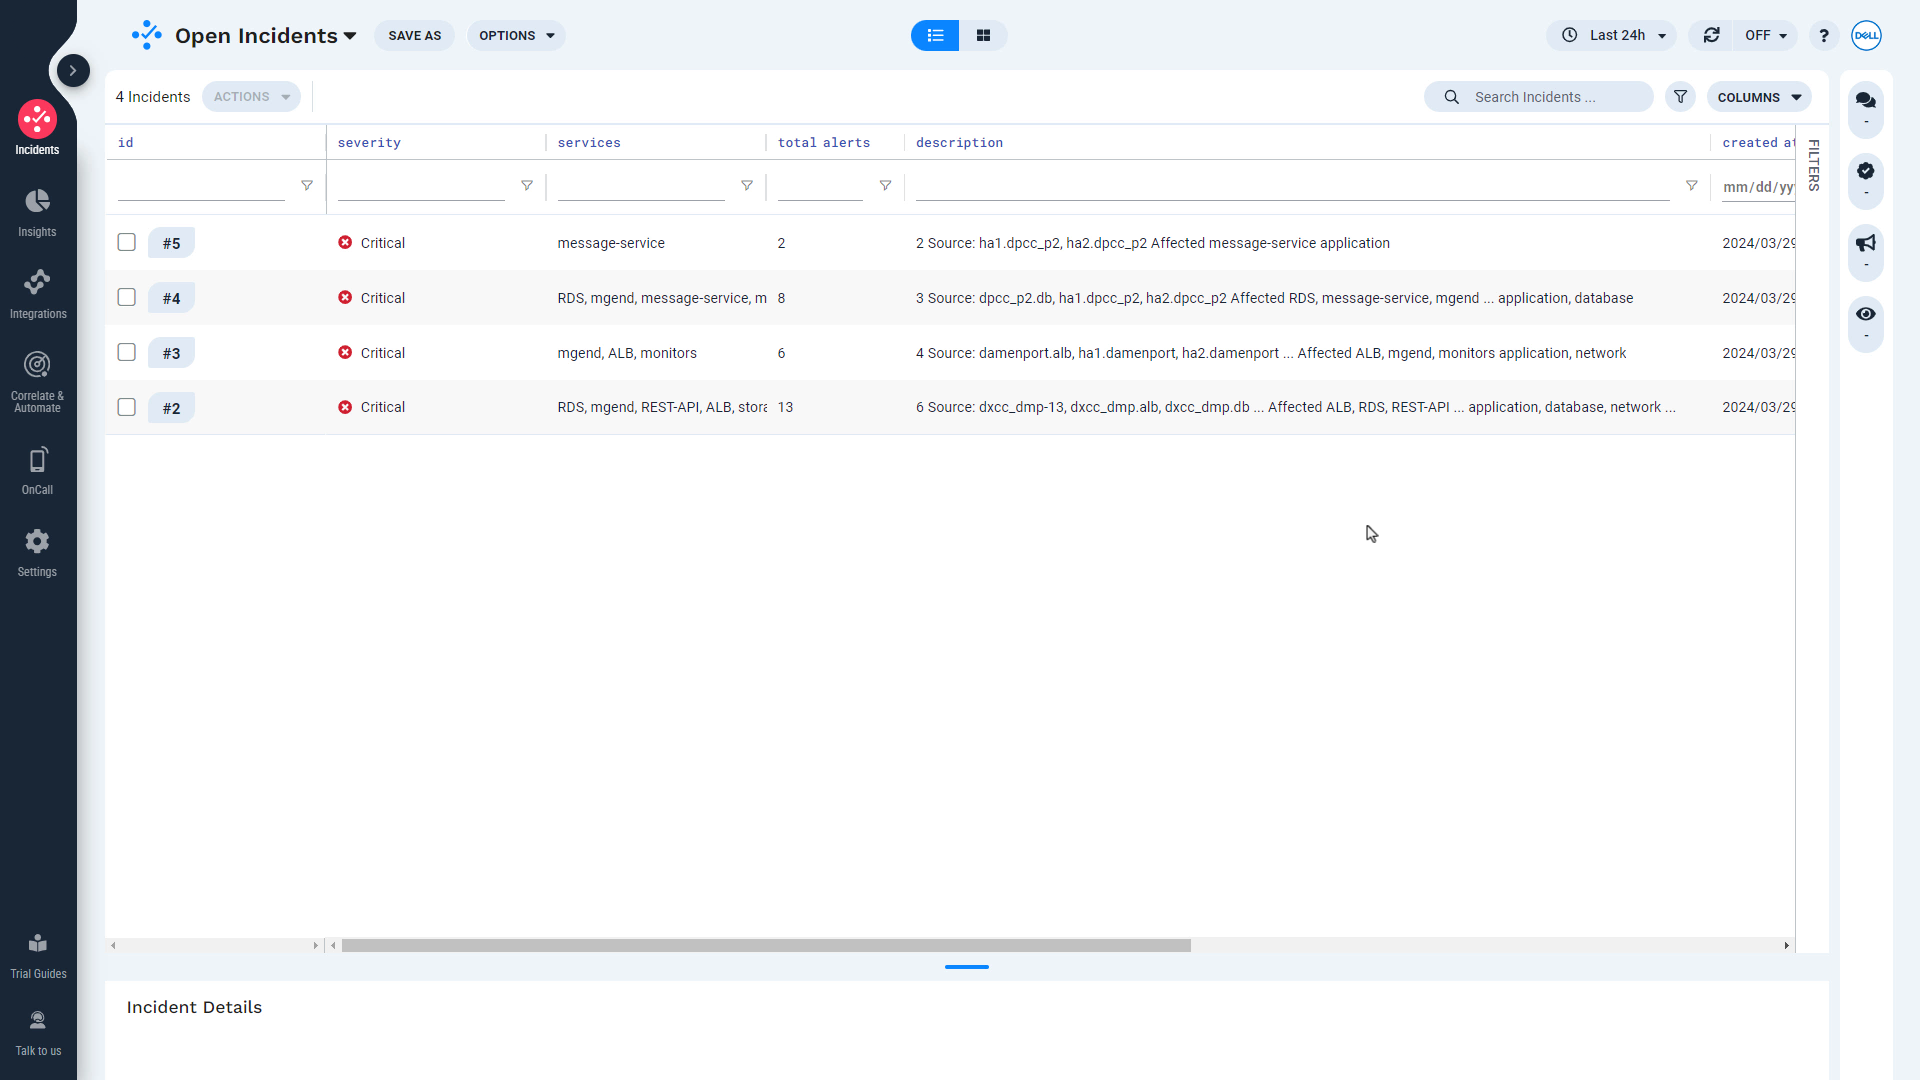
Navigate to Incidents > Incidents.


Examine the Total Alerts column and click on an incident. Choose an incident with more than one alert, if there is one.
Click on the Alerts tab in the Incident Details pane.


Examine the alerts included in the incident and confirm they are indeed related.
Troubleshooting tips
Issue | Possible Solution |
|---|---|
I don't see any incidents. | Go to Incidents > Alerts and verify that you have alert data. (If you ingested only metrics, you may need more time for APEX AIOps Incident Management to identify anomalies.) If you have alert data, go to Correlate & Automate > Correlation Engine and verify that there is a correlation engine enabled. Check the settings for scope filter and fields to correlate to verify that they are appropriate for your data. |
I need additional help. | Contact the APEX AIOps team. |
Next steps
Move on to the System Configuration section to fine tune your monitoring settings.