Step 1: Ingest data
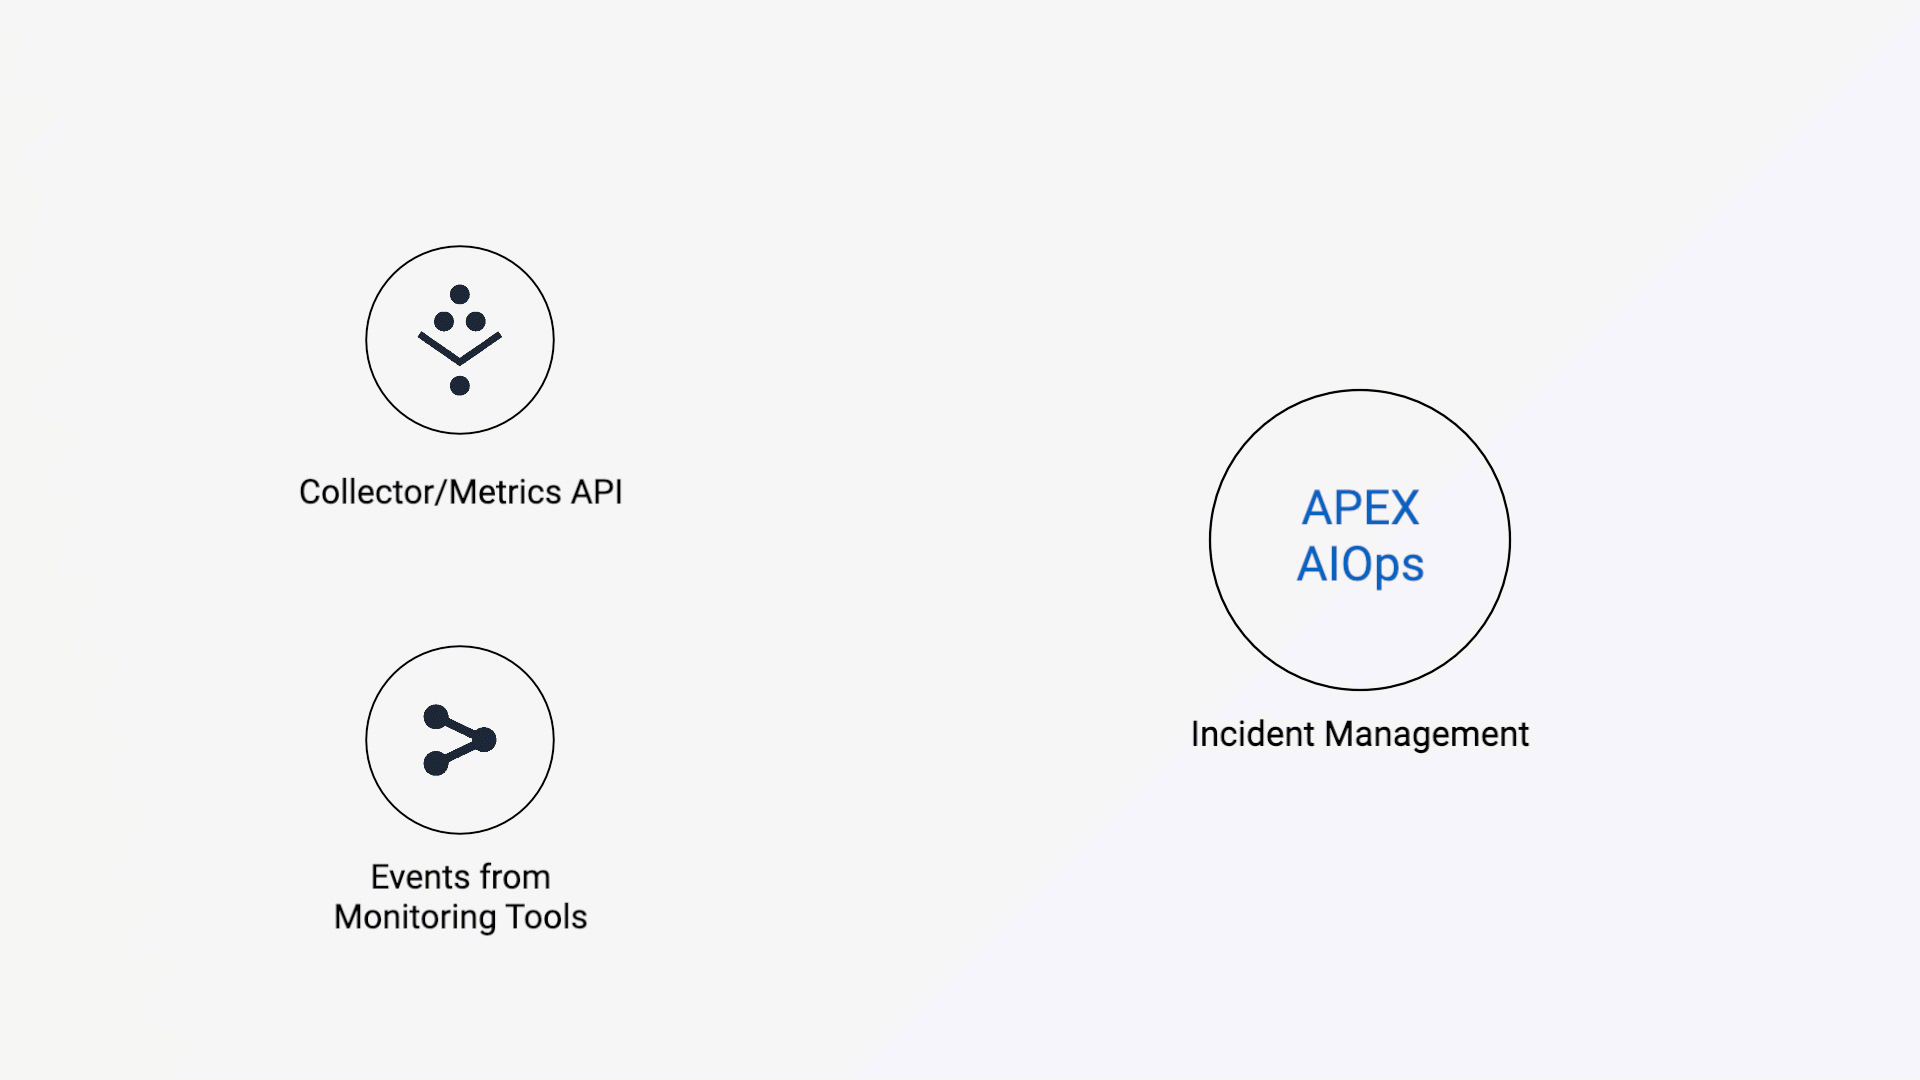

The first step is enabling communication between one or more of systems and APEX AIOps Incident Management so that your data is visible. Incident Management can ingest event logs and time-series metric data. You have the following three different ways to get data into Incident Management: by installing collector agents, by configuring application-specific integrations, or by setting up your own integrations using Incident Management APIs.
Option 1: Install collectors that receive data from target systems
Installing a collector is the quickest way to send data to Incident Management. Collectors are available for a variety of systems. They reside on your Linux, Windows, or MacOS systems and gather performance and health metrics, identifying metric anomalies at the source and sending metrics and anomaly-based events to Incident Management.
Option 2: Establish inbound integrations with target systems
Incident Management also includes many application-specific integrations for ingesting data from other monitoring systems. These integrations operate via webhooks or cloud-to-cloud connections. Follow these instructions to configure specific integrations:
NOTE: Setting up an inbound integration may take some time to produce data in Incident Management. Setting up a collector is the fastest way to view data.
Option 3: Set up custom integrations
You can use the Metrics and Events APIs to ingest data in JSON format that you have mapped to Incident Management fields. The Incident Management events and metrics schemas are flexible, with a small number of required fields and a large number of optional fields. The schemas include a tags field for additional information.
Finally, you can use the Create your own Integration feature to map events to Incident Management using a graphical user interface. The CYOI feature generates a custom API endpoint for your events, and walks you through the process of inspecting your data, mapping its fields to Incident Management event fields, customizing the deduplication key, and testing the results.
Ingest data using Create your own integration (CYOI).
Checklist
Verify the following:
You have picked one of the three options from above and completed the data integration configuration.
Alerts appear on the Alerts UI (Where do I see this?).
Troubleshooting tips
Issue | Possible solution |
|---|---|
I don't see any alerts. | Check that your integration is configured correctly. Did you only ingest metrics? If so you may need more time for Incident Management to identify anomalies. |
I need additional help. |