Grafana Dashboards
You can view Moogsoft Onprem statistics and reports in dashboards using Grafana.
To set this up, you need to install Grafana, install the Moogsoft AIOps plugin and install the Grafana integration in Moogsoft Onprem.
Before You Begin
Before you install the Moogsoft AIOps plugin, ensure you have met the following requirements:
You have installed Grafana or you have a hosted instance of Grafana.
Enable HTTPS if you are using an on-premises instance of Grafana. See the Grafana docs for how to edit the protocol, cert_file, and cert_key properties in the Grafana configuration .ini file.
You can use the Grafana Setup Tutorial for an example of how to install Grafana on a host running Moogsoft Onprem.
The port for Moogsoft Onprem is open and accessible from Grafana.
Install the Moogsoft AIOps App
To install the Moogsoft AIOps app in Grafana, follow these steps:
Install the app.
Find it under Apps in your Grafana plugins and enter the following settings:
Field
Value
URL
<Your Moogsoft Onprem URL>
User
Your Graze username
Password
Your Graze password
Enable the app. A "Test Success" message appears if successful.
After you have set up the app, you can configure your dashboards.
Default Dashboards
You can configure the statistics that Moogsoft Onprem collects depending on which dashboards you want to use. You can also create a custom dashboard.
Global Situation Overview
The Global Situation Overview dashboard provides a broad overview of your Situation statistics, teams insights, and mean times to acknowledge, detect and resolve.
The dashboard's panels display the number of open Situations, unassigned Situations, reassigned Situations and recurring Situations. Other panels include the top 10 teams by open Situations, the top 10 services by open Situations, the number of Situations by status, the number of Situations by severity and a graph view of MTTA, MTTD and MTTR.
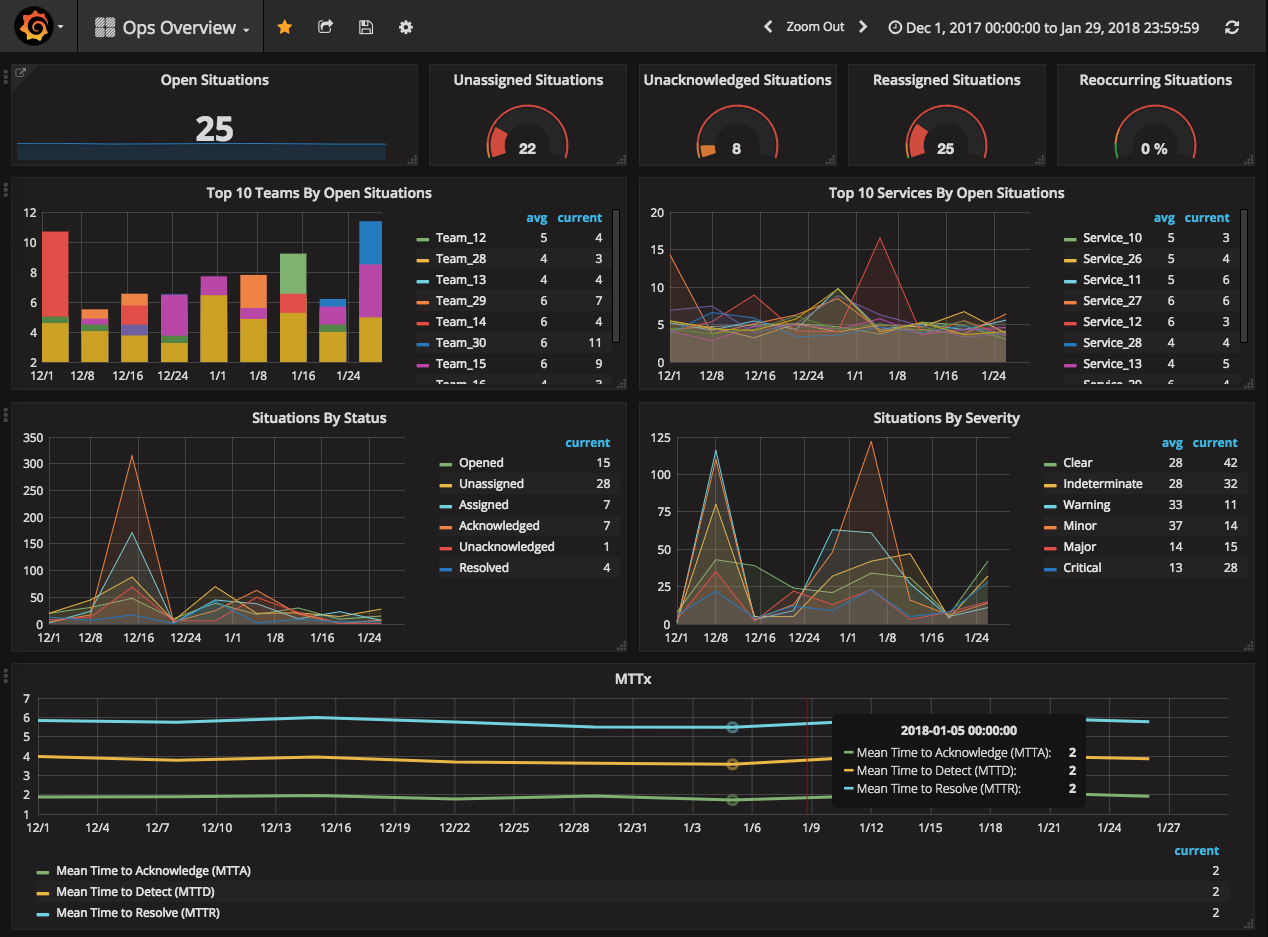
To edit the dashboard, click the header of any panel and edit the statistic endpoint or add a query. Alternatively, click Add Row at the bottom of the screen.
Team Situation Overview
The Team Situation Overview dashboard displays a broad overview of your team's Situation statistics, team insights and mean time to acknowledge and resolve.
The dashboard's panels display the number of reassigned Situations per team, the number of reoccuring Situations per team, number of Situations impacting each service per team, the number of Situations by status per team and the MTTA/MTTR for the team.
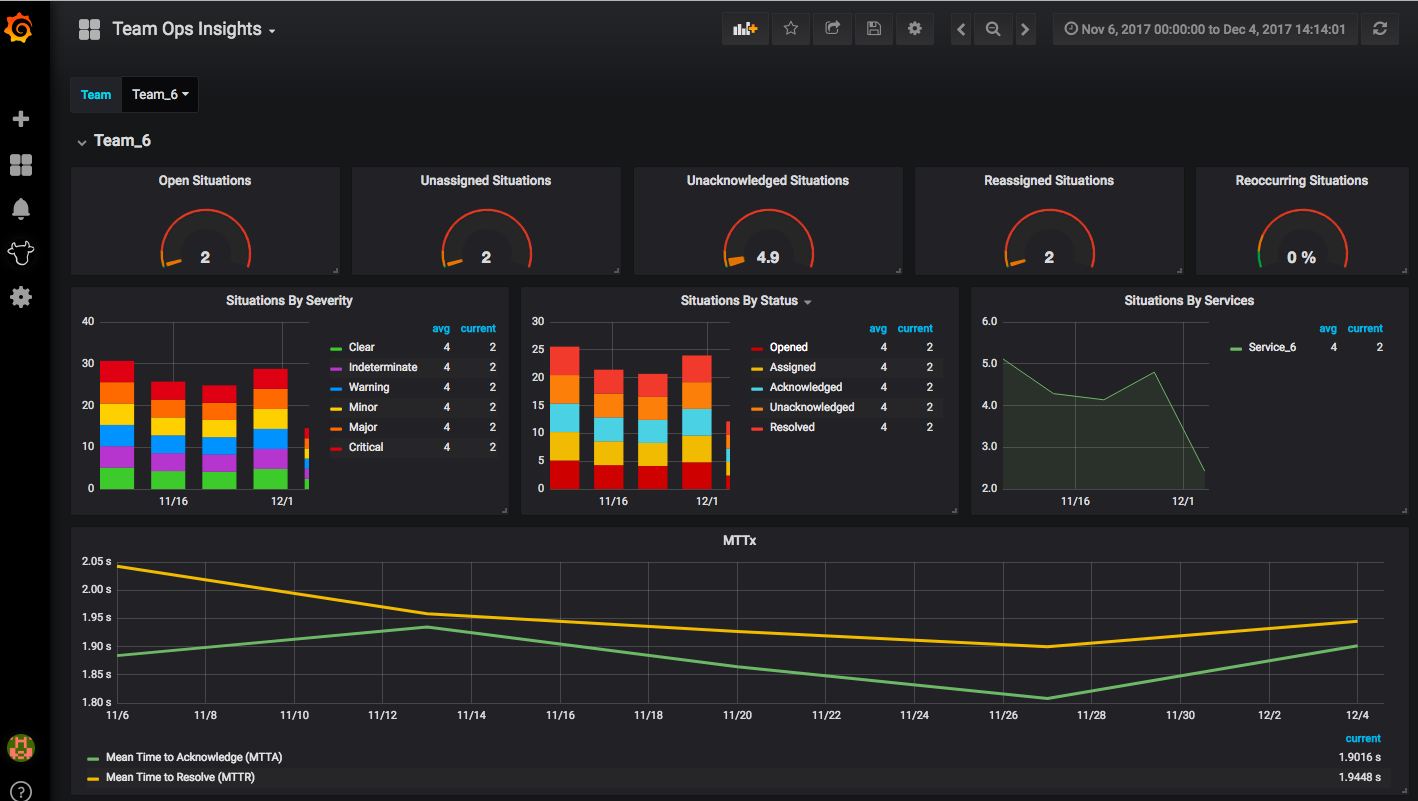
To edit the dashboard, click the header of any panel and edit the statistic endpoint or add a query. Alternatively, click Add Row at the bottom of the screen.
Team Workload Breakdown
The Team Workload dashboard provides an overview of how an individual team is performing in Moogsoft Onprem.
The dashboard's panels pull statistical data about the MTTA/MTTR per team, the status of the team's Situations, and the number of comments made by the team.
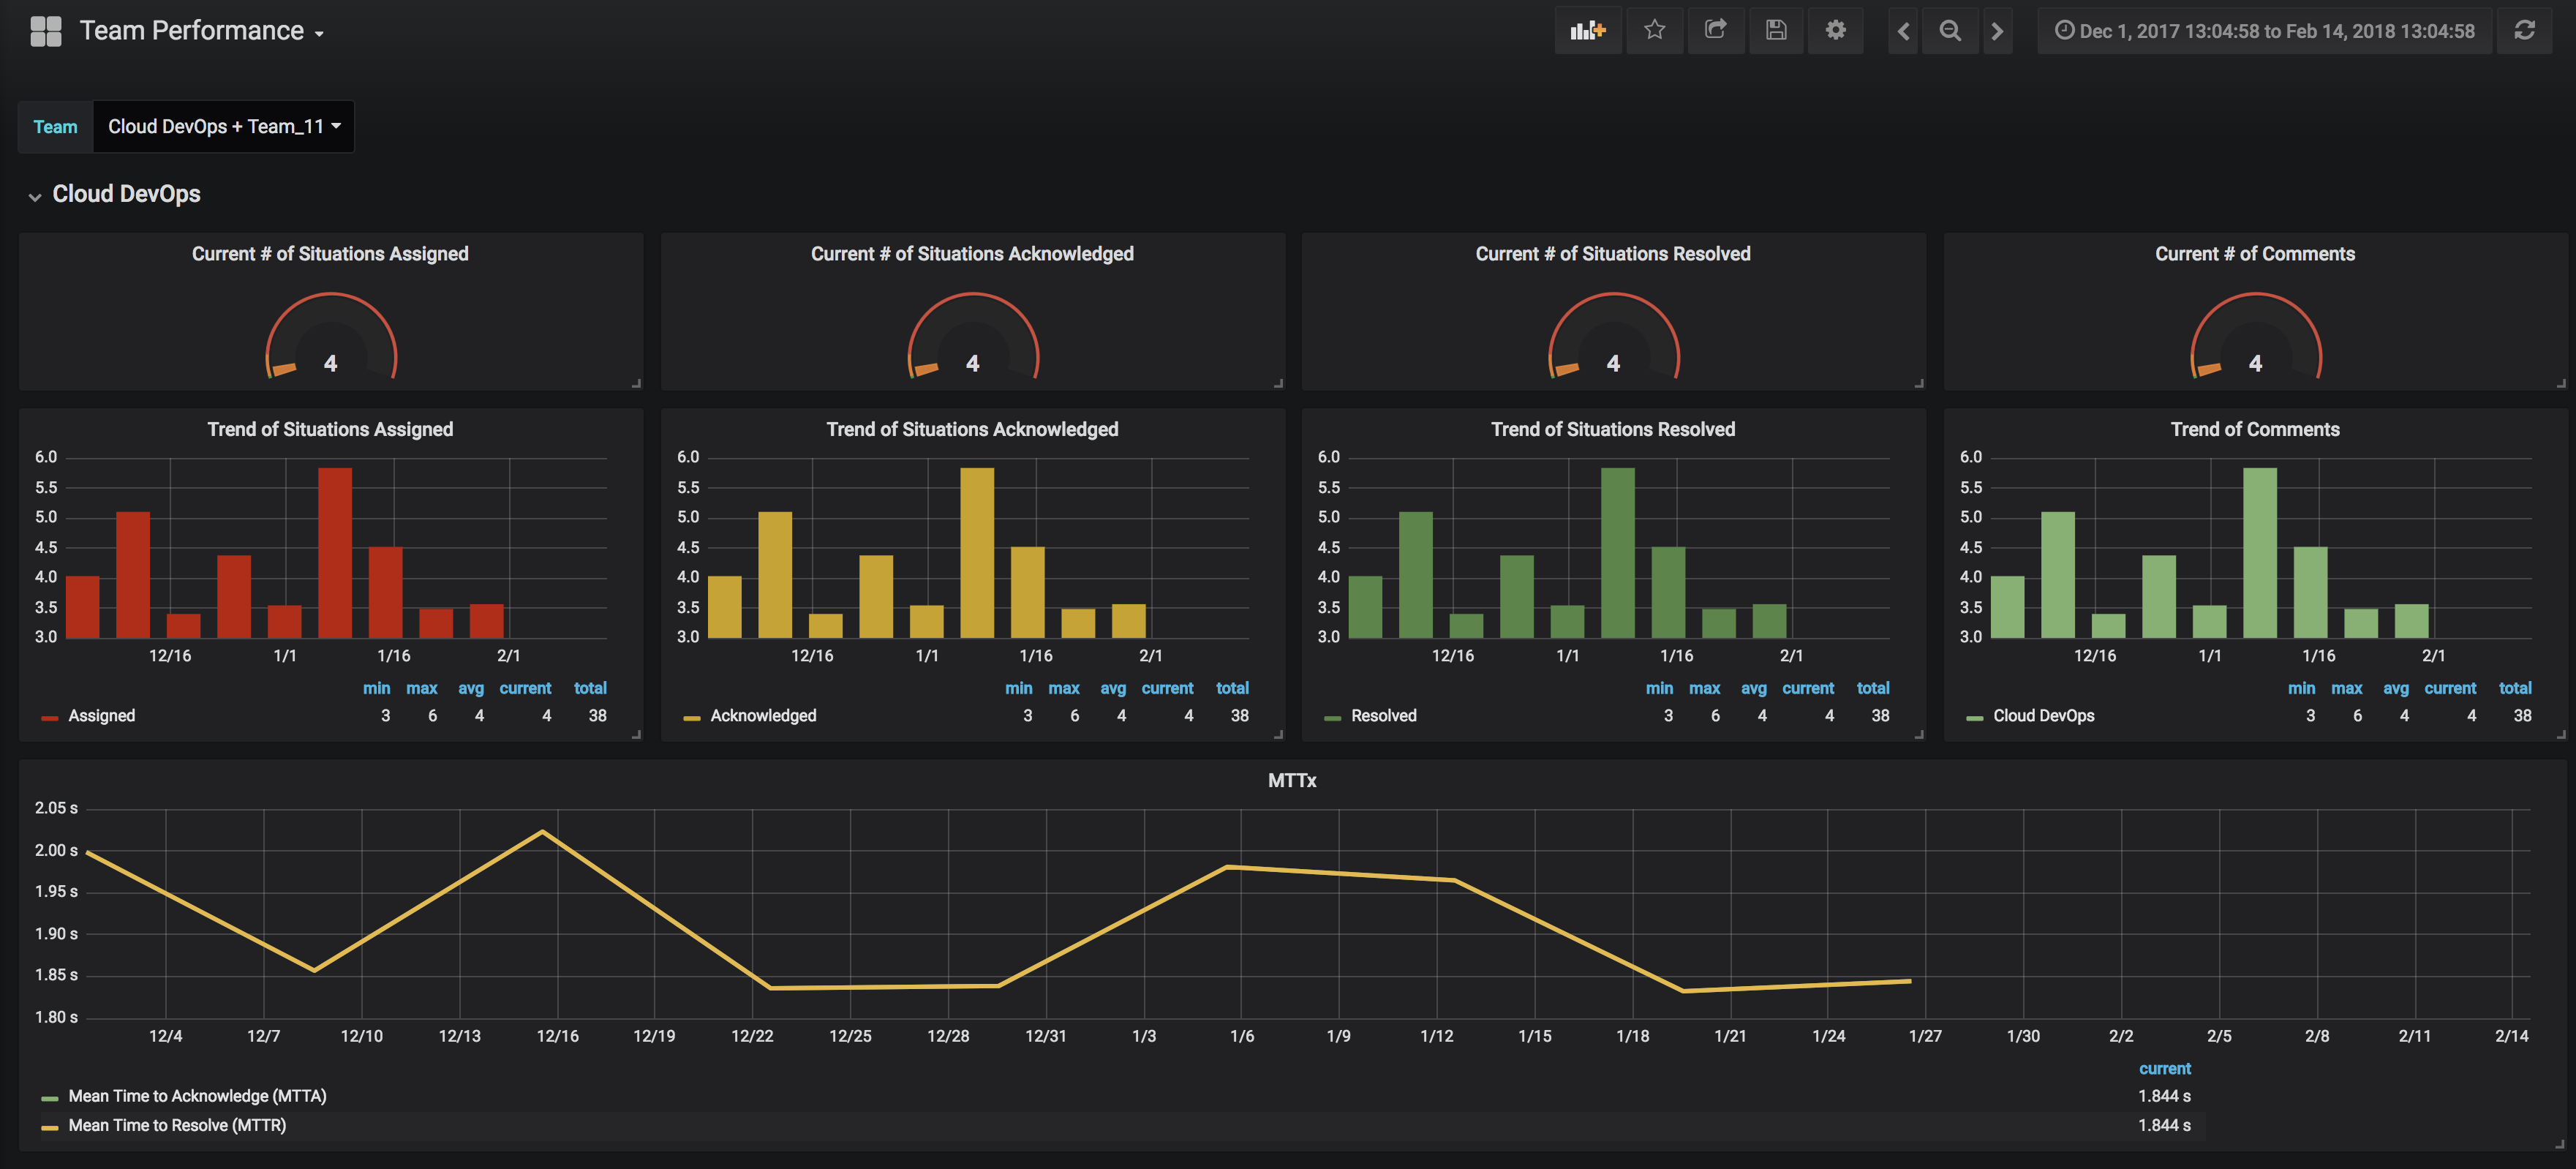
To edit the dashboard, click the header of any panel and edit the statistic endpoint or add a query. Alternatively, click Add Row at the bottom of the screen.
Noise Reduction
The Noise Reduction dashboard displays an overview of the noise reduction performance of Moogsoft Onprem.
This dashboard shows statistics including the number of accumulated events reduced into alerts and Situations over a period of time, the percentage reduction of events to alerts, the percentage reduction of alerts to Situations and the overall reduction.
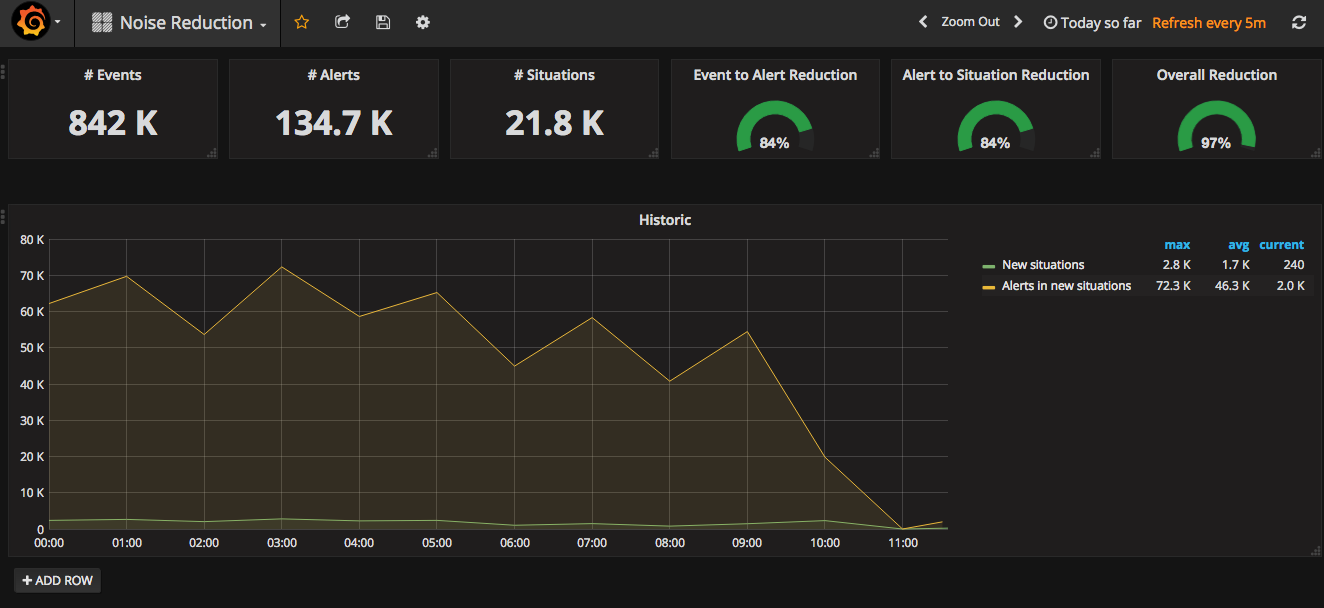
To edit the dashboard, click the header of any panel and edit the statistic endpoint or add a query. Alternatively, click Add Row at the bottom of the screen.
Individual Stats Overview
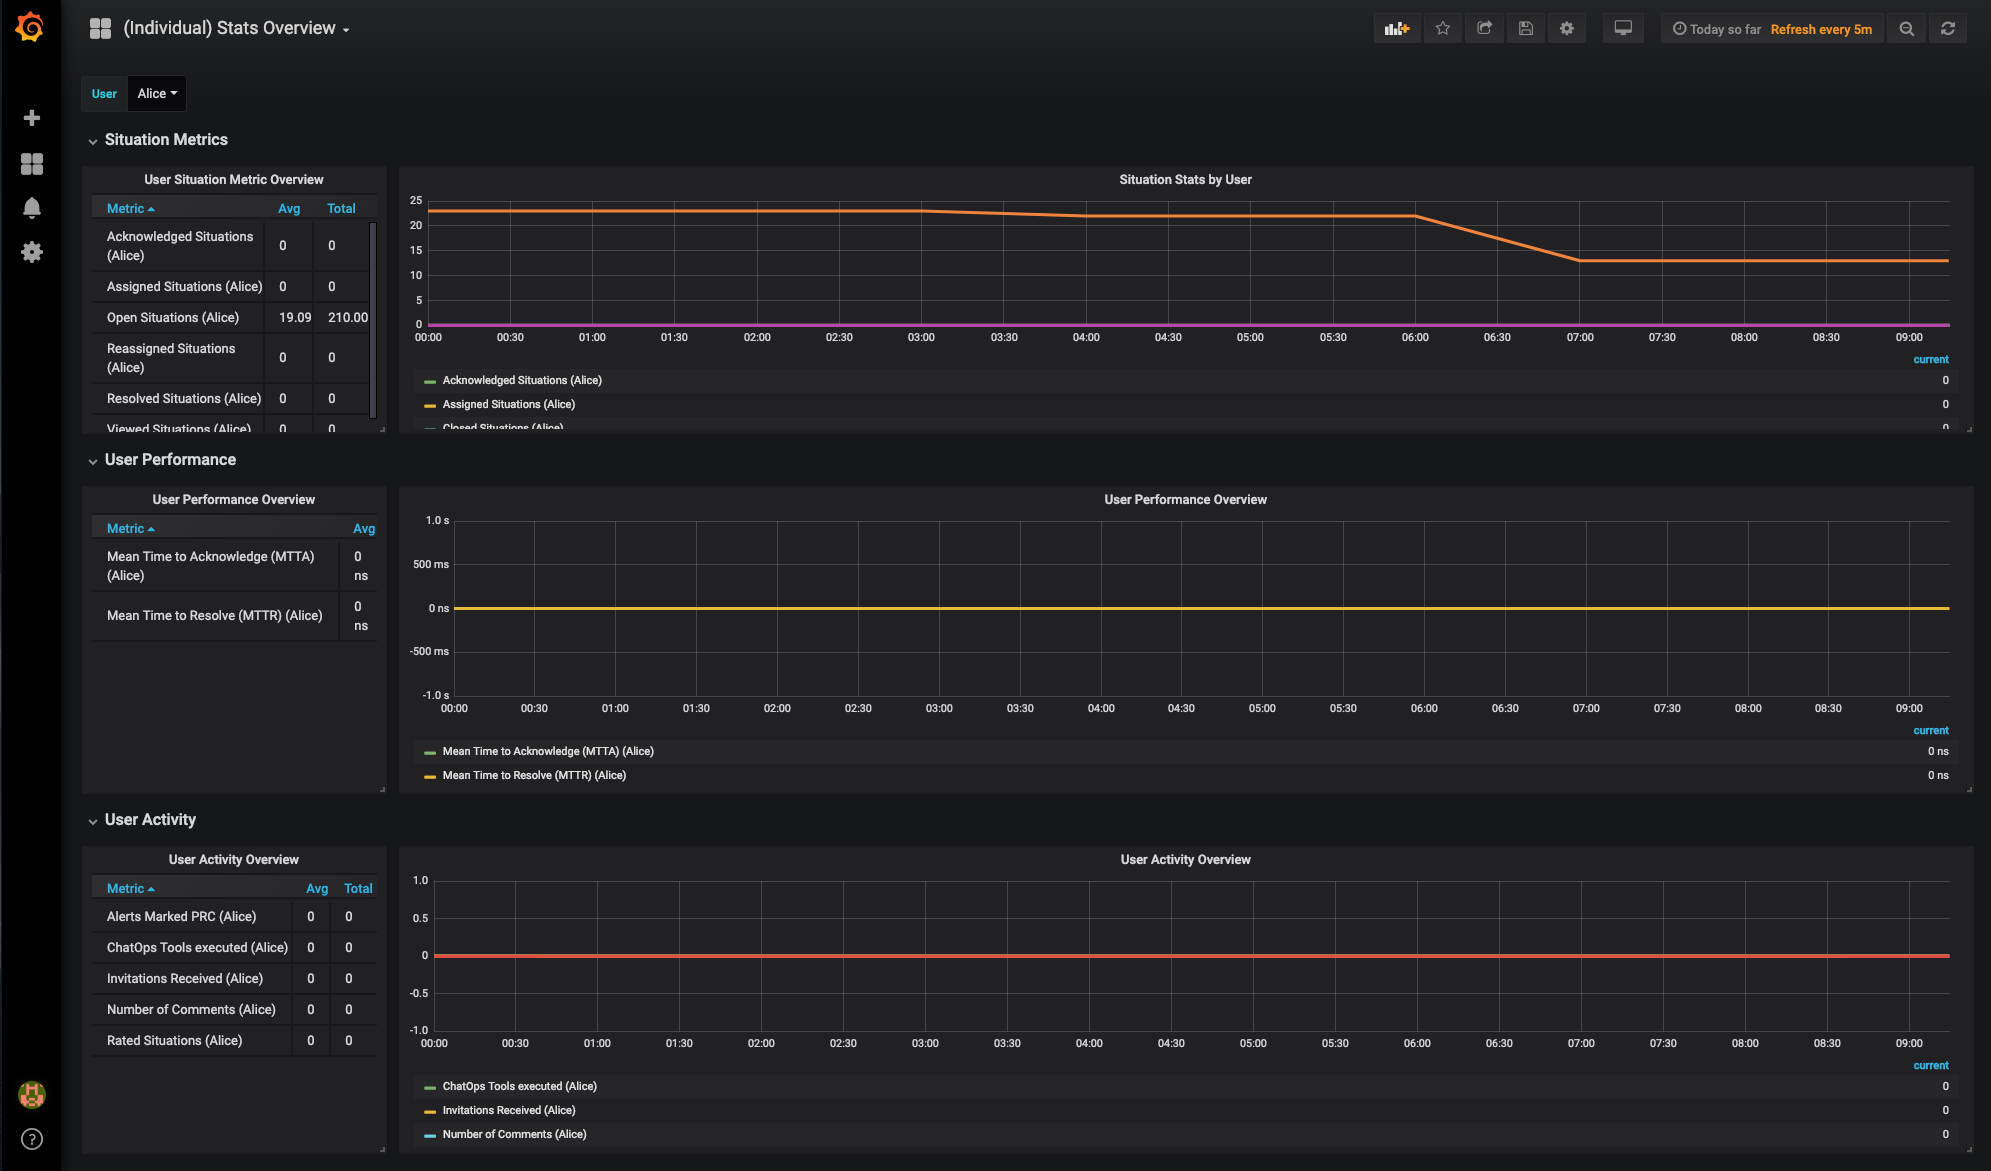
The Individual Stats Overview dashboard allows you to view and compare statistics for multiple Moogsoft Onprem users.
The dashboard includes Situation metrics, MTTA and MTTR, user activity, Situation stats by user, user performance overview and user activity overview.
By default, Moogsoft Onprem collects statistical data for this dashboard for all users with the Operator role. You can add the 'collect_insights' permission to other roles if you want to include other users in the dashboard. See Role Permissions for more information.
Individual User Deep Dive
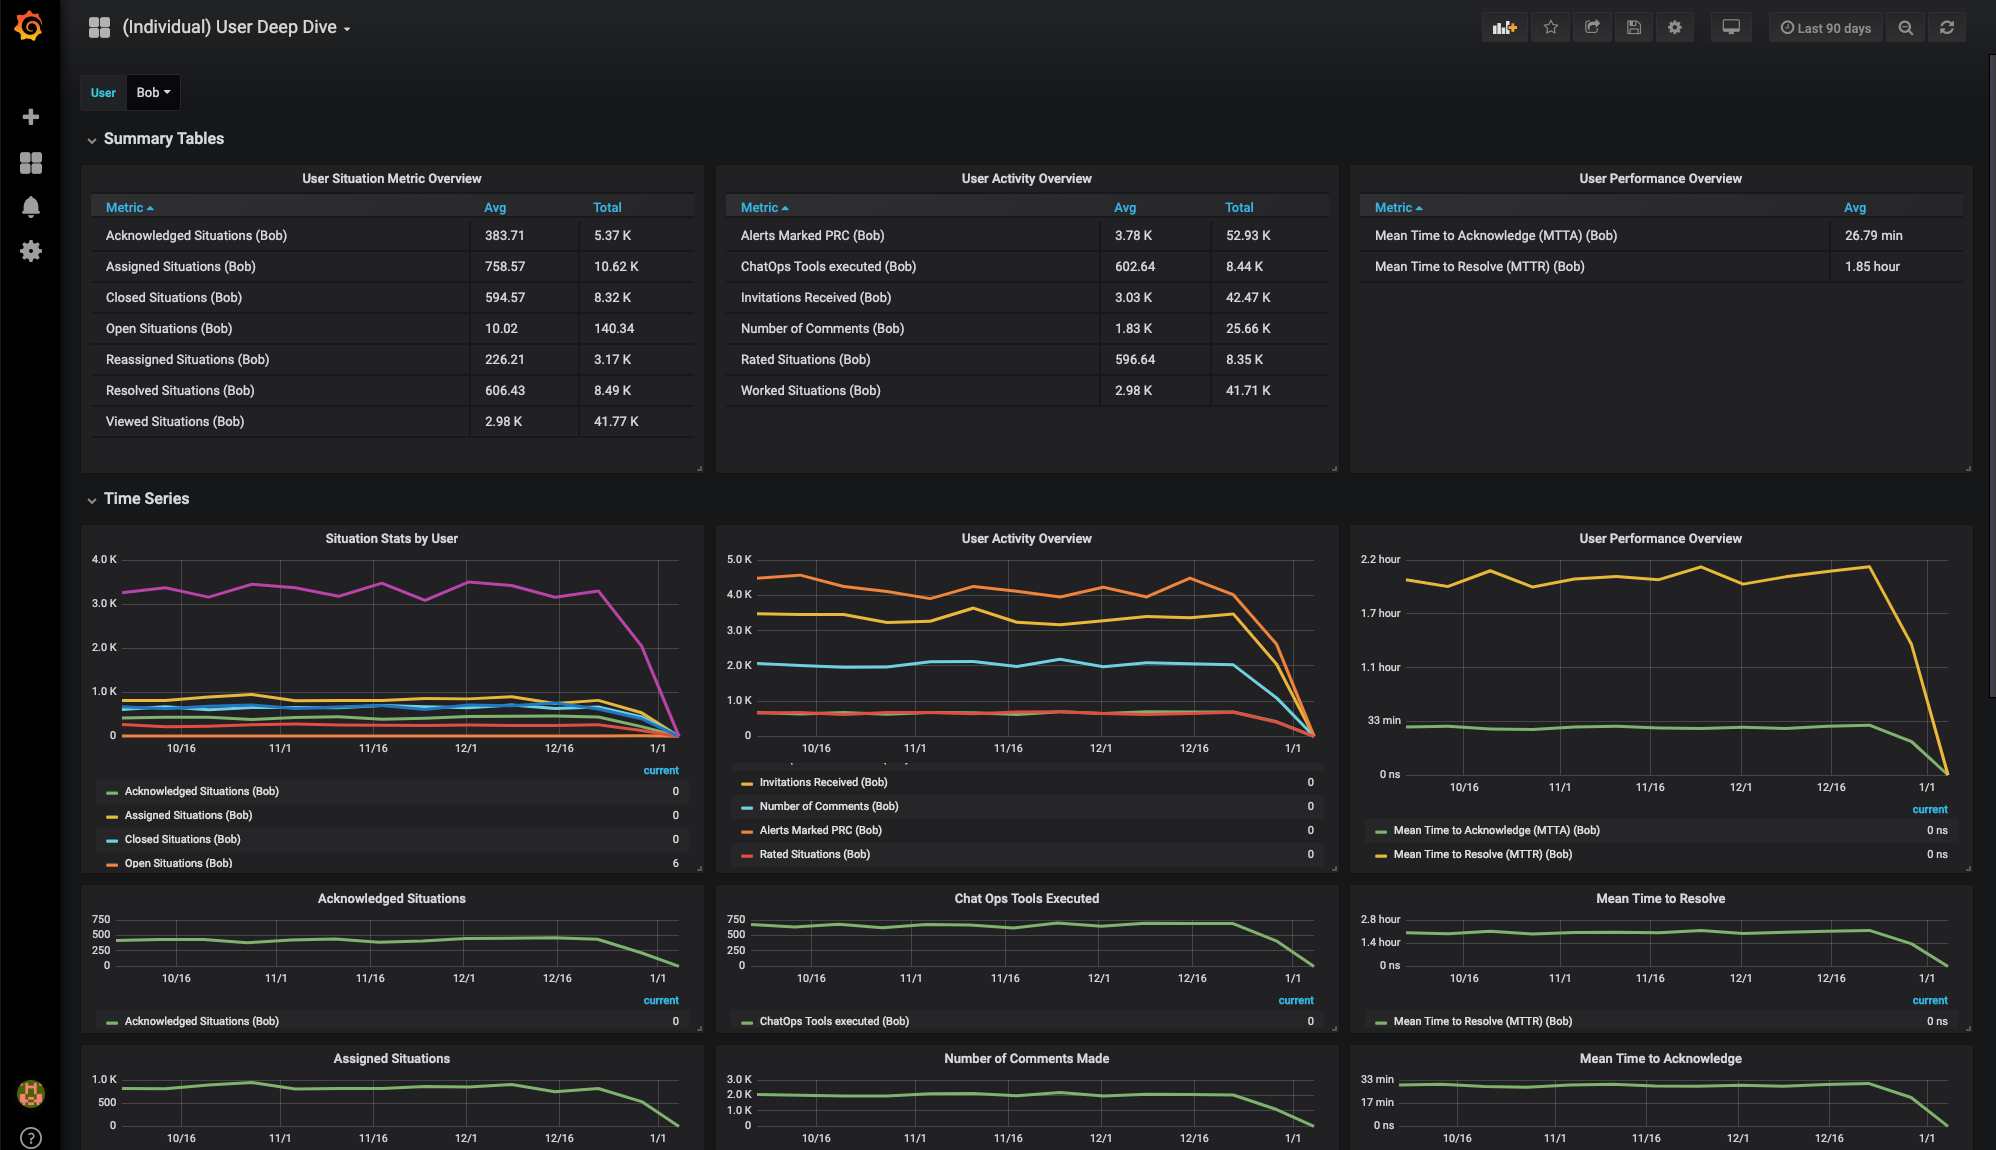
The Individual User Deep Dive dashboard provides an in-depth summary of different performance metrics for a single user.
The dashboard includes a user Situation metric overview, a user activity overview, a user performance overview, Situation stats by users, user activity overview and user performance overview. You can view a breakdown of specific statistics such as the number of Situations the user has acknowledged, assigned, closed, reassigned and how many they have open. You can also see which ChatOps tools the user has executed, the number of comments they have made, the number of invitations they have received, the number of alerts they have marked with PRC and the individual's MTTA and MTTR.
By default, Moogsoft Onprem collects statistical data for this dashboard for all users with the Operator role. You can add the 'collect_insights' permission to other roles if you want to include other users in the dashboard. See Role Permissions for more information.
Create a Custom Dashboard
You can add and configure custom dashboards to display different Moogsoft Onprem statistics in Grafana. For more information see the Grafana documentation. To create a dashboard, follow these steps:
Log in to your Grafana instance.
Click + and Dashboard.
Configure the dashboard to meet your requirements. For more information on the available API endpoints and statistics see the Stats API.
Once created, statistics from Moogsoft Onprem appear in the dashboard.