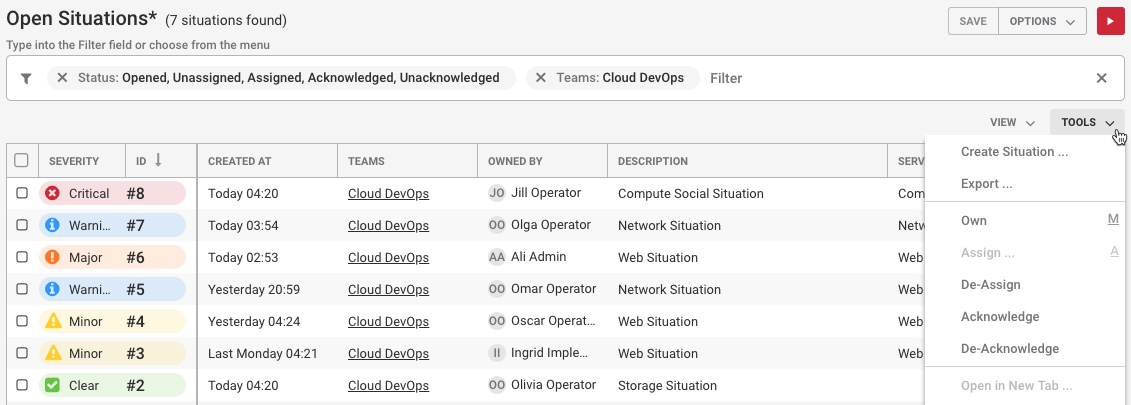
Situations Overview
You can view Situations in filterable lists in the Side Menu, the Search bar, and by looking at which Situations are impacting Services.
My Situations and Open Situations views
You may receive Notifications about Situation assignments if notifications are enabled for assignments.
The Open Situations view displays all open Situations that are currently unresolved.
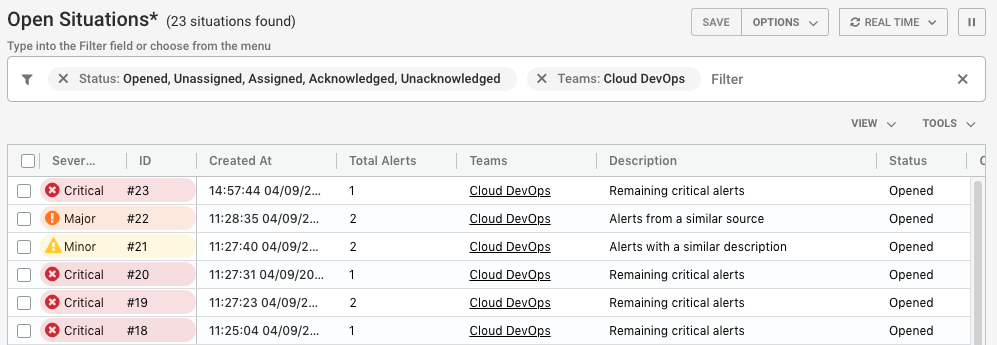
The My Situations view displays Situations that are assigned to you.

You can find out more about each Situation and open its Situation Room by clicking the colored pill containing the Situation ID. For more information see Situation Rooms and Work with Situations.
Select refresh rate
You can choose how frequently you want your Situations View to refresh. Click Real Time and select one of the following frequencies in the drop-down list. The refresh rate displays. Moogsoft Enterprise remembers the refresh rate that you selected when you log in again.
Pause alerts and Situations
Configure My Situations or Open Situations view
Use the View menu to show Situation row striping or to select which columns are shown:
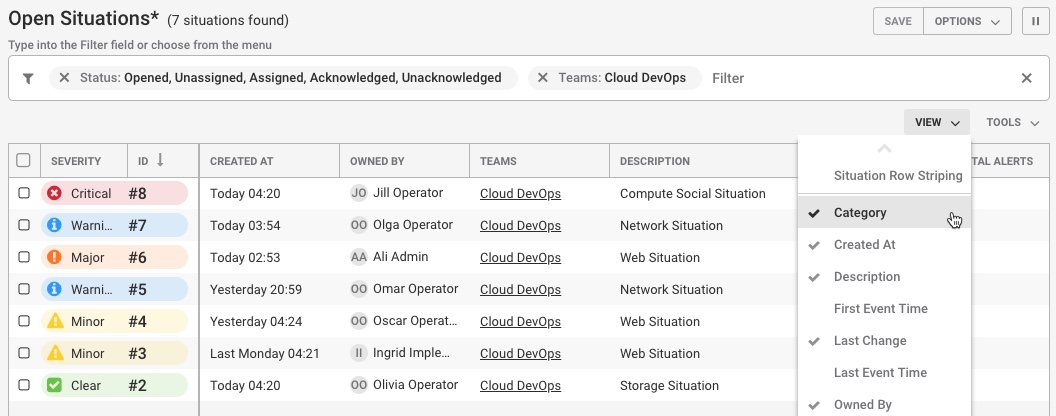
Select Situation View Striping to show rows in the color of their severity:

Configure which Situation columns are displayed by clicking to select them in the View menu. Available columns include:
Column | Description |
Category | Indicates the type and state of the Situation. Categories include: Closed, Created, Detected, Priority, Spam and Superseded. |
Created At | Time and date when the Situation was created. |
Description | Text description of the Situation. |
First Event | Time and date when the first Event was recorded. |
Last Change | Time that the Alert was last updated in the Moogsoft Enterprise UI. |
Last Event | Time and date when the last Event was recorded. |
Owned By | Situation owner's username. |
Participants | Number of Users participating in the Situation Rooms. |
Process Impacted | All processes associated with the Situation that have been impacted. |
Queue | Queue number the Situation belongs to. |
Rating | Rating given to the Situation. |
Scope | Scope of the different source groups affected by the Situation (End-User, All, Network, Applications, Database, Storage, Desktop, Cloud, Other). |
Scope Trend | Indicates whether the scope is increasing or decreasing/staying the same. |
Service Impacted | All services associated with the Situation that have been impacted. |
Sev Trend | Indicates if the severity is becoming more or less severe. |
Status | The Situation's current status: Opened, Closed, Resolved, Assigned, Acknowledged etc. |
Story | Story ID number that matches the Situation ID number at the top of the Merge tree. |
Teams | Teams that the Situation are associated with. |
Total Alerts | Total number of Alerts associated with the Situation. |
User Comments | Number of user comments about the Situation. |
Select a Situation
You can click the checkboxes in the far left column to select each Situation individually:
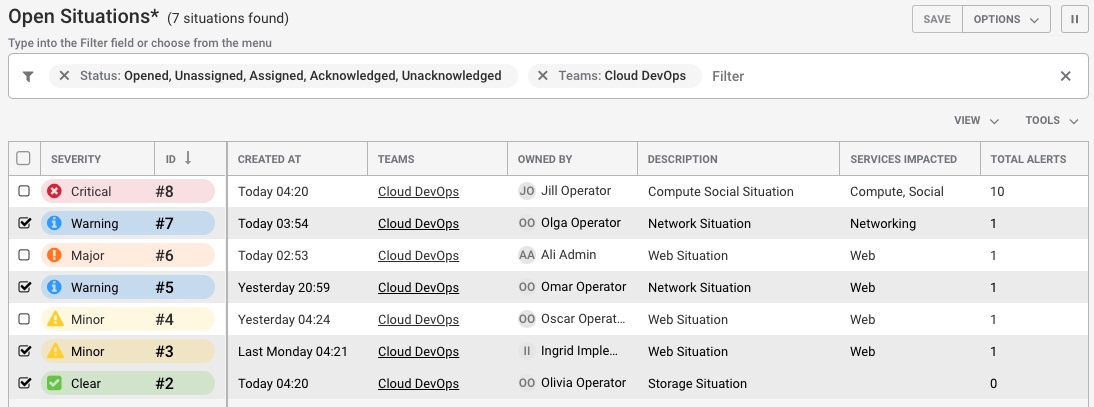
To select multiple Situations at once, hold down Shift and then click the checkboxes of the Situations you want to select. If you select one Situation using this method and then click another Situation further down the list, all Situations between the two are selected.
Another method is to left-click and drag down to highlight the Situations you want to select and then right-click to select them and open the Tools Menu (also known as the Right-Click menu).
Click the Select All checkbox in the top left corner to select all Situations. If the checkbox is grayed out, scroll down to load all Situations and activate it.
Move view columns
You can change the width of each column by hovering your mouse cursor over the column order and clicking and dragging it to increase or decrease the width.
To change the order of the columns, click the column title cell of the column you want to move and drag it to a new location in the top row. Two green arrows will indicate if the move is valid:

You can also configure the order in which the Situations are shown by clicking the column title cell to rearrange them in ascending or descending alphabetical or numerical order. For example, click the 'Severity' column to arrange the Situations in ascending or descending order of severity.
Situation severity
There are six default industry-standard severity levels, which are shown and described below:
Clear: One or more alerts have been reported but then subsequently cleared either manually or automatically.
Indeterminate: The severity level could not be determined.
Warning: A number of potential or imminent service affecting faults have been detected.
Minor: There is a non-service affecting fault but action could be required to prevent it becoming a more serious issue.
Major: A service affecting fault has developed and corrective action is urgently required.
Critical: A serious service affecting fault has occurred and corrective action is required immediately.
The color severity of the My Situations and Open Situations icons on the Side Menu indicates the highest severity level of the alerts within each list. A Situation's severity will be determined by its alert with the highest severity level. If this alert is cleared then the Situation adopts the severity level of the alert with the next highest severity.
Situation details
The Situation details window allows you to explore the forensic details of a Situation.
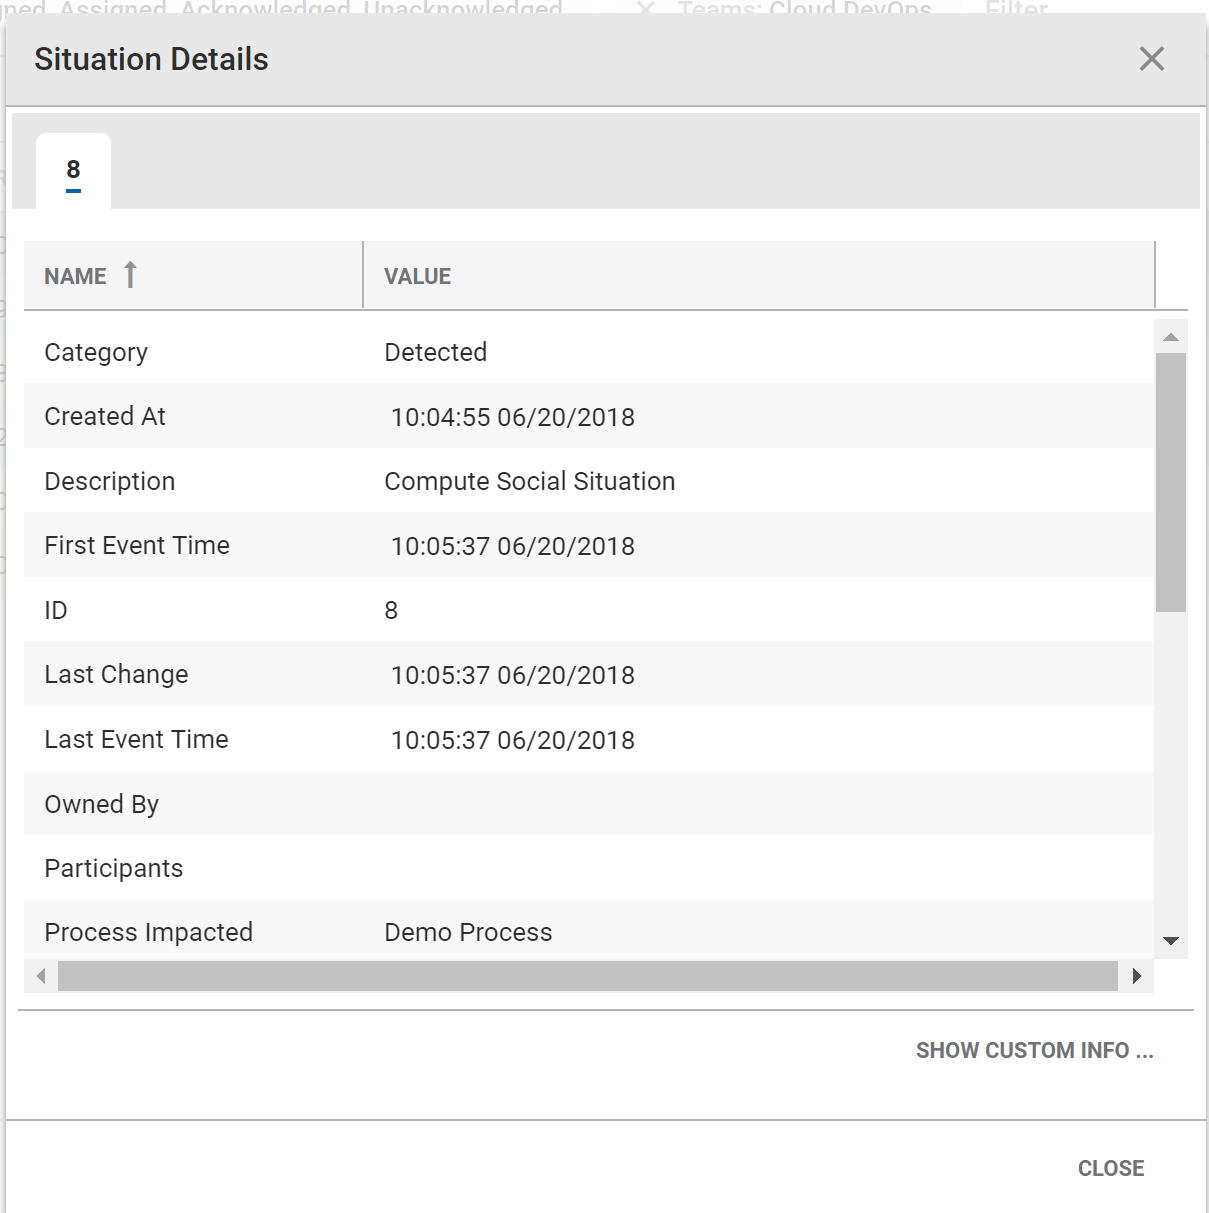
The individual column names and their descriptions are listed in the table below:
Name | Description |
Category | The category of the Situation:
|
Created At | The time the Situation was created (the number of seconds, minutes, hours, days ago). |
Description | The text description of the Situation. |
First Event Time | The time of the first Event (the number of seconds, minutes, hours, days ago). |
ID | The Situation ID. |
Last Change | The time of the last change that was made to the Situation. |
Last Event | The time that the last Event was recorded (the number of seconds, minutes, hours, days ago). |
Owned By | The username of the User who owns the Situation. |
Participants | The number of participants in the Situation. A User becomes a participant after commenting in the Situation Rooms. |
Process Impacted | The number of processes the Situation is impacting. |
Scope | The scope of the different source groups that are affected by the Alert or Situation (End-User, All, Network, Applications, Database, Storage, Desktop, Cloud, Other). |
Scope Trend | Whether the scope is increasing or decreasing/staying the same. This is indicated by an up or down arrow. |
Severity | The severity of the Situation. |
Status | The status of the Situation. |
Story | The story is the Situation ID at the top of the merge tree. |
Teams | The teams that are impacted by the Situation. |
Total Alerts | The total number of Alerts associated with the Situation. |
User Comments | The number of User comments in the Situation Room. |
You can copy the Situation details by clicking and dragging across the text to highlight it. You can use Ctrl+C (⌘+c on Mac) to copy the text. This can be pasted in an external editor or tool as required.
Custom info
You can access Custom info to view custom fields for the Situation. It displays in a page tree format. Click the blue drop-down arrows to view the property details.
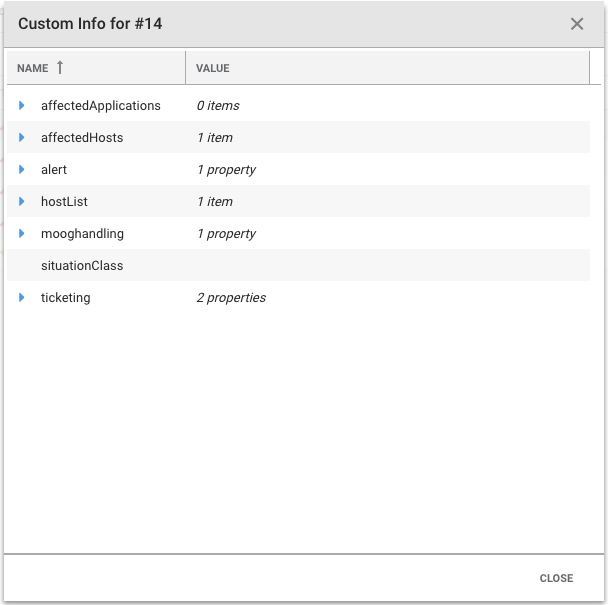
Administrators can add custom info to alerts during system configuration. You can add custom info using the Situation Client Tool using a JSON snippet under the 'Merge Custom Info' field.
