Incidents list
Navigate to Incidents > Incidents to access the incidents list. If necessary, click the list icon at the top center of the screen to switch from dashboard to list view. Unless you have changed the default view, the incidents list shows all open incidents in one interactive table. Click a check box or row or in the incident grid to view details for a single incident.
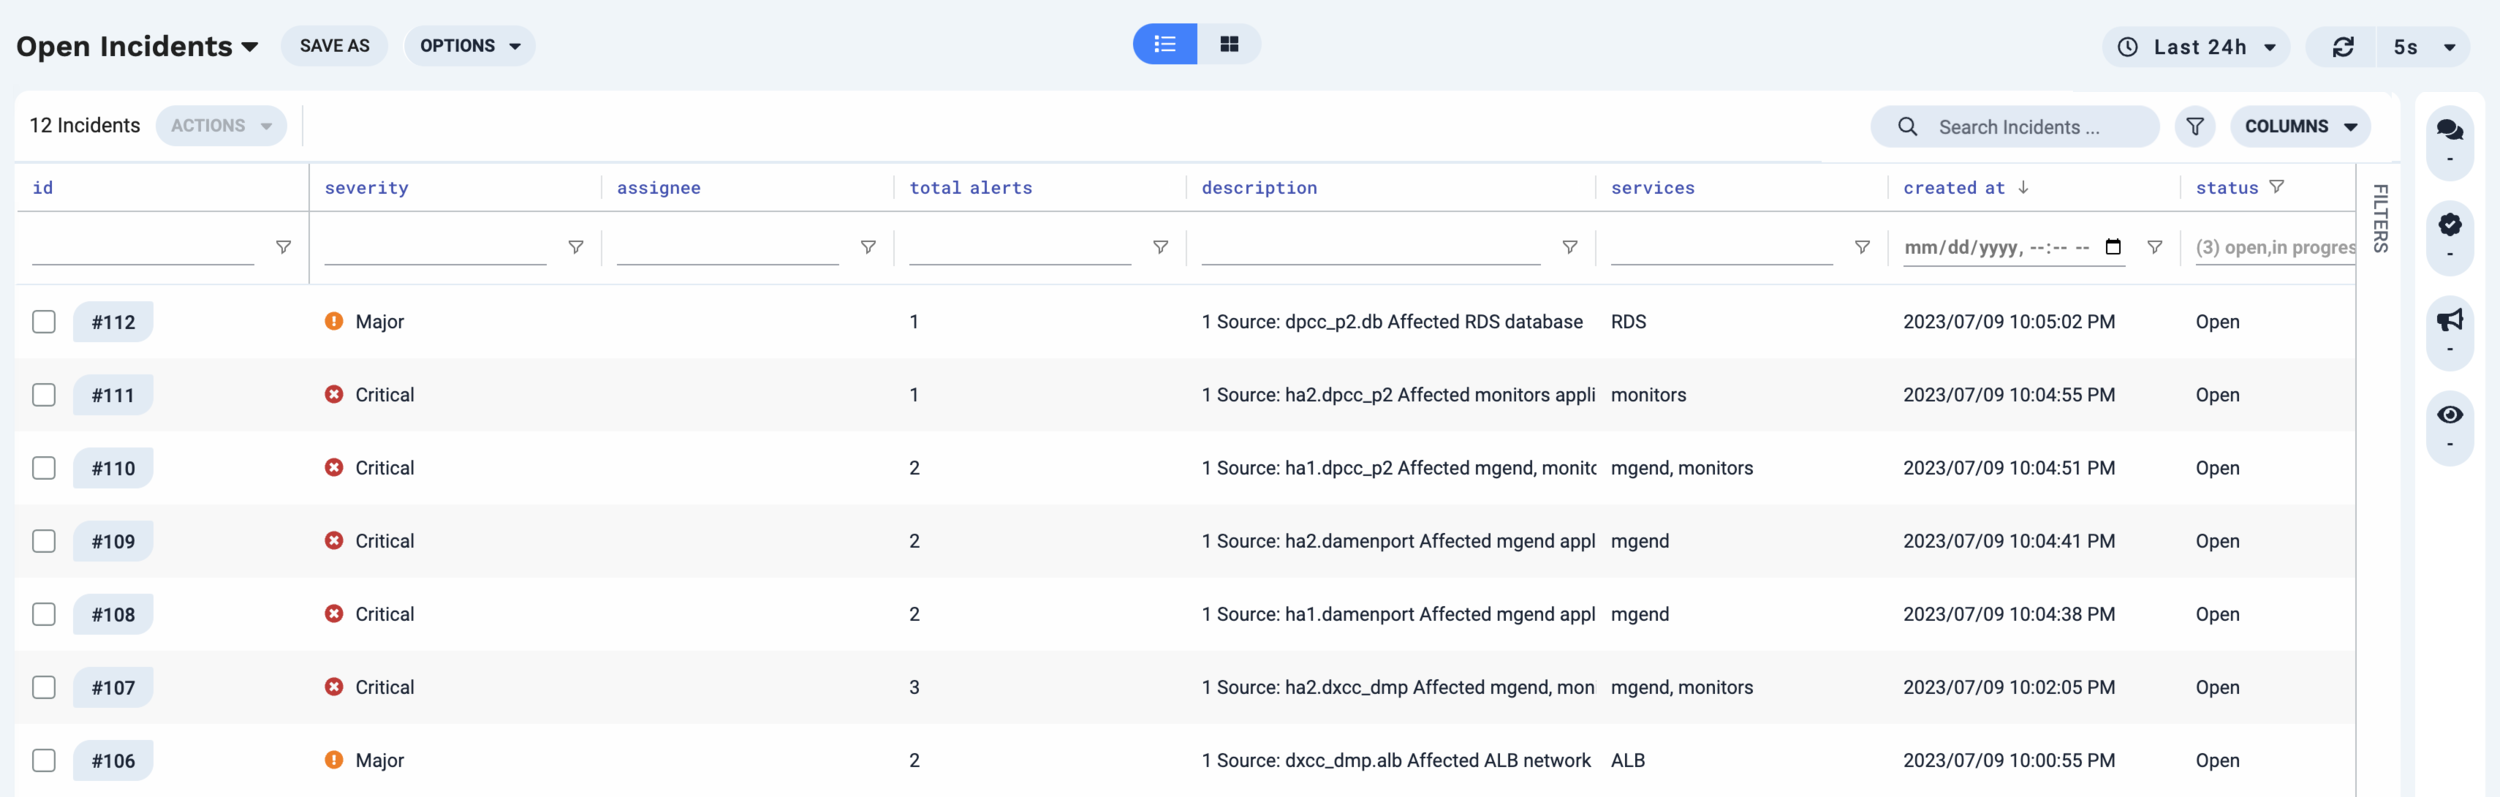
Explore the incidents list UI
The following tables describe controls that appear at the top of the incident list.
These controls appear in the top row from left to right:
UI element | Description |
|---|---|
View selector | Show the currently active view. Modify the active view by changing column filters, column widths, column sort order (ascending or descending), column visibility, whether the incident list or dashboard is showing, and dashboard tile and sort settings. (You can also change the incidents displayed using a free-text query in the search bar, but a search query is not saved as part of an incident view.) |
Save button | Save the current view. The Save or Save As button is active when you have made edits to the current view. You cannot save changes to a predefined view (for example, Open Incidents or My Incidents) or a view that someone else has shared with you, but you can make changes and save a copy as a new view. |
Options menu | Set a view as default, save a predefined view or a view shared with you, or share a view with other users. The options menu shows the options that are available to you for the current view. For example, you can only share views that you create. |
List/dashboard toggle | Switch between the incidents list and the dashboard. |
Time period selector | Filter the incident list and dashboard to include only incidents created in the given time period. |
Refresh button and selector | Refresh the list of incidents manually, or select an auto refresh interval. |
Online help icon | Open a pop-up window with help information for the current page. |
User account information | Select light or dark theme, view your account and subscription information, access your user profile, switch between Moogsoft Cloud instances (if relevant), and log out of Moogsoft. |
These controls appear in the second row from left to right:
UI element | Description |
|---|---|
Incident count | Display the number of incidents (and number of selected incidents, if relevant) in the current view. |
Actions menu | Perform bulk actions such as updating assignments, status, or priority for selected incidents. You can also copy data or links for selected incidents to the system clipboard. |
Search box | Enter text to filter the incident list using a free-text search. |
Filter buttons | Expand the filter pane. |
Columns | |
Comment icons | See Comments overview for an explanation of the comment and notification icons on the far right. |
Supported actions
The following table describes actions you can take from the incidents list.
What you can do | How to do it |
|---|---|
Select, create, copy, modify, save, share, and delete incident views | |
Modify the current view by choosing which incident attribute columns display and by changing the column widths, order, and sort direction | In the header, drag column borders to change column widths. Drag column names to change column order. Click the column name and then the arrow that appears to change sort direction. To sort by multiple columns, hold "Shift" on your keyboard and click several column names in succession. The number next to each name indicates the priority of the property in the sorting process. Click Columns to choose the columns to display. |
Modify the current view by applying one or more column filters | |
Apply a free-text search to display incidents matching the search query | Click the search bar and enter your search text. |
Switch to a dashboard pane summarizing the incidents in the current view | Click the icon with four squares in the top center. |
Display the incident details pane for a single incident | Click an incident row or select it using the check box. See Incident details for more information. |
Set the refresh frequency for the incident list | Click the Auto refresh interval menu in the upper right and select a refresh frequency (for example, 5 seconds or 1 minute). |
View and leave comments related to a selected incident | Select an incident, then click the Comments icon in the upper right to open the Comments pane and read and post comments. See Comments overview for more details. |
Change the assignee for one or more incidents | Use the check boxes to select incidents. Right-click in the incident grid or click the actions menu in the upper left. Select Assign and select a user from the list. |
Change the status for one or more incidents | Use the checkboxes to select incidents. Right-click in the incident grid or click the actions menu in the upper left. Choose Set In Progress, Resolve, or Close from the menu. |
Change the priority for one or more incidents | Use the checkboxes to select incidents. Right-click in the incident grid or click the actions menu in the upper left. Select Set Priority and choose a priority value. |
Copy information for one or more incidents to the system clipboard | Use the checkboxes to select incidents. Right-click in the incident grid or click the actions in the upper left. Choose Copy, Copy with Headers, or Get Link to Incident to copy incident attributes or URLs. |
Get more information | To access context-sensitive help, click the question mark icon in the upper right. |
Modify columns
Click Columns at the top of the page to access the following column options:
Add a column
In the Columns dialog, click Add Column and select a column to add to the view by clicking Add Column (+ icon) to the right of the column name. The column is added to the grid display.
If the column you want to add isn't in the list of recent columns, use the search box at the top of the dialog to locate it.
Pin (or unpin) a column
Pinning moves the column to the first position in the grid (or within the pinned group, if other columns are already pinned), "freezes" it in place, and allows the columns to the right of it to continue to scroll.
To pin a column, click the pin icon to the right of the column. This pins the column and all columns to the left of it.
If the column is already pinned, then clicking the pin icon unpins it.
Auto-size a column
To make a column as wide as the widest item in the column, click Auto-size this Column ( ↔ icon ) to the right of the column name.
Remove a column
Click Remove Column (trashcan icon) to the right of the column name.
Auto-size all columns
To change the width of all the columns to the width of the widest item in each column, click Auto-size All at the bottom of the dialog.
Actions in the bottom pane
When you select an incident in the top pane, the alerts making up that incident display in the bottom pane. You can use the right-click menu to perform the same actions on alerts in this pane that you can perform on the Alerts page. See Use right-click alert actions for details.