Use Service Panels to Check Impacted Services
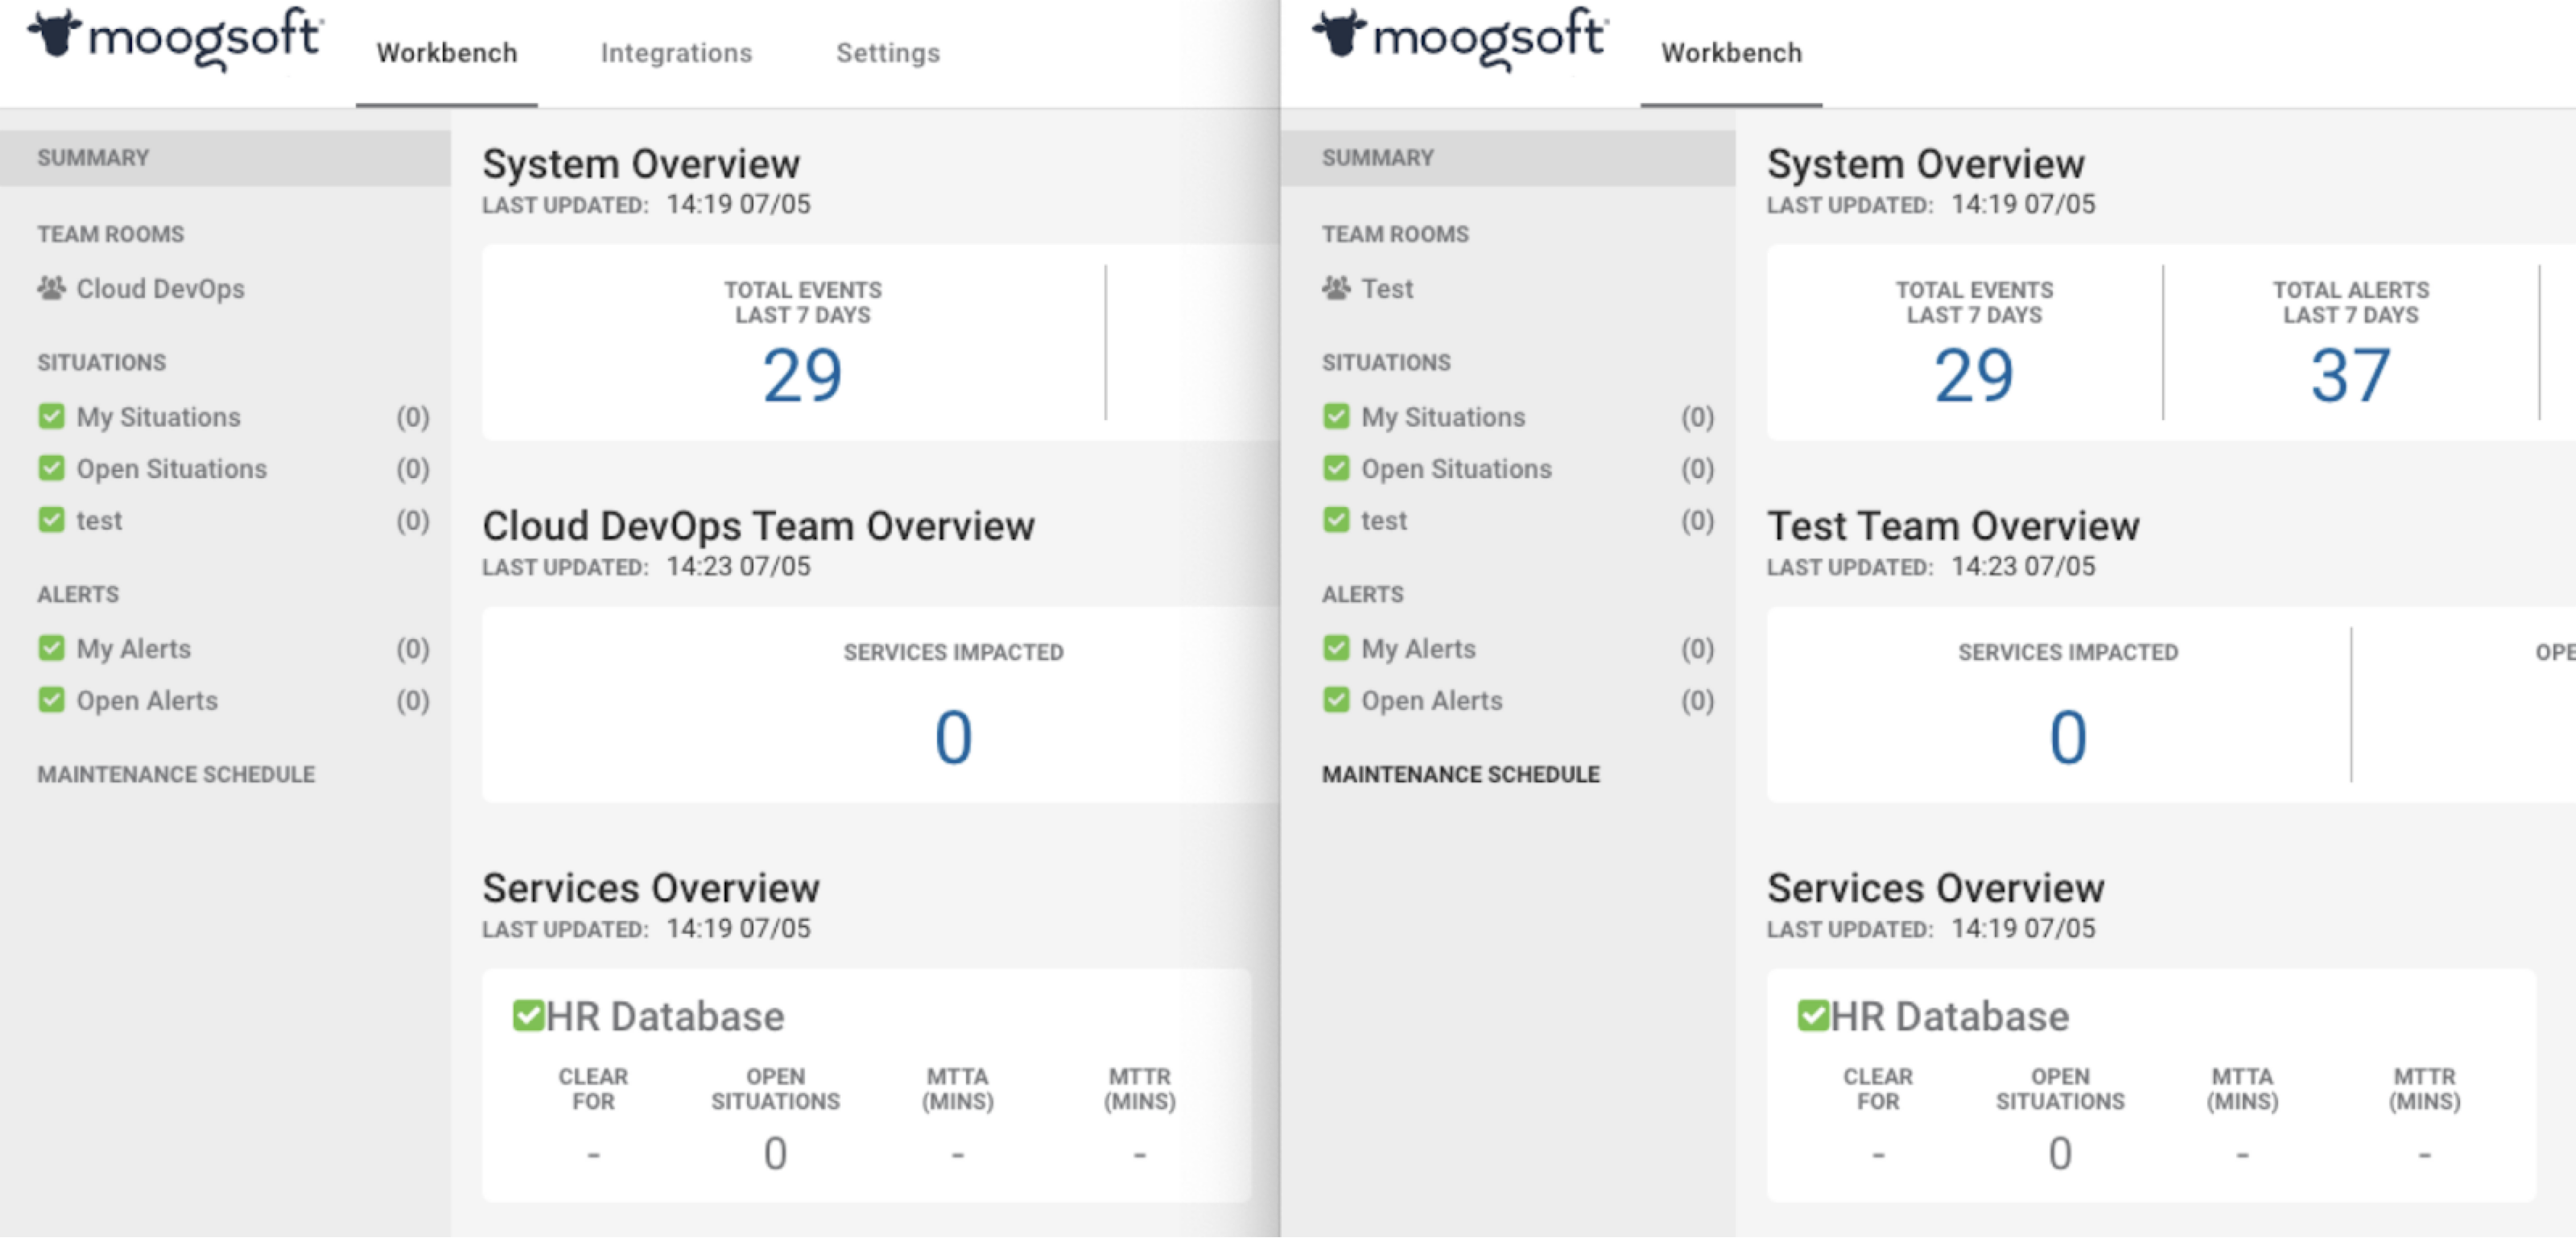
Service panels display in the Services Overview area and show information on currently impacted services to users who are members of involved teams.
 |
Service panel display factors
You will see a service panel when:
The corresponding service is assigned to your team. The service panel always displays in this case, whether or not there are open Situations impacting the service.
A Situation is assigned to your team which is impacting the corresponding service.
You will not see a service panel when:
The service is not assigned to your team and there is no Situation impacting the service assigned to your team.
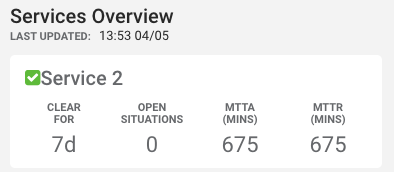
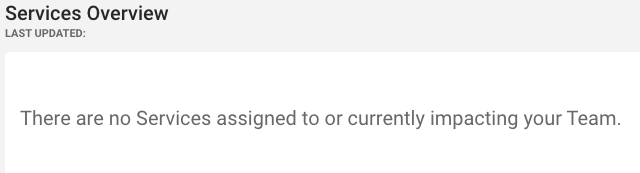
There are no Situations impacting any service assigned to your team. When this occurs, this panel displays instead:
Understanding items displayed in service panels
These indicators help you understand the current status of each service:
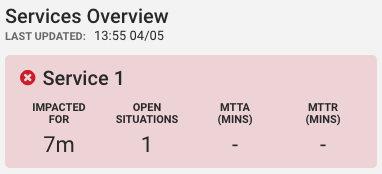
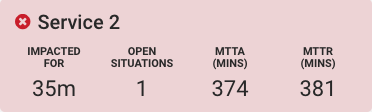
Impacted for: For services that currently have active Situations, this indicator displays the length of time the service has been impacted, starting from the time when the first Situation was created to the present.
If there are no active Situations, then "Clear for" displays instead.
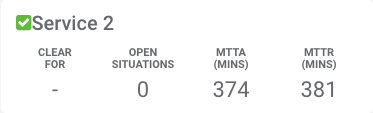
Clear for: Displays when there are no open Situations currently impacting the service assigned to your team. This indicator displays the length of time since the last Situation impacting the service was closed to the present.
A number displays if there are no open Situations currently impacting the service.
A dash (-) displays if there are no open Situations impacting the service, but there are Situations which are not yet closed. A dash also displays when there are no open Situations impacting the service which are assigned to your team, but which are assigned to other teams.
If there are active Situations impacting the service, then "Impacted for" displays instead.
Open Situations: A count of the total number of open Situations impacting the service (Closed, Dormant, and Resolved are not included).
Displays 0 when there are no Situations impacting the service which are assigned to your team.
Displays a number when there is at least one Situation impacting the service which is assigned to your team. This number may be greater than all Situations impacting this service assigned to your team.
Displays the label "Impacted For" and a time when the number of open Situations is greater than zero; otherwise, the label "Clear For" displays instead with a time or a dash (-).
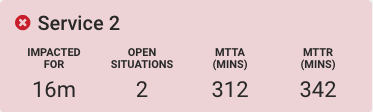
MTTA (MINS): The average amount of time (in minutes) between Situation creation and acknowledgement. It is calculated as the mean across all open and closed Situations (assigned to all teams) created during the last seven days.
MTTR (MINS): The average amount of time (in minutes) between the time the Situation was created and when it was resolved. It is calculated as a mean across all open and closed Situations (assigned to all teams) creating during the last seven days.
Frequency of service panel updates
Each published metric is updated in either 17- or 59-second intervals, depending on the last computation time.
MTTA and MTTR updates can happen at the same time as the metric publish frequency, or may be calculated less frequently (as infrequently as once an hour).
Situations reflected in the service panel
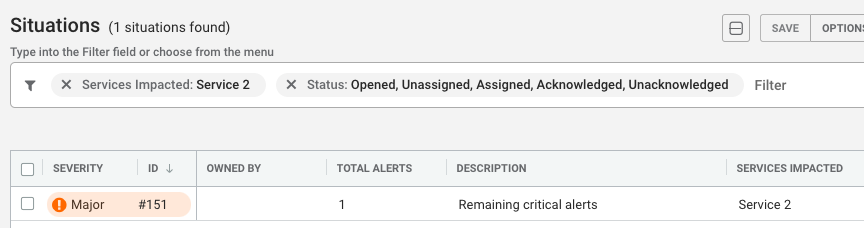
If the service is assigned to a team and there is at least one Situation assigned to this team impacting this service , the service panel shows all open Situations, including those from other teams.
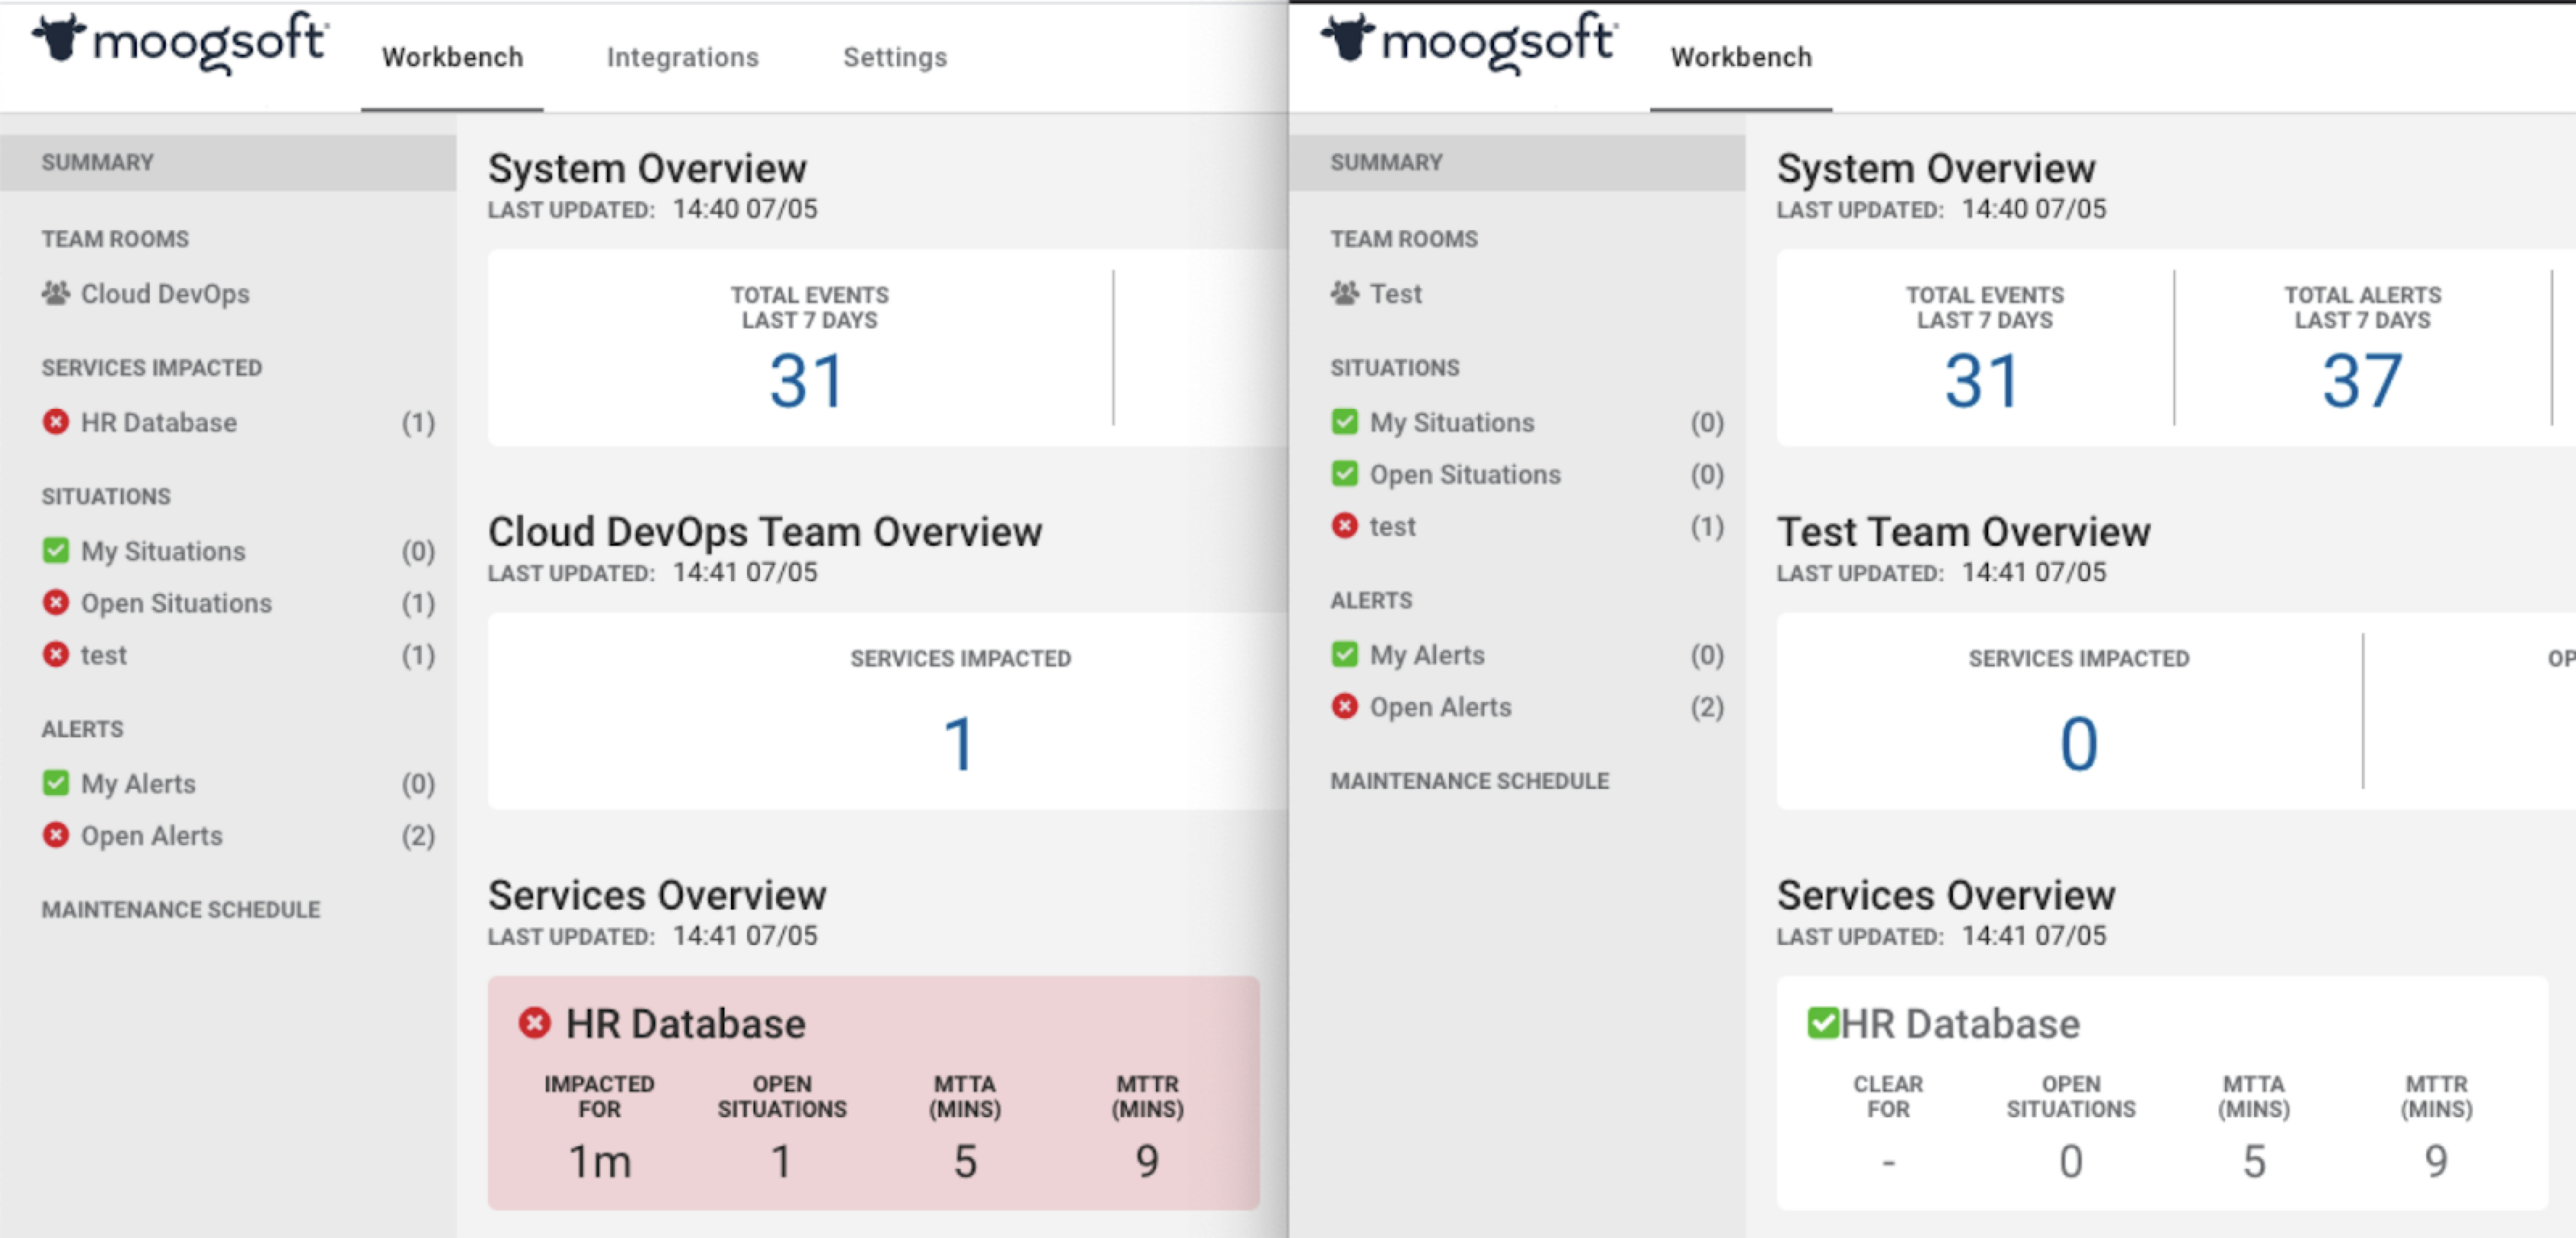
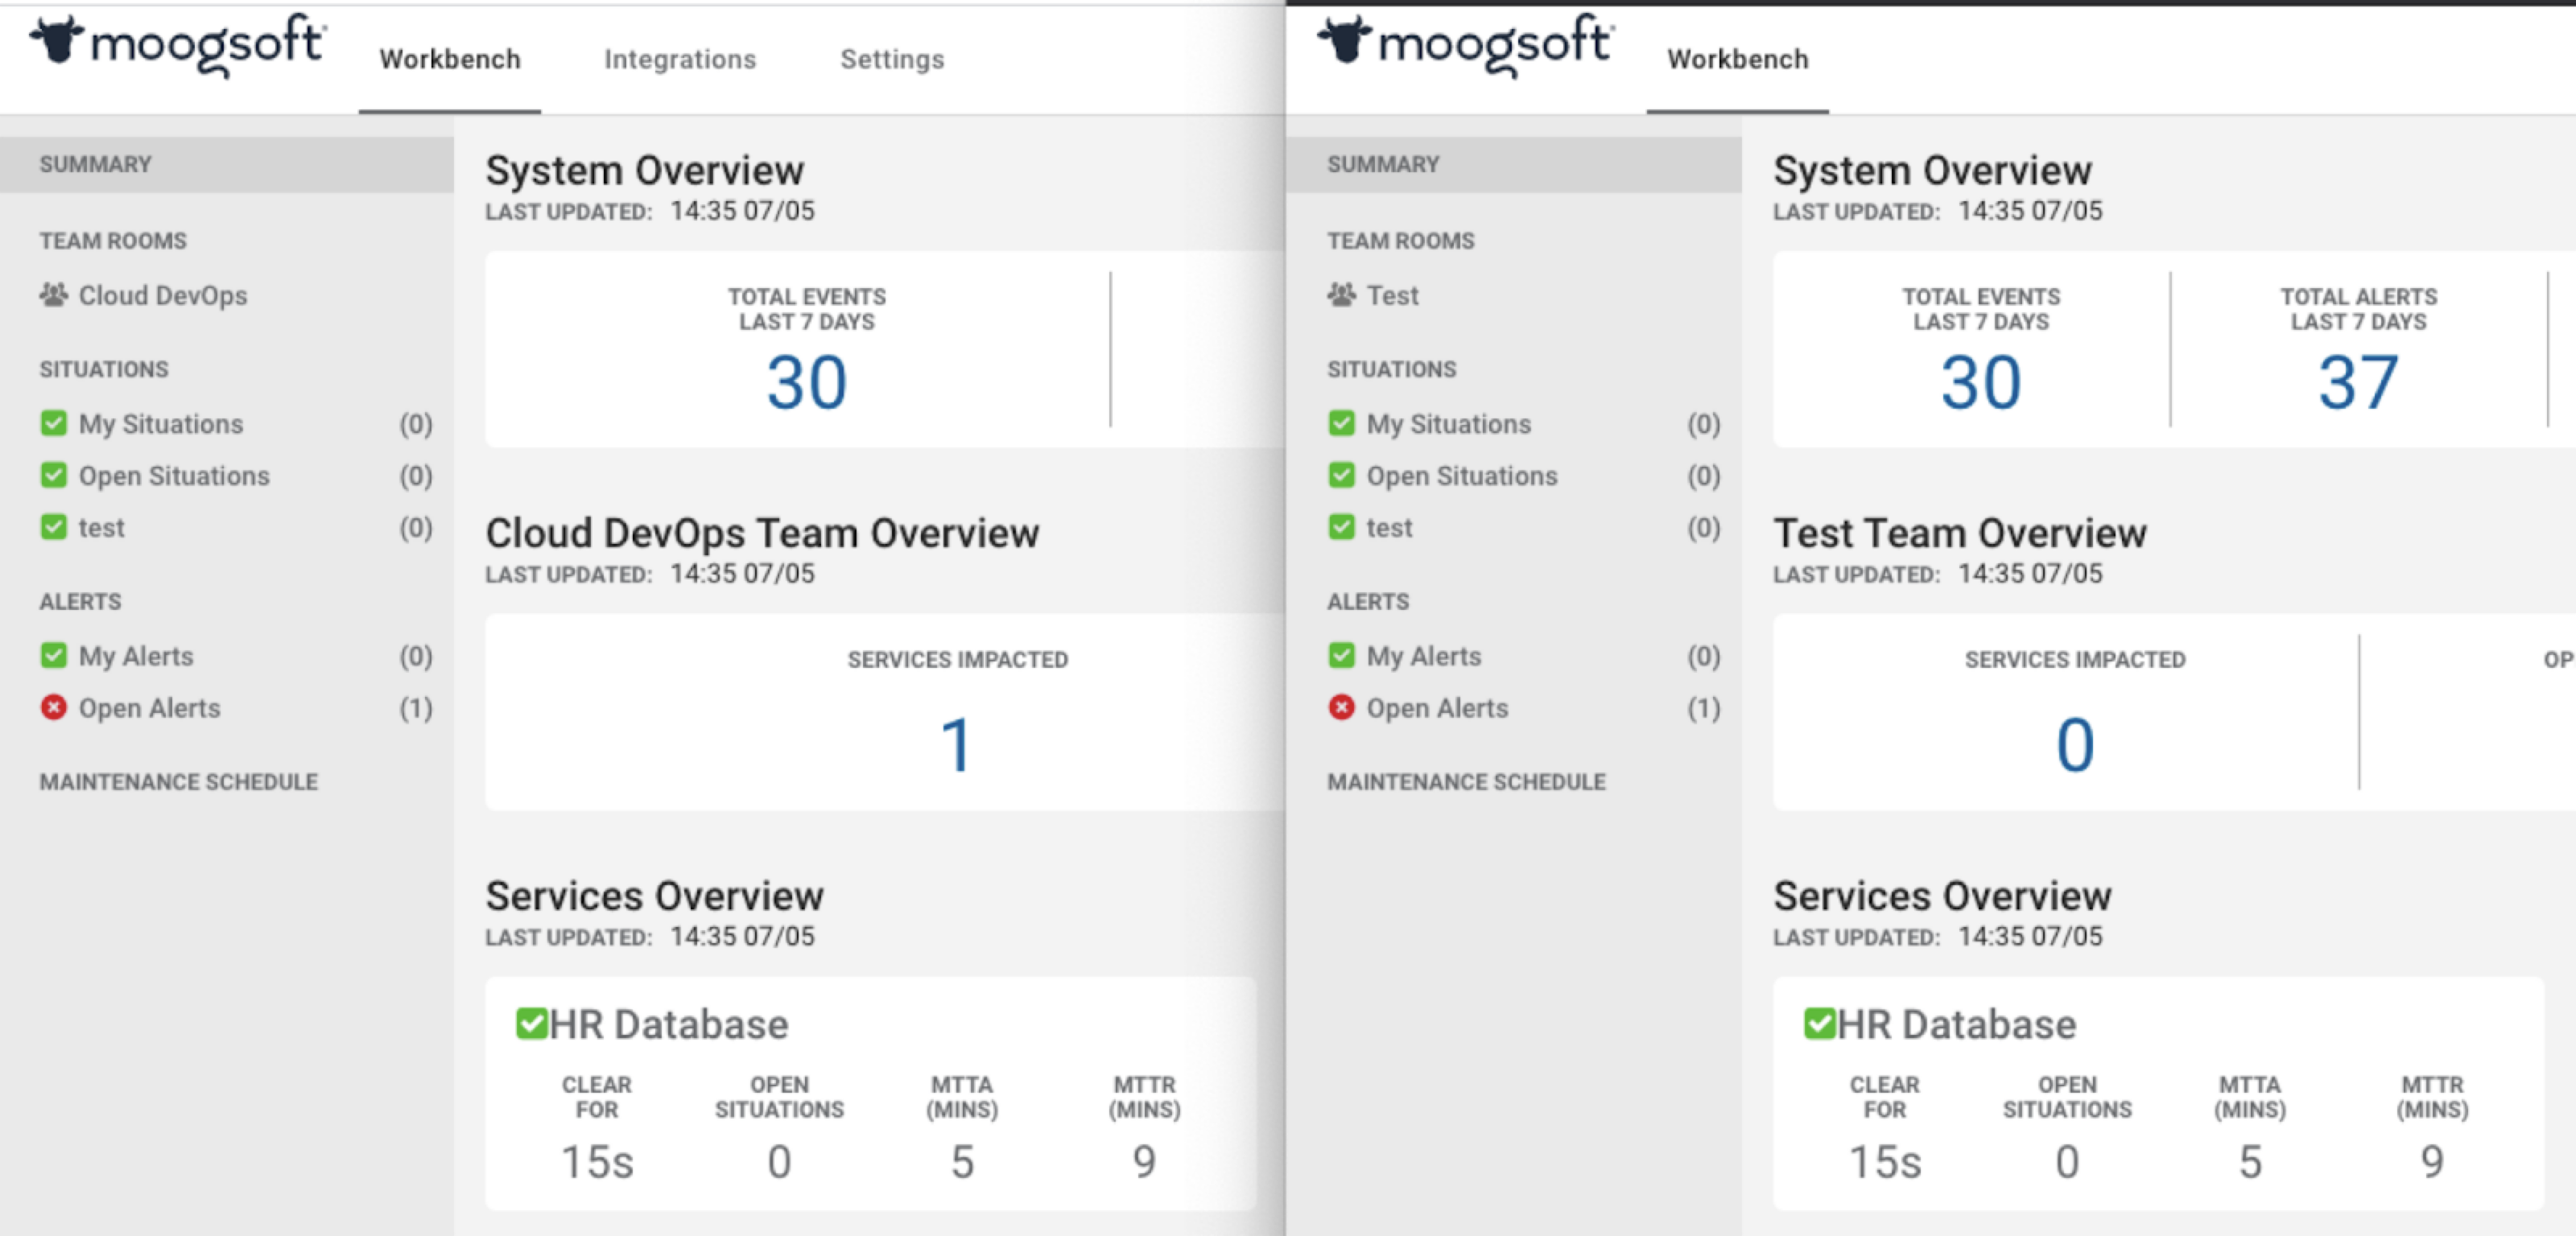
For example, for one team, the following service panel shows one open Situation:
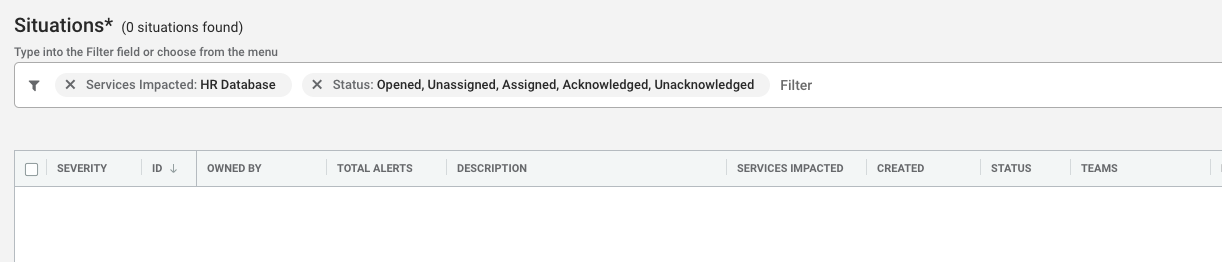
But for another team, the service panel shows no open Situations because there is no Situation impacting this service assigned to the team:
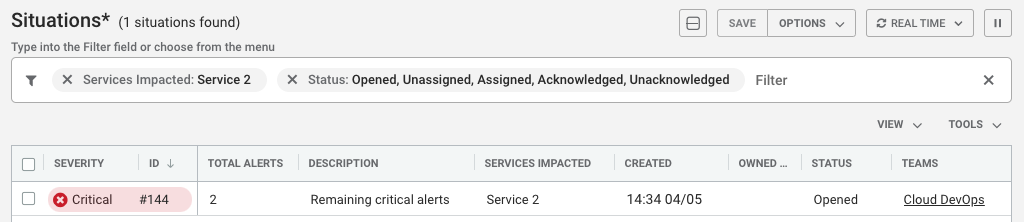
However, a user on the second team who clicks this service panel may see other Situations impacting this service, provided the user has all_data permissions.
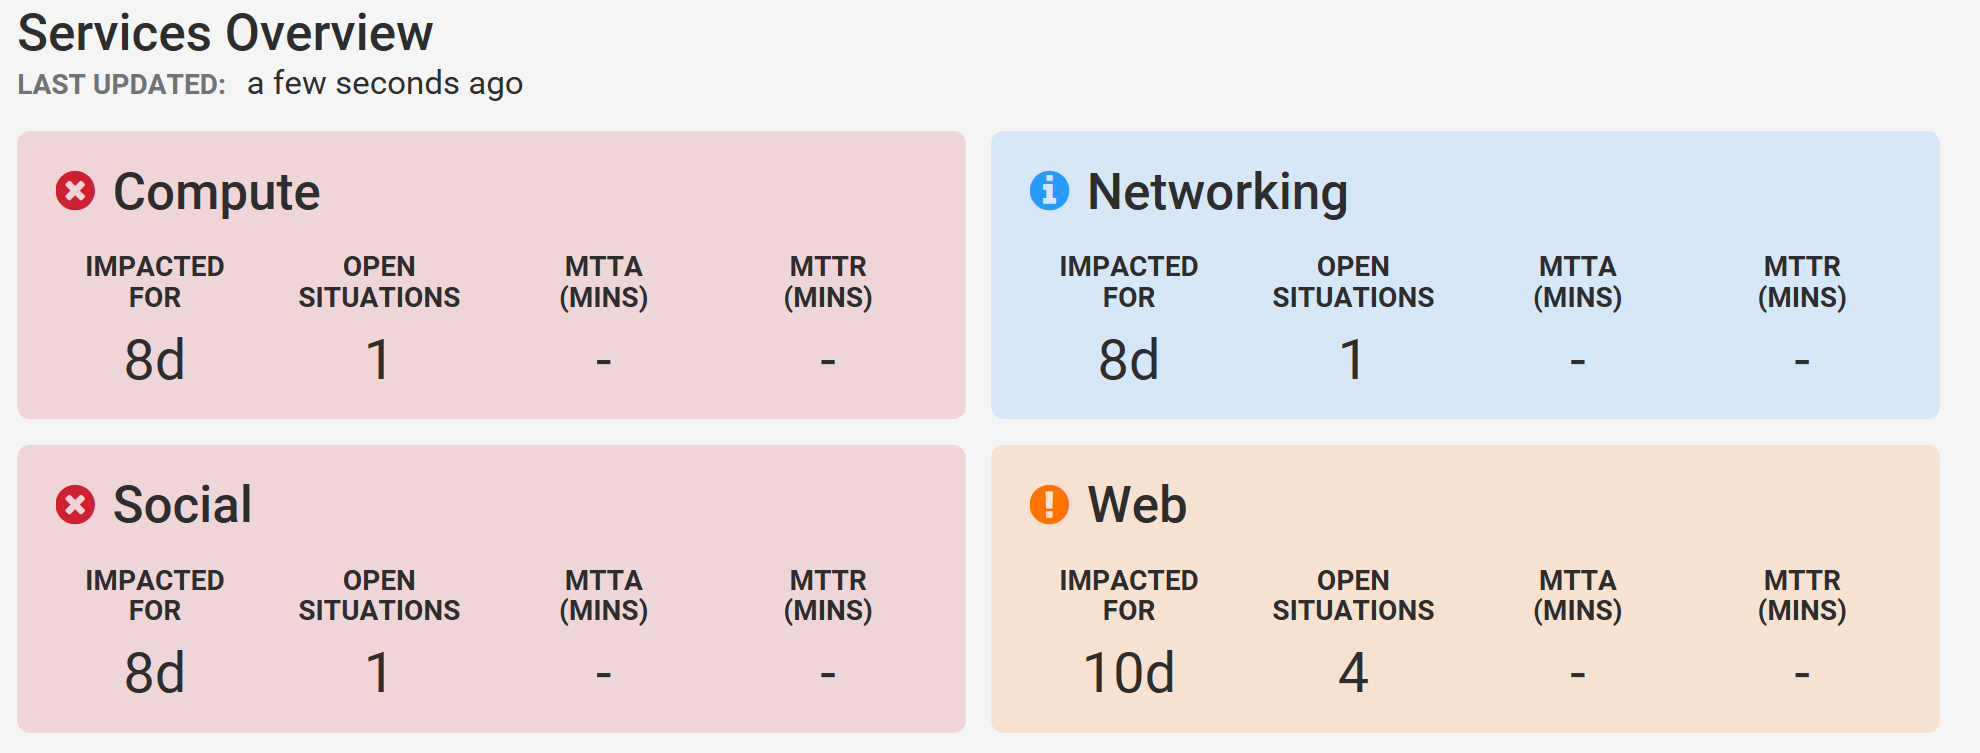
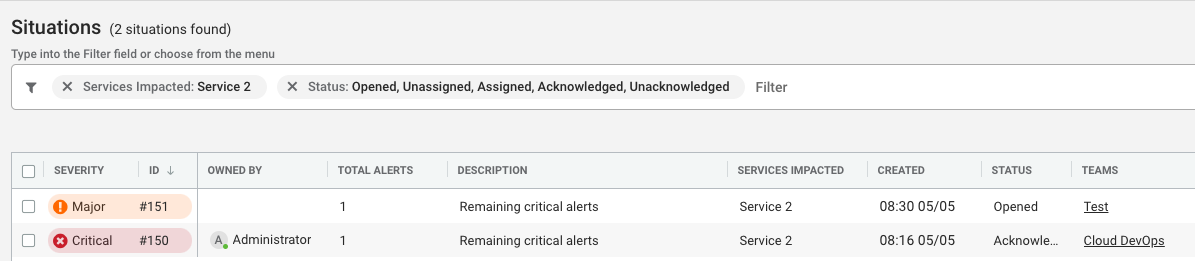
Similarly, there could be several open Situations displayed in the panel:
NOTE: The serverity displayed in the panel is determined by the Open Situation with the highest severity.
After clicking the panel, the user might not see all Situations impacting this service. Users who don't have all_data permissions cannot see the Situations assigned to teams where they are not members. For this reason, the highest severity of the Situations assigned to this team can be lower than the service panel severity, such as when the Situation assigned to this team is Major but the panel severity shows Critical.
Whereas users with all_data permissions see all Situations impacting the service when they click the panel:
Example scenario
Test Data
Assuming the following data:
Service: HR Database
Team: Cloud DevOps
Has the service HR Database in the service filter.
The current user is admin.
Team: Test
Has the service HR Database in the service filter.
The current user is test.
There is a Situation filter where severity = Major.
The service panel permanently displays for both teams with these default values:
Open Situations: 0
Clear For: -
MTTA: -
MTTR: -
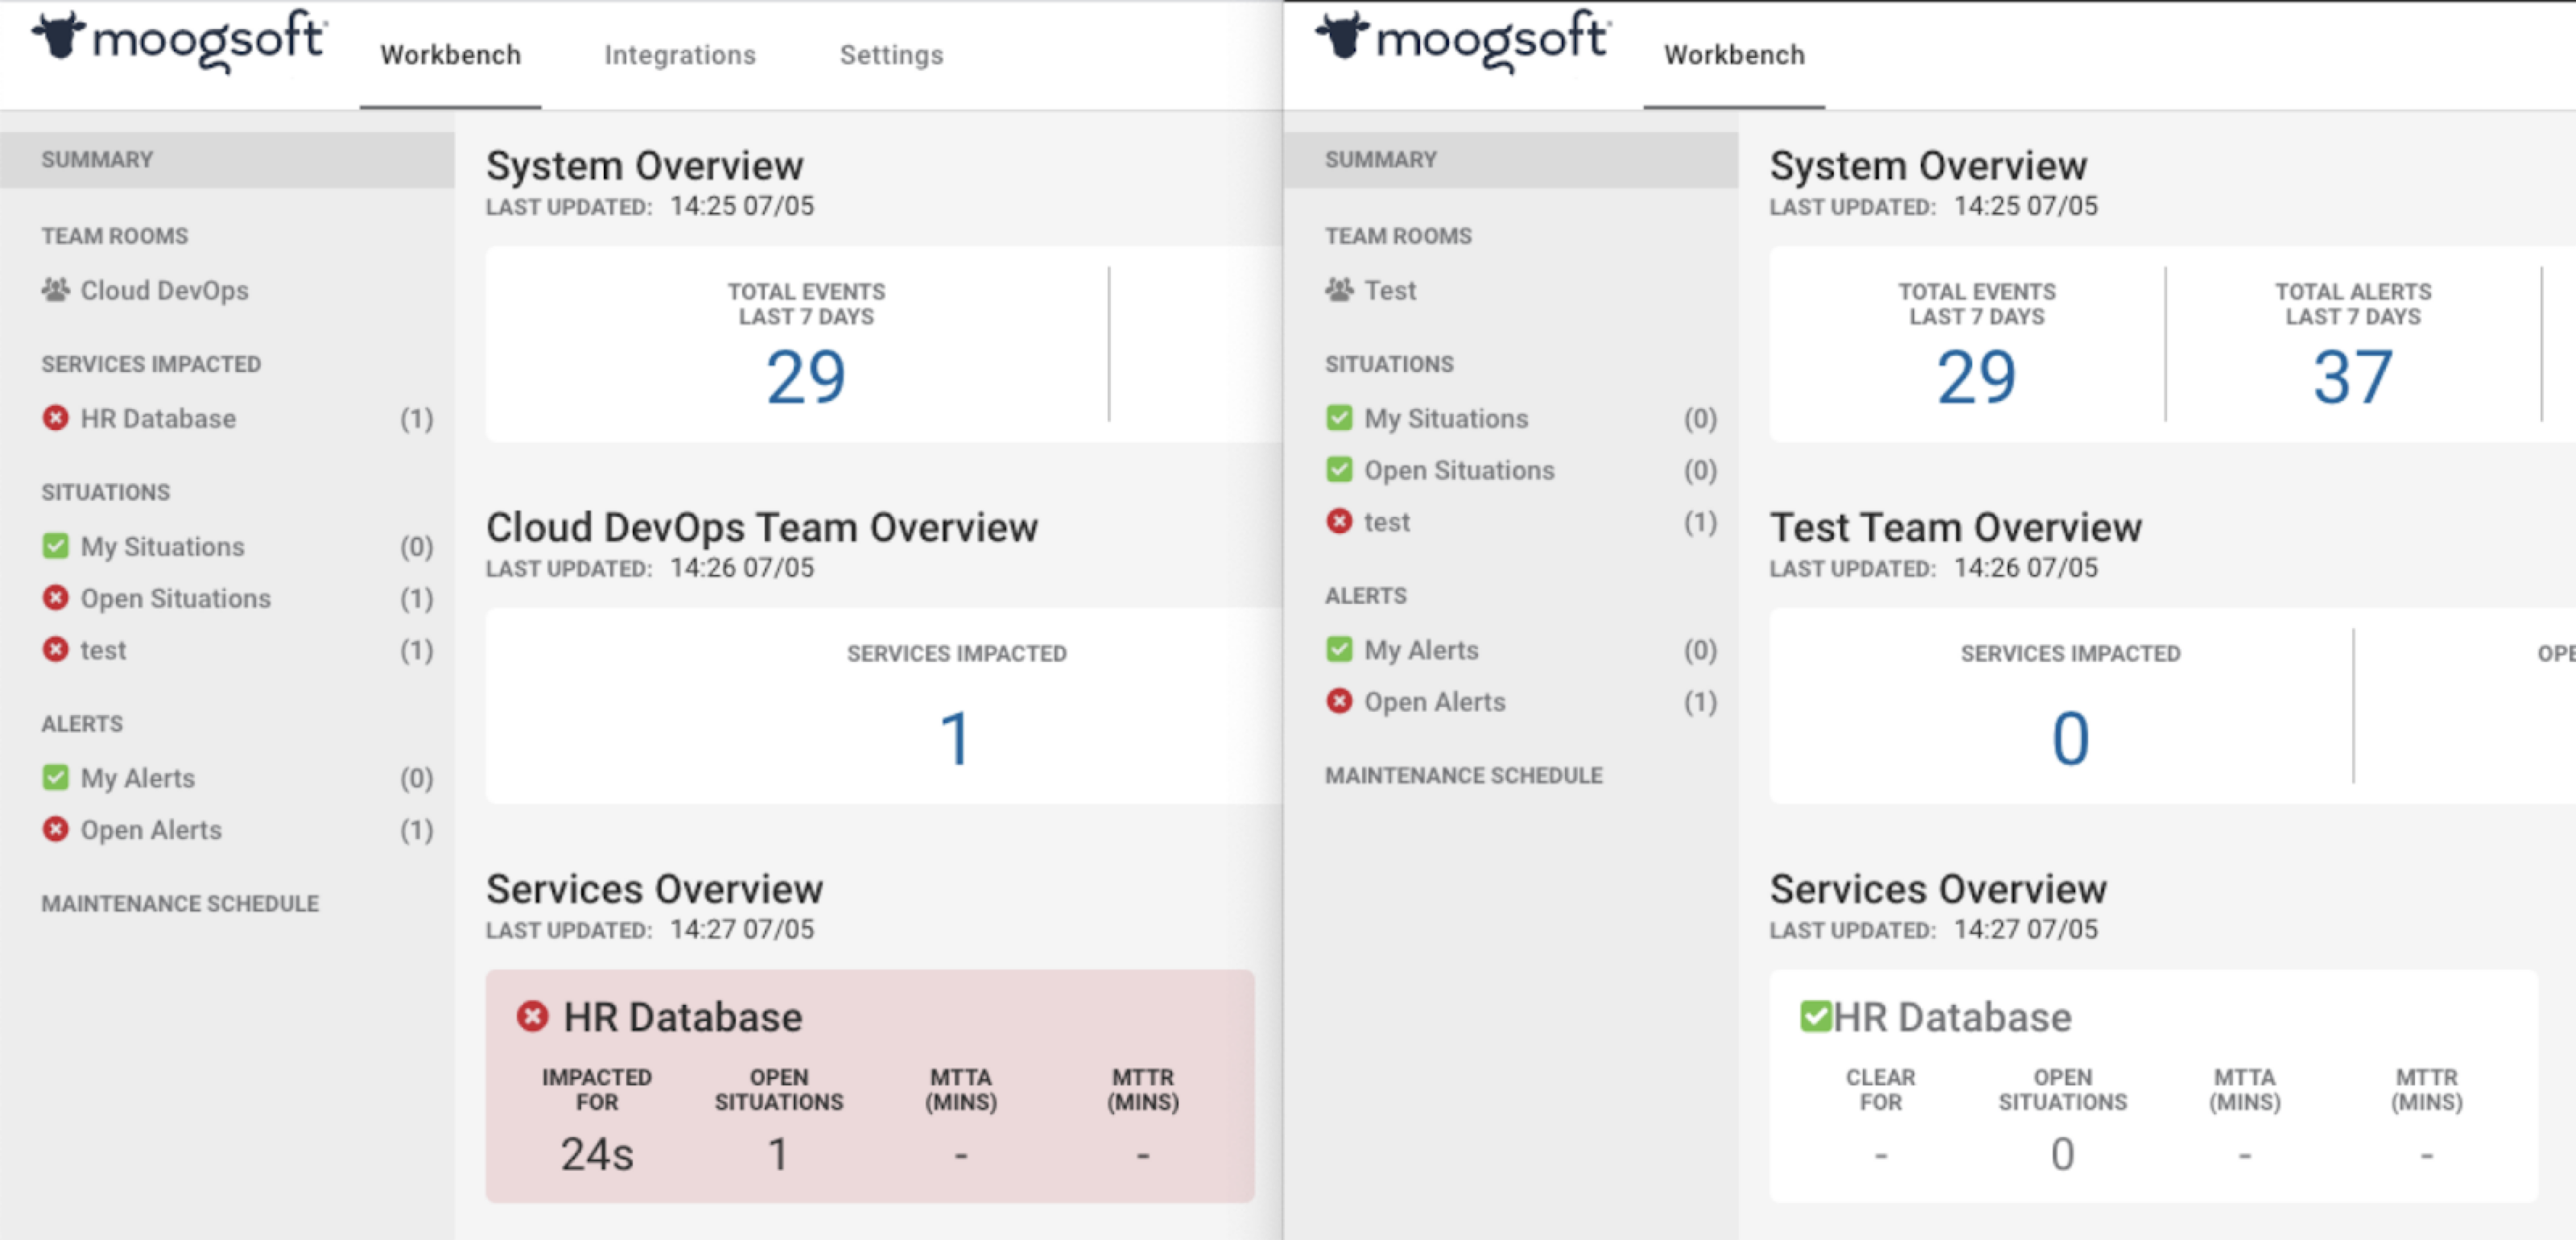
Create a new situation
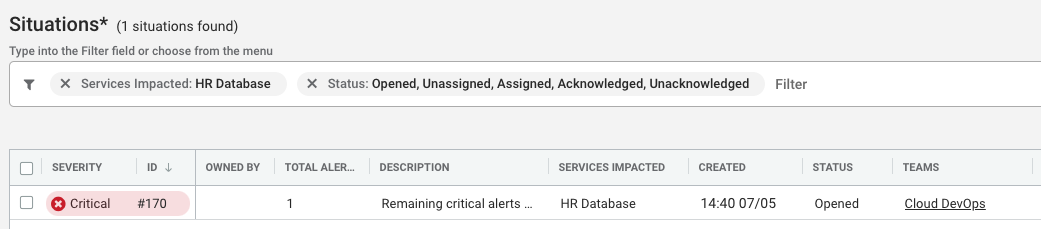
A new situation is created where severity = Critical. It impacts the service HR Database, and it was automatically assigned to the team Cloud DevOps.
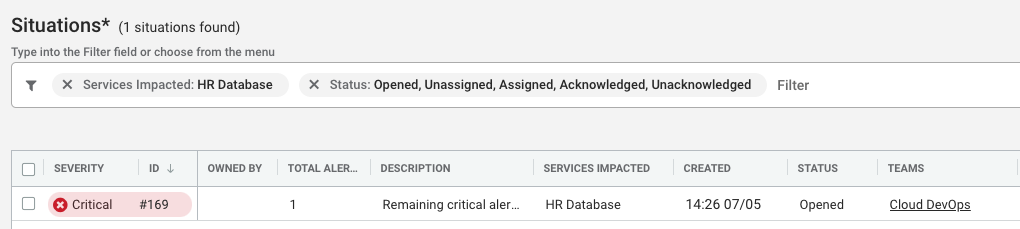
Team Cloud DevOps
Sees the updated service panel with 1 open Situation with "Impacted For" showing a time.
Team Test
The service panel remains the same: Open Situations is still 0 since no Situation is assigned to team Test.
Clicking on the service panel shows a Situation if the user has permission all_data
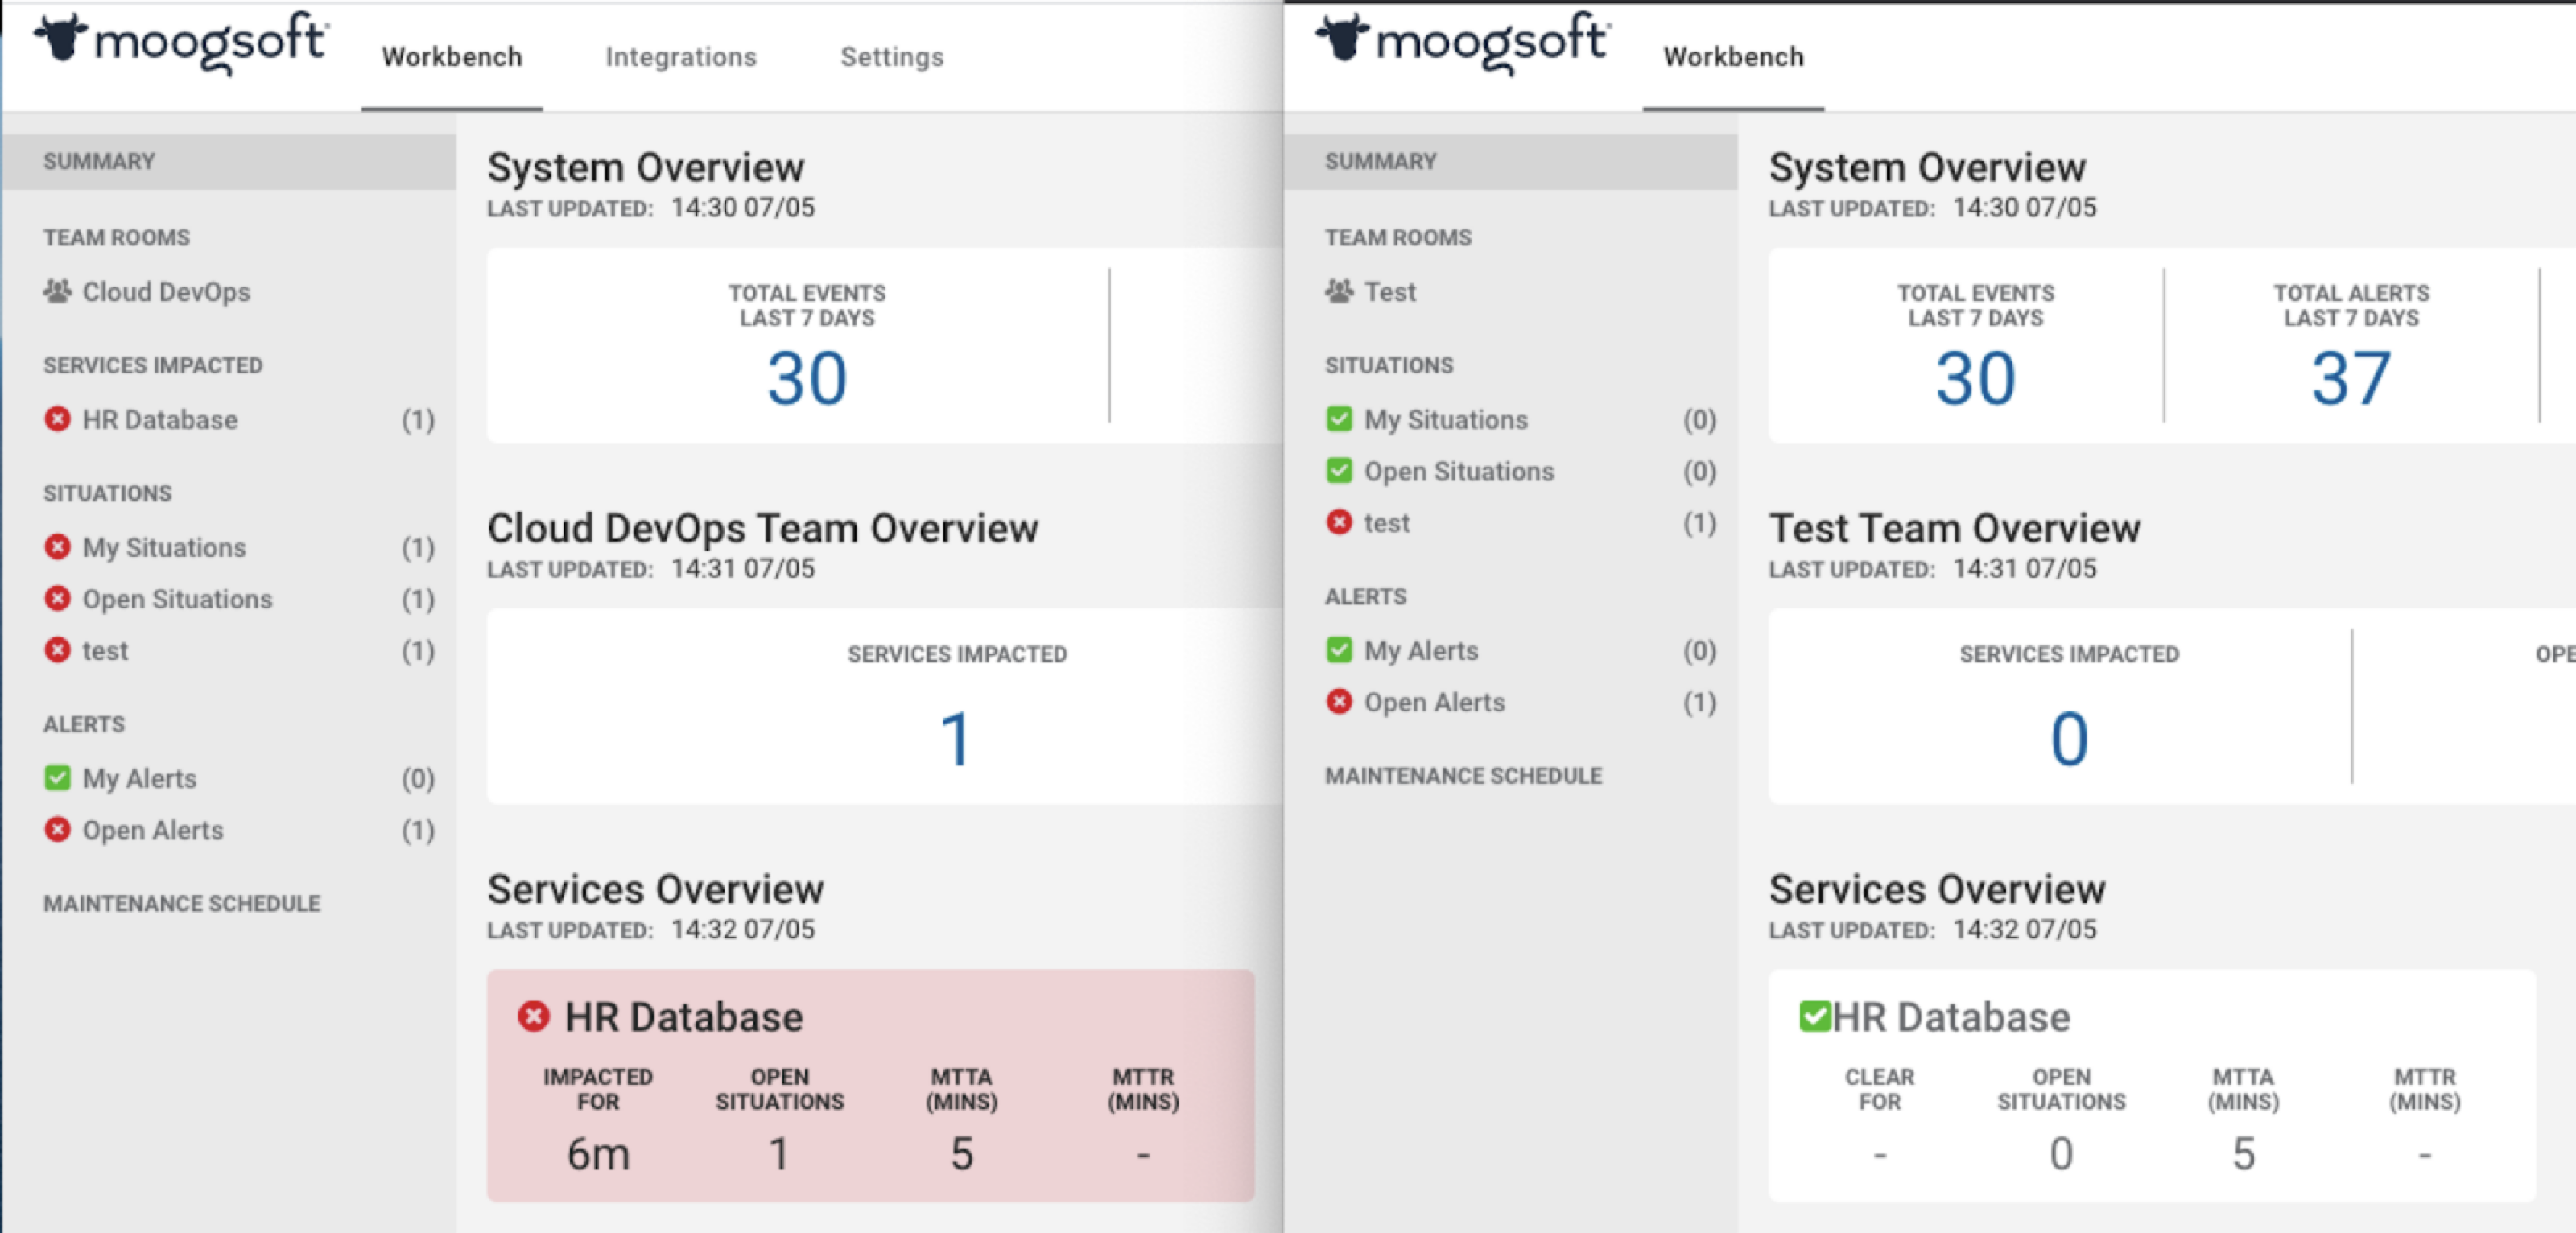
Own the Situation
User in Team Cloud DevOps owns the Situation:
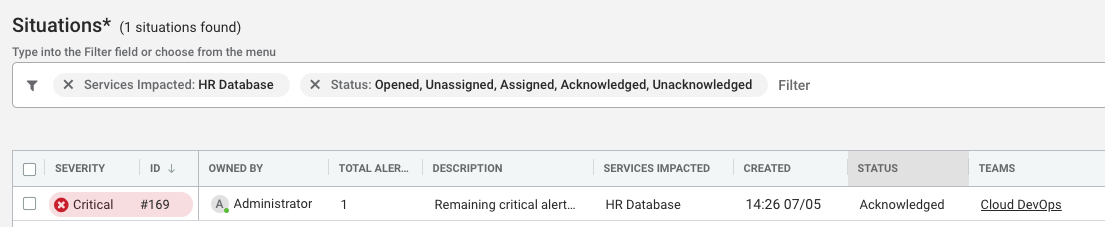
Team Cloud DevOps
Sees the updated service panel with MTTA now showing a time.
Team Test
Sees the updated service panel with MTTA now showing a time.
Resolve and close the situation
A user in Team Cloud DevOps resolves the Situation—it is removed from the service panel view.
Team Cloud DevOps
Sees updated service panel with MTTR now shows a time; the "Impacted For" label is replaced with the "Clear For" label and the "Clear For" time.
Team Test
Sees the updated service panel with MTTR time and the "Clear For" time.
Create another situation
A new Situation was created with severity = Critical impacting service HR Database which again was automatically assigned to team Cloud DevOps.
Team Cloud DevOps
Sees the updated service panel with one open Situation and "Impacted For" timer showing a time; also shows the current MTTA and MTTR values for this service for the last 7 days
Team Test
The Clear For time no longer displays on the service panel, indicating there is an open Situation impacting the service (but not one assigned to team Test).
Clicking the service panel shows a Situation if user has permission all_data.