View Situation Topology
Issues affecting different systems in your network can frequently be related to the same Situation. Moogsoft Enterprise uses topological data to present a visual representation of connections between the nodes impacted by a Situation.
For more information see Topology Overview and Configure a Cookbook Recipe.
Before you begin
To enable the topology view in the Situation Room, an Administrator must:
Create one or more topologies using the Topologies API or the Topology Loader utility.
The Graph Analyser process then runs as part of Housekeeper automatically calculates the Vertex Entropy for each node. See Create and Manage Topologies for more information.
Configure a Recipe with a topology filter. If a Situation is created in any other way (for example by Tempus, manual merge or a Recipe not using the topology filter) the Topology tab is not available. For more information see Configure a Cookbook Recipe.
When a Situation affects more than one node and Moogsoft Enterprise has topological data for those nodes, you can use the Situation Room Topology tab.
The Situation topology tab automatically renders based on the contents of the Situation.
Topology navigation
While in a Situation Room, click the Topology tab. You can toggle full screen view to hide the other elements on the screen and focus on the topology. Use the zoom buttons on the right side of the topology to zoom in and out. Node labels appear as you zoom in. Click and drag the nodes to rearrange the topology view. Hover your mouse cursor over a node to display its name, description and service data.Open the Display Options window to access options for relative node size, neighbor node selection and a description of the severity colors.
For example, consider the following topology that indicates a potentially serious Situation that requires immediate investigation. Two nodes (red) are critical, another two nodes (orange) are major and they are connected to other nodes that are as yet unaffected.

The following example shows a Situation with many involved nodes, some of which are critical:
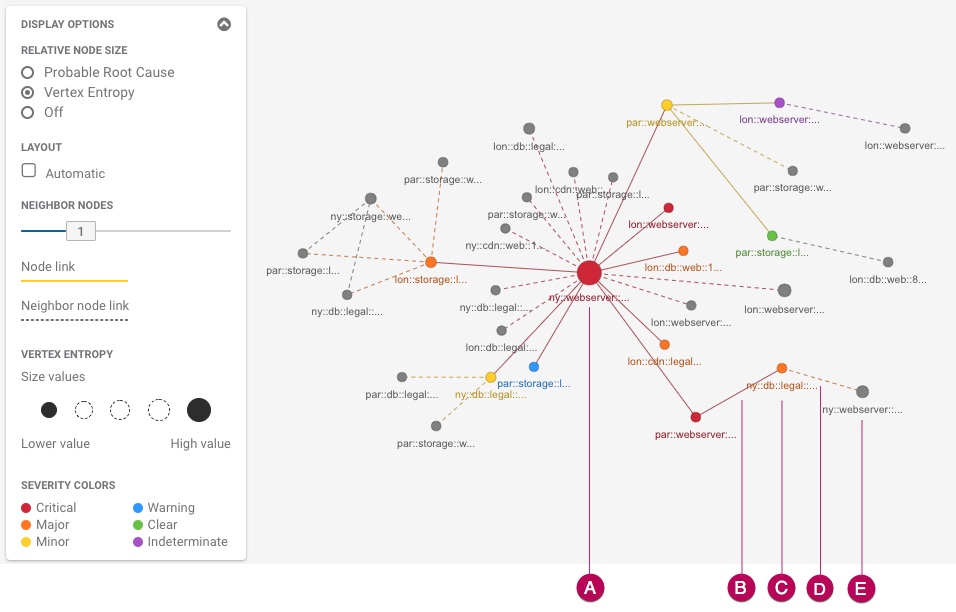
A: The node with the highest Vertex Entropy value is critical in this Situation.
B: A solid line indicates a link between affected nodes. The higher severity determines the color of the line.
C: Several other nodes are involved in the Situation with varying levels of severity.
D: A dotted gray line indicates a link between unaffected nodes.
E: Gray nodes are not involved in the Situation but appear on the topology depending on the Neighbor Nodes selection.
View another impacted topology
If an alert in the Situation is also in another Situation for a different topology (that is, it has been clustered by another Recipe using a different topology) both topologies are shown as impacted. Select another topology from the drop-down list to view it.
View neighbor nodes
The topology displays affected nodes and their immediate neighbors, even if the neighbors are not involved in the Situation. Neighbor nodes provide context about the nodes in the Situation, relative to their location in the topology. For example, if you increase the number of neighbor nodes you may see that two nodes in the Situation are connected to the same switch, that is not part of the Situation.
Open the Display Options window on the left side of the topology view and use the neighbor nodes slider to control the number of neighbor nodes on display. You can show:
A maximum of 4 neighbors.
Up to 150 uninvolved neighbor nodes in total.
The maximum number of neighbor nodes on the slider corresponds to the total number of uninvolved nodes in the topology. For example, if a neighbor node level of 4 includes 151 uninvolved nodes, the slider maximum is automatically set to 3. There is no limit on the number of affected nodes you can display, however large topologies of 500+ affected nodes can take more than a minute to load.
View alert severity
The color of the node reflects the highest severity of its alerts. Neighbor nodes that are not involved in the Situation are gray.
Filter alerts
You can add filters to refine the list of alerts using full or partial matching. Nodes matching the filter are highlighted in the topology. For example, the filter "Host: web" will display all alerts with host names that include the string "web".
View Vertex Entropy
If you want the topology to indicate Vertex Entropy, open the Tools window and select Vertex Entropy. The size of the node indicates its Vertex Entropy. The larger the node, the higher the Vertex Entropy value.
See Configure Topology-based Clustering with Vertex Entropy for more information.
View PRC
If you want the topology to indicate Probable Root Cause (PRC), ensure that PRC data exists for one or more alerts in the Situation. Open the Display Options window and select Probable Root Cause. The size of the node indicates PRC. The larger the node, the higher the PRC value.
See Probable Root Cause for more information.
Refresh the topology
Moogsoft Enterprise does not automatically update the topology when alert details change. Click the Refresh icon on the right side of the topology view to update the topology.