Self Monitoring
Administrators can use Self Monitoring to view the status, health, and processing metrics of the Moogsoft Enterprise processes. The different tabs show the state of Processing Metrics, Event Processing, Web Services, Event Ingestion and Message Bus.
Heartbeats are one of the key concepts in Self Monitoring. A heartbeat is an internal message sent by a process every 10 seconds to inform Self Monitoring that it is still running.
All data displayed in this screen is live and updates continually.
Package States
The table below describes the possible states for a package:
Icon | Description |
Green circle with a white check. | The process is running (reserved or unreserved*). |
Yellow circle with a white exclamation mark. | The reserved process has missed some heartbeats. This could indicate a potential problem and should be investigated. |
Red circle with a white cross. | The reserved process is either not running or has missed its last heartbeat. This could indicate the process has failed, has not started or that Moogsoft Enterprise is not working properly. |
Gray circle with a white backslash. | The unreserved process is not running. |
White circle with a green check. | The process is in passive mode. This is for High Availability deployments only. See High Availability Overview for more information. |
You can set processes as reserved or unreserved in the system.conf file ($MOOGSOFT_HOME/config/system.conf. If a package's 'reserved' setting is 'true', the self monitoring reports a warning if the package is not running. Stopped unreserved processes do not generate warnings.
Self Monitoring Tabs
The Self Monitoring screen is divided into a number of tabs. Each section displays the states of the various processes, indicating which are running or which have issues:
Processing Metrics
Event Processing
Web Services
Event Ingestion
Message Bus
Processing Metrics
This tab, which is open by default when Self Monitoring is launched, displays event processing times and other metrics.
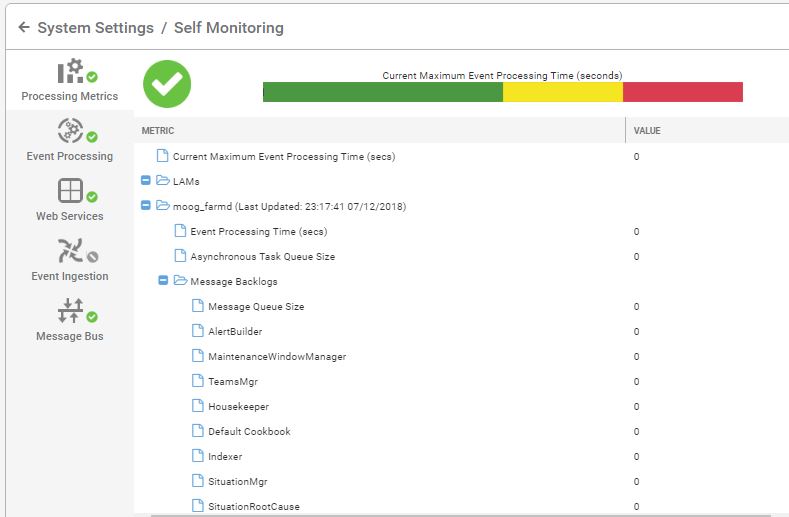
The icon in the top left corner indicates the overall state of event processing. This is determined by the Current Maximum Event Processing Time in seconds. This time is indicated by the position of the gray bar on the colored bullet graph shown below. The Current Maximum Event Processing Time is 1.917s in this example:
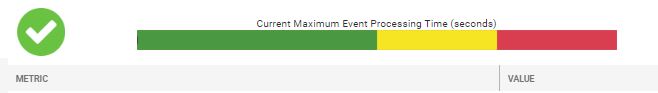
The default bullet chart color values are as follows:
GREEN (0 - 10 seconds) Good performance
YELLOW (10 - 15 seconds) Marginal performance
RED (15 - 20 seconds) Poor performance
The numeric value itself may not be an absolute measurement of health, so as a general rule, look for unusual or sudden changes in the values or behavior. See the examples below:
If a particular LAM becomes a data flow bottleneck, expect to see substantial increases in the values for the Message Queue Size and/or Socket Backlog metrics for that LAM. This leads to an increasing Event Processing Time for the appropriate Moogfarmd (which is expecting data from the LAM).
If one of the Moolets in a Moogfarmd instance, e.g. the Event Workflow, Enrichment Workflow, etc. becomes a data flow bottleneck, expect to see a substantial increase in the Message Backlog and possibly the Messages Processed decreasing for that moolet. This also leads to an increasing Event Processing Time for the Moogfarmd.
Additionally it is important to ensure all the Moogsoft servers have their system closely time-synchronised. Invalid/historic timestamps in the events themselves can also cause an increasing Event Processing Time for the overall processing time.
All of these can result in the bullet chart showing an increasing Current Maximum Event Processing Time, from green to yellow to red.
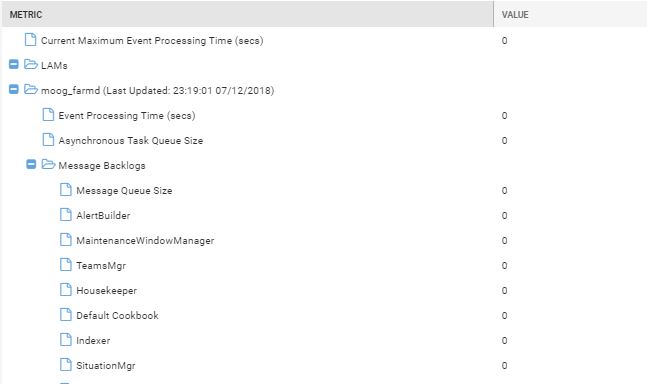
Using Processing Metrics
To use the Processing Metrics tab, open the LAMs and moog_farmd folders and look for deviations from normal values.
The numeric value itself may not be an absolute measurement of health, so as a general rule, look for unusual or sudden changes in the values or behavior. See the examples below:
If a particular LAM becomes a data flow bottleneck, expect to see substantial increases in the values for the Message Queue Size and/or Socket Backlog metrics for that LAM. This leads to an increasing Event Processing Time for the appropriate Moogfarmd (which is expecting data from the LAM).
If an AlertRulesEngine in a Moogfarmd instance becomes a data flow bottleneck, expect to see a substantial increase in the Message Backlog and possibly the Messages Processed decreasing for that AlertRulesEngine. This also leads to an increasing Event Processing Time for the Moogfarmd.
Both of these result in the bullet chart (at the top) showing increasing Current Maximum Event Processing Time, from green to yellow to red.
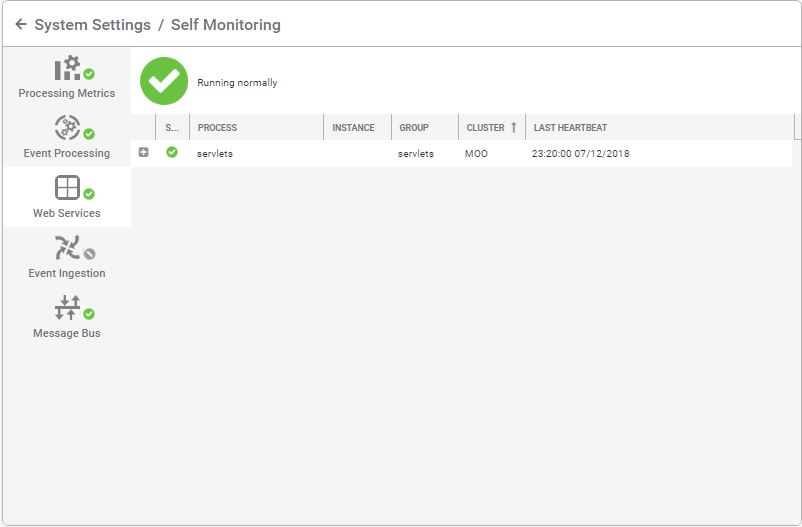
Event Processing
This tab contains a process group including Moogfarmd (the core Moogsoft Enterprise application) and the Moolets, such as AlertBuilder, Alert Rules Engine, Sigalisers.
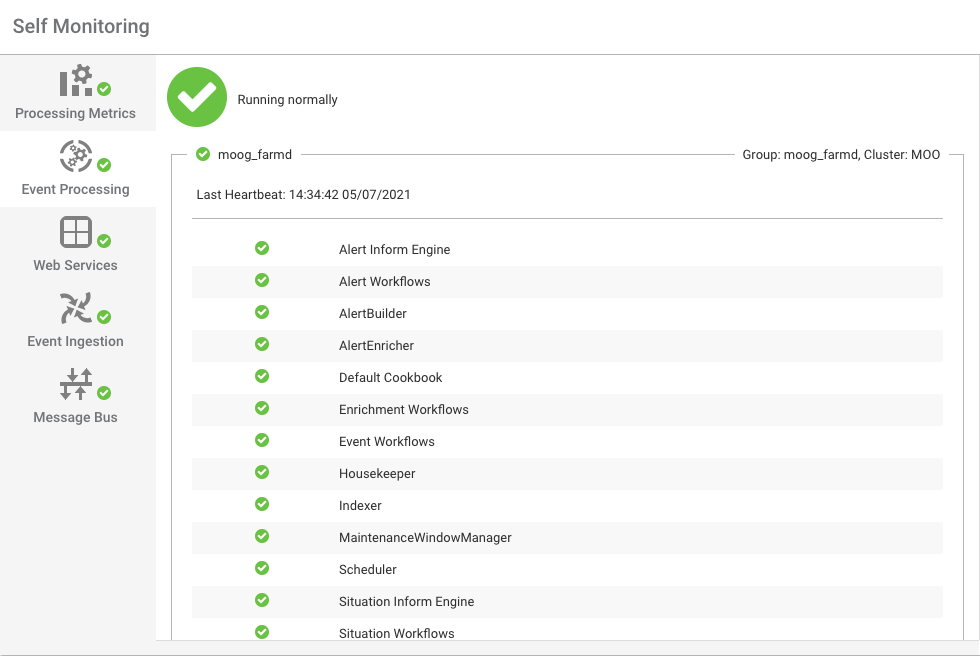
The icon in the top left corner indicates the overall state (running normally in the example above). The group and cluster names are displayed in the top right corner. The time and date of the last heartbeat is displayed above the list of Moolet processes.
Web Services
This tab contains all processes related to Tomcat web applications: moogsvr, moogpoller, toolrunner and Graze.
Each row displays the following information:
Column | Description |
+ | Click this button to expand or collapse the row for further information. For example 'No reported problems'. |
State | This shows an indicator icon showing whether or not the process is running as normal. |
Process | The name of the Moogsoft Enterprise component. |
*Instance | The name of the instance (in High Availability there are multiple instances of Moogsoft Enterprise). |
*Group | The name of the Process Group the component belongs to. |
*Cluster | The name of the Cluster the component's Process Group belongs to. |
Last Heartbeat | The time of the last received heartbeat. A heartbeat indicates a health component. |
Note
* These only apply to High Availability deployments where there are more than one instance of Moogsoft Enterprise and its component processes.
Event Ingestion
This tab displays information about the state of all processes relating to the LAMs and the individual processes which process raw data and create events:
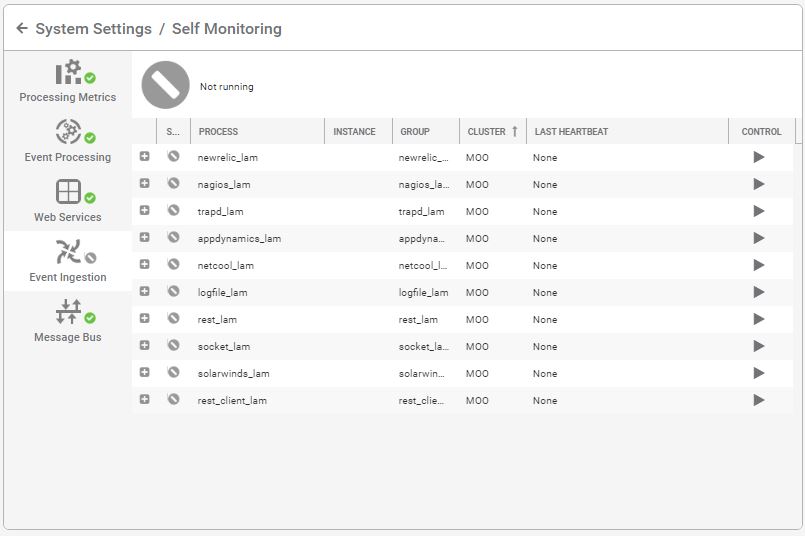
The controls in the far right column can be used to stop and restart active LAM processes or to start inactive LAMs.
Message Bus
The final tab provides a link to the Message Bus Console, also known as the MooMs (Moogsoft Messaging System). This is hosted by message-queueing software RabbitMQ.
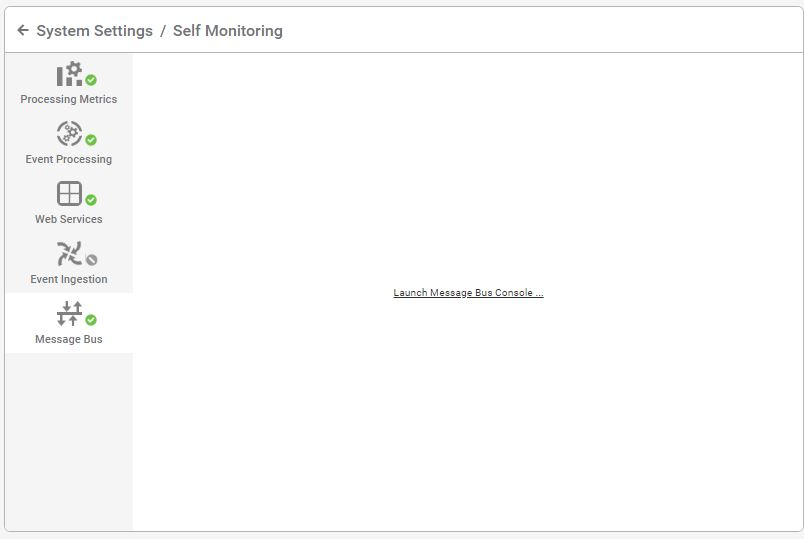
Click the link to proceed to the RabbitMQ management console.
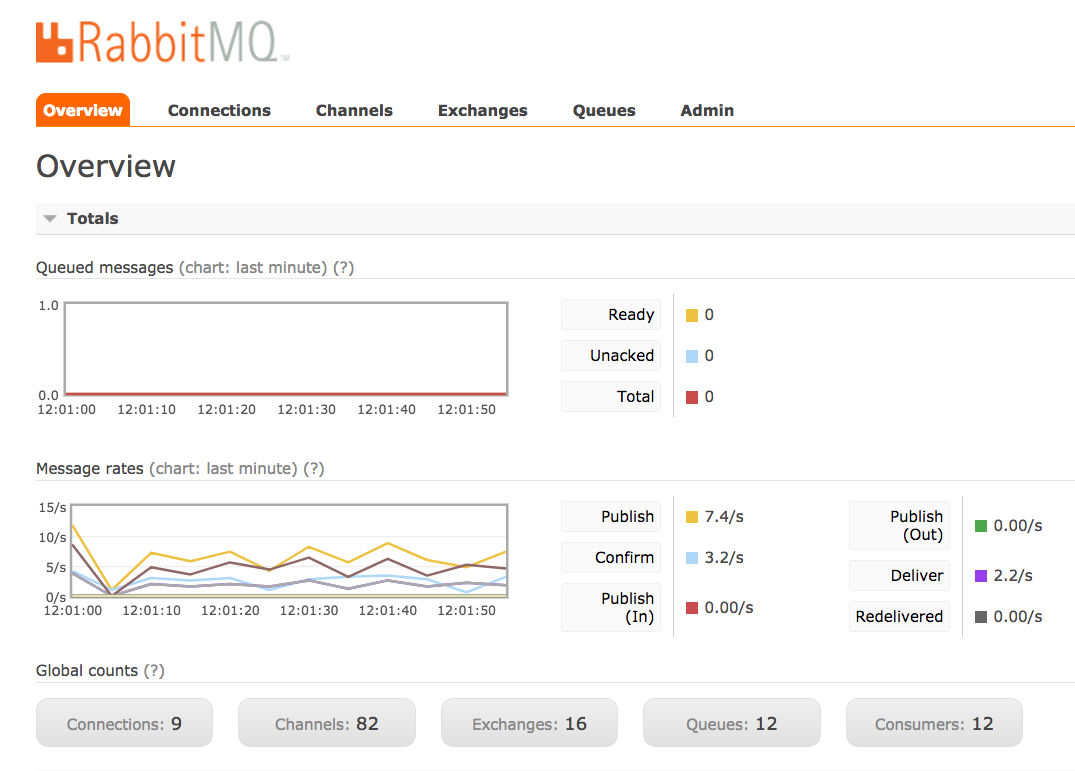
The username and password to log in are specified and can be configured in $MOOGSOFT_HOME/config/system.conf (under mooms.username and mooms.password in the JSON) and correspondingly in RabbitMQ. See Configure the Message Bus for more information.
Once logged in, RabbitMQ displays information about message rates, connections, channels, queued messages, etc.
Configuration
The 'Restart/Stop/Start' feature uses the moogfarmd/LAM service scripts under /etc/init.d, for example, /etc/init.d/moogfarmd and /etc/init.d/logfilelamd, in combination with the Apache Tomcat 'toolrunner'.
You need Super User role permissions to configure this feature. Create a user in the 'moogsoft' group. This user must be used by the toolrunner and the services in order to start/stop services via the UI. For example:
/etc/init.d/moogfarmd- PROCESS_OWNER set to 'controluser'$MOOGSOFT_HOME/config/servletsn.conf- toolrunneruser set to 'controluser' (toolrunnerpassword needs to be the password for that user)
Moogsoft recommends that you do not use the default 'moogsoft' user because that is a system user and does not allow you to log in using a password. Update the /etc/init.d/ service scripts to have the correct:
SERVICE_NAME (to make the services unique)
PROCESS_OWNER (must be the same user as the toolrunner user)
INSTANCE/CLUSTER/GROUP (unless already configured via relevant the LAM/Moogfarmd/system.conf configuration file). These need to be provided to the 'daemon' lines as command line parameters. For example
--instance MY_INSTANCE --group MY_GROUP --cluster MY_CLUSTER.
Add the name of the service script into the 'service_name' field in $MOOGSOFT_HOME/config/system.conf for that Moogsoft Enterprise process. To ensure the service appears in the right Self Monitoring tab, the process_type field must be set. See the default system.conf file for examples.
If a Moogfarmd service or LAM service is run that does not match a configuration block in system.conf/'processes', then it still appears within the UI 'Self Monitoring' dialog, but it is not possible to start/stop/restart the service.
The 'toolrunner' is used to control the services (requires configuring $APPSERVER_HOME/webapps/toolrunner/WEB-INF/web.xml):
The 'toolrunneruser' must match the PROCESS_OWNER specified within the relevant service script. This is because only root can run services as a different user.
The 'toolrunnerpassword' must be the password of the 'toolrunneruser'.
The 'toolrunnerhost' value must match the host of the machine which contains the moogfarmd/LAM services and the PROCESS_OWNER user.
It is more likely that an existing LAM/Moogfarmd service will have been run already in upgrade scenarios. If the service is one which needs to be controlled via the UI, then the service log file and PID (if present) need to be 'chowned' to the new service script PROCESS_OWNER/toolrunner user before it will work. For example:
chown toolrunneruser /var/log/moogsoft/moogfarmd.log
See the example of a $MOOGSOFT_HOME/config/system.conf file below:
{
"group"         : "moog_farmd",
"instance"      : "",
"service_name"  : "moogfarmd",
"process_type"  : "moog_farmd",
"reserved"      : true,
"subcomponents" :
    [
        "Event Workflows",
        "AlertBuilder",
        "Default Cookbook",
        "Journaller",
        "TeamsMgr"
        #"Alert Workflows",
        #"SituationMgr",
        #"Notifier"
    ]
},