Review and Adjust Clustering Settings with Situation Visualization
The Visualize tab in Situation Rooms allows administrators and implementers to see:
The Cookbook and Recipe used to create the Situation.
A visual representation of the similarity of the alerts within the Situation to the reference alert. The reference alert is either the seed alert, if a Cookbook Recipe is configured this way, or it is the first alert that the clustering algorithm assigned to the Situation. For more information on seed alerts see Configure Topology-based Clustering with Vertex Entropy.
A list of all the associated alerts in the Situation.
You can use this information to adjust your Moogsoft Enterprise configuration to improve the relevance of the Situations it creates.
The Visualize tab automatically updates when new alerts are added to a Situation.
To view the Visualize feature, go to a Situation Room and click the Visualize tab.
Note
Currently, Moogsoft Enterprise does not fully handle alerts that a user has manually added to a Situation. For example, manually added alerts do not display in a similarity diagram if their similarity to the reference alert is below the threshold for a component but they will appear in another diagram if their similarity is above the threshold for that component.
Similarity diagrams
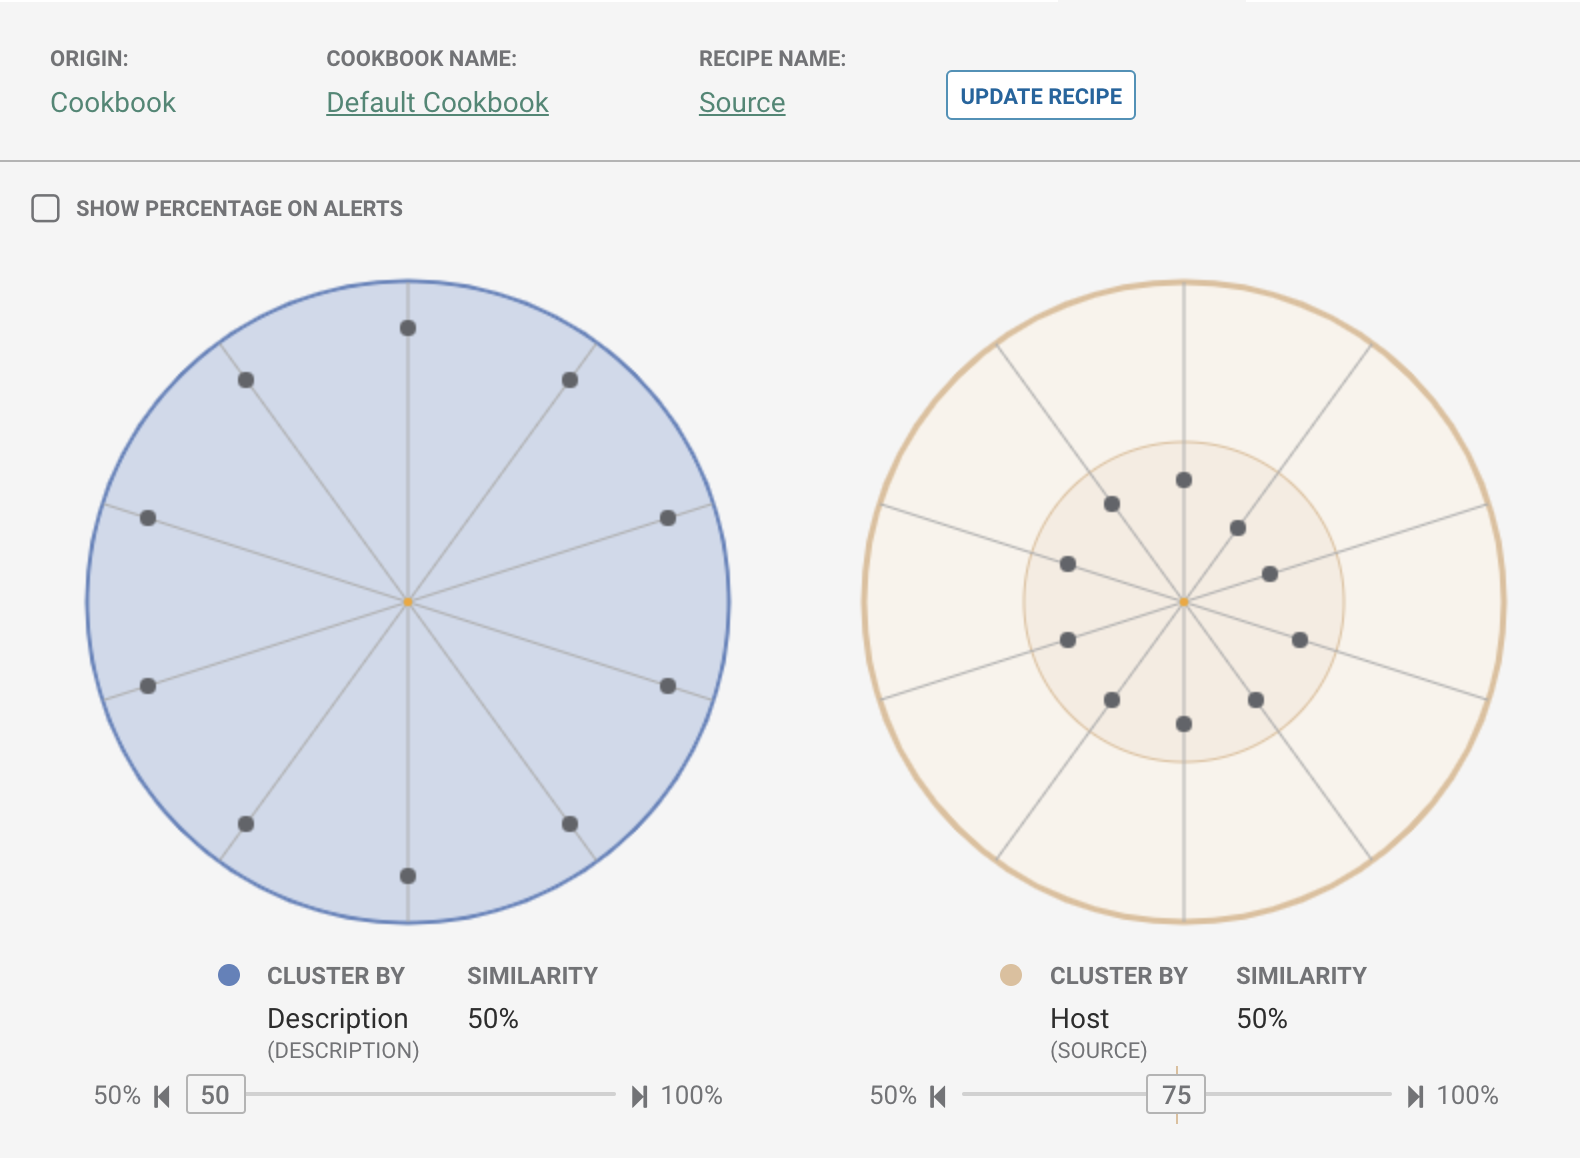
The Visualize tab shows diagrams of the alerts in the Situation according to how the Cookbook Recipe has clustered them. In the example below, this Situation has ten alerts that are clustered by two components: Description and Host. The Cookbook Recipe clusters alerts whose description is at least 50% similar to the reference alert and whose host is also at least 50% similar to the reference alert. The reference alert may be a seed alert or the first alert that the Cookbook Recipe added to the cluster.
Each diagram shows the similarity of the alert to the reference alert for one of the components. Each alert displays as a dot on the diagram on a spoke representing the sequence it was clustered into the Situation. The reference alert has a similarity of 100% and displays at the center of the circle. Alerts with a high similarity display closer to the center of the circle and alerts with a low similarity display nearer the edge of the circle. In the example below, alerts that are only 20% similar would display at the edge of the circle.
Representation of the alert in the center of each diagram is as follows:
Yellow dot: Single reference alert, with no other alerts having 100% similarity.
Blue dot with a single concentric blue circle: Reference alert plus one alert which has a 100% similarity match to the reference alert.
Blue dot with two concentric blue circles: Reference alert plus two or more alerts which have a 100% similarity match to reference alert.
You can perform the following actions on the similarity diagrams:
Hover over an alert in a diagram to display the similarity of that alert to the reference alert for that field.
Click on an alert in a diagram to display the details of that alert in a pane on the right hand side of the window.
Use the sliders below each diagram, or click and drag the concentric rings in the diagrams, to increase the similarity value. Alerts that are outside the selected similarity appear gray. This feature enables you to determine whether a higher similarity would improve the Situation. In the example above, the Cookbook Recipe clusters alerts into a Situation if the Host has more than 50% similarity to the reference alert. You may find that alerts with a similarity of less than 80% are not really relevant to the Situation. In this case, you could consider changing the Host similarity to 80%.
Step to the next highest or lowest alert similarity value using the quick jump arrows at either end of the sliders.
Updating the Recipe
Once you adjust the slider values you can save the changes to the Cookbook Recipe that generated the Situation by clicking Update Recipe.
When you are using the sliders to move the threshold around, a vertical line appears to indicate the saved similarity value. If you update the recipe, the line relocates to the newly saved similarity value.
Alert list
The Visualize tab displays a list of all the alerts in the Situation. The reference alert is pinned to the top of the alert list and highlighted with an orange marker. Alert fields used for Situation clustering are pinned to the left side of the list.
Any alerts that are grayed out when you adjust the similarity threshold are also filtered out of the alert list. Alerts are filtered out when they are grayed out in any of the diagrams.
You can enter a filter in the Filter field to display alerts in the Situation that match it. See Filter Search Data for information on creating filters.