Configure Entropy Thresholds with Alert Analyzer
The Moogsoft Enterprise Alert Analyzer provides an interactive graph that shows the impact of various entropy thresholds to reduce noise in your system. By experimenting with the impact of various threshold values, you can make an informed decision about the number of alerts included or excluded from Situations based upon entropy threshold. For a general overview of entropy, see Entropy.
The entropy threshold is a value that you can use in a Cookbook or in Tempus to qualify an alert for inclusion in a Situation. The types of entropy threshold you can set are as follows:
Global Default Threshold: Applies to all alerts from all managers in the system. If an alert exceeds the threshold, it is a candidate for inclusion in a Situation cluster according to the clustering algorithm definition.
Manager-specific Thresholds: Applies to alerts from a single manager. If a manager threshold exists, the clustering algorithm prevents alerts from clustering if they do not surpass the manager-specific threshold. If no manager exists for an alert's manager, the clustering algorithm applies the global default threshold.
Specific Threshold: Use this option to set a specific threshold value.
Do not use a Threshold: Select this option if you do not want to apply a threshold.
You can set either type of threshold as one of the following:
Percentage of System Excluded: Controls the entropy threshold dynamically using a percentage value of the number of alerts to eliminate from Situation clustering. Normally it is a good idea to use a percentage value because it accounts for expected changes to entropy values over time.
Threshold Entropy Value: A static entropy value to qualify alerts for inclusion in Situation clustering. If you set a static value for an entropy threshold. it is a good idea to regularly review the value and its impact on excluded alerts every few weeks.
When you use Alert Analyzer, you can toggle between the two settings. The UI displays a locked padlock for the active threshold configuration. For example 26.5% Percentge of System Excluded. The unused configuration shows as unlocked because the unused configuration varies based upon the fixed value of the active configuration.
View and configure entropy thresholds
After you have about two weeks worth of data, you can use the Alert Analyzer to view the alert distribution in the Alert Analyzer and see how to best reduce noise for your system. The Alert Analyzer displays alert model data based on your entropy generation configuration, by default two weeks. See Configure Entropy Generation Schedule for more information.
The following figure highlights the primary features of the Threshold Statistics graph for the Global Default Entropy Threshold:
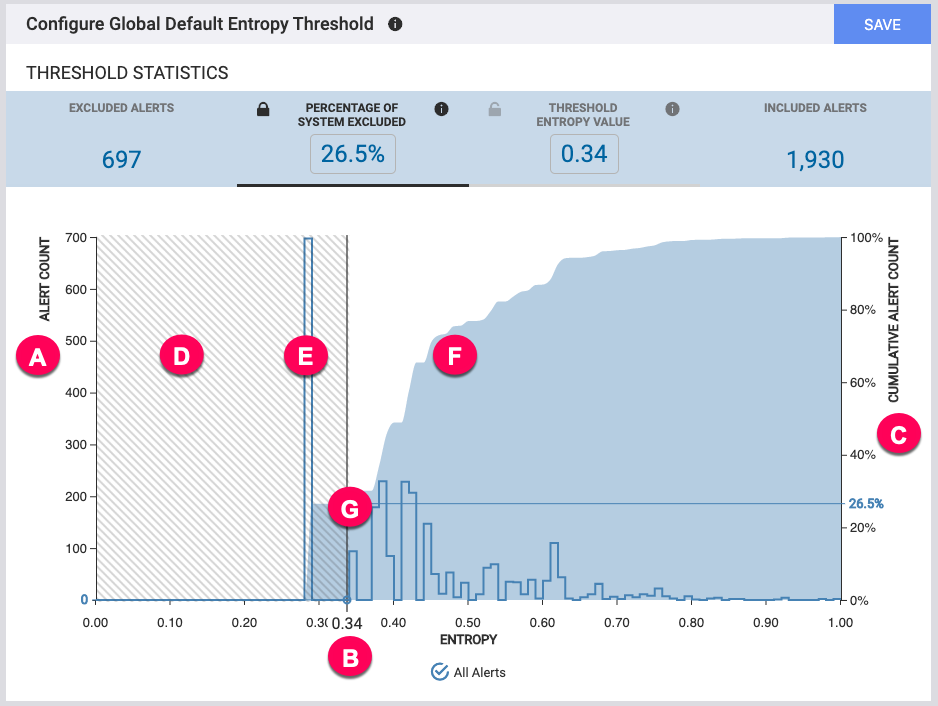
A. Alert Count: The left axis shows the alert count for the histogram line, which represents the number of alerts at each entropy level. For example there are about 100 alerts with an entropy value just above 0.34.
B. Entropy: The bottom axis of the graph shows the calculated entropy value, which ranges from 0 to 1. When you use Threshold Entropy Value, the slider sets the value according to placement on this axis. You can also enter the value using the boxes in the threshold statistics bar above the graph.
C. Cumulative Alert Count: The right axis of the graph shows the percentage of total alerts in the model, represented by the line graph. It shows the cumulative percentage of alerts below each entropy level. For example about 26.5% of all alerts in the model have an entropy value of .34 or lower. When you use Percentage of System Excluded, the slider sets the value according to placement on this axis.
D. Shaded Area: The shaded area to the left of the slider represents alerts that would be excluded by the current entropy threshold setting.
E. Histogram: The histogram shows the number of alerts at a given entropy level. For example there are about 100 alerts with an entropy value just above 0.34.
F. Line Graph: The line graph shows the percentage of total alerts in the model for each entropy level. For example about 26.5% of all alerts in the model have an entropy value of 0.34 or lower.
G. Slider Bar: The slider bar lets you visualize the impact of various entropy threshold settings on noise reduction. Alerts that fall into the shaded area and are excluded from clustering based upon the Percentage of System Excluded or the Threshold Entropy Value. For example, the slider in the figure shows 26.5% alerts excluded. When you set the slider, the UI updates the total values for Excluded Alerts and Included Alerts. It also updates the alerts for review in the Review Window.
Configure subset thresholds
The UI to configure manager-specific subset thresholds is similar to the Global Default Entropy Threshold, with a few modifications:
The Subset Definition lets you pick the manager to which the threshold applies.
There are two statistic bars: Global Statistics that show how the manager threshold affects the overall system alerts and Subset Statistics that show how the manager threshold affects alerts from the manager subset.
The chart displays graphs for both the global statistics and the statistics for the manager subset. Un-check the All Alerts checkbox to hide the global statistics.
Review affected alert details in the Review Window
When you set an entropy threshold, either in the Global Default Threshold or a Subset Threshold, the UI displays a list of affected alerts in the Review Window. This way you can drill-down to identify the impact of your entropy threshold selection on specific types of alerts.
By default the window displays excluded alerts from the reference model. You can toggle between reference data and the potential impact on live data. You can also toggle to view included alerts instead of excluded alerts. Use the filter to drill into a specific set of alerts affected by the threshold without changing the threshold itself.
Learn more
See the following topics to learn more about entropy in Moogsoft Enterprise: