Analyze the Situation Timeline
The timeline offers a powerful graphical view displaying the progression of a Situation with a breakdown of its associated alerts in the order they occurred alongside key activity markers.
Use the timeline to analyze the Situation, see how it developed and determine the hotspots where there are higher volumes of more severe alerts.
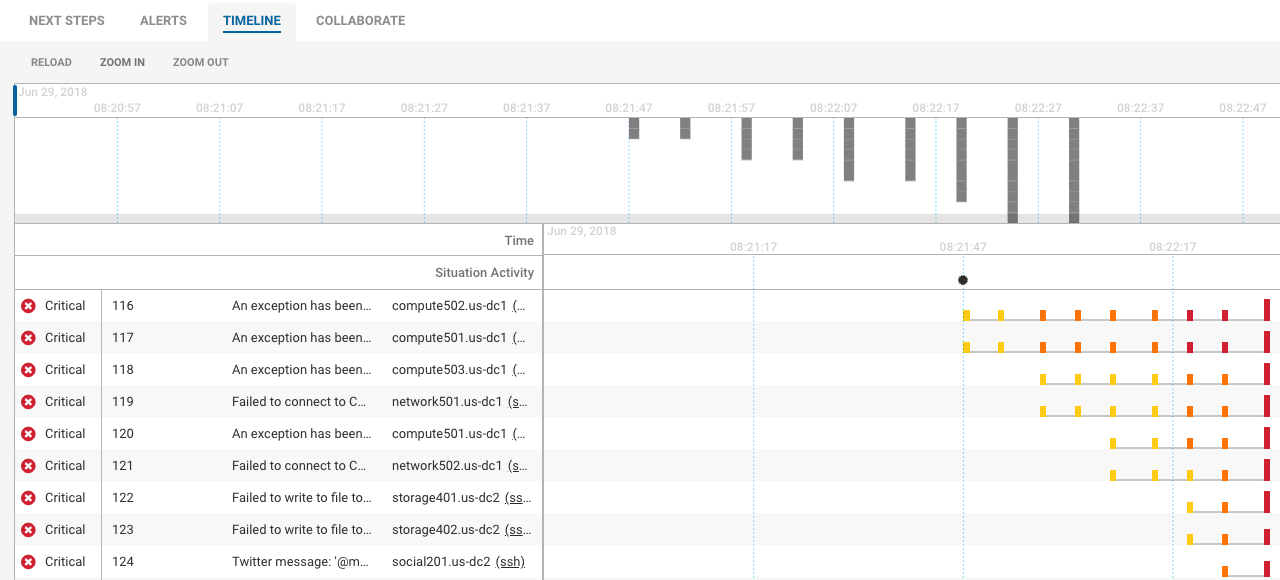
Situation severity is determined by the highest severity of its alerts. In the example above, the Situation is critical because it contains Critical alerts, which is the highest severity.
View Situation activity
The Situation Activity panel shows activity markers at times where different things happened following the creation of the Situation.

The number indicates how many Situation activities occurred. Click on any of the activity markers for more details of what happened at that time.
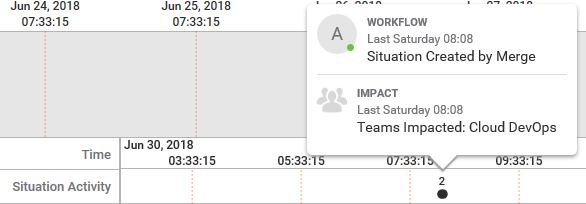
In the screenshot above there are two notifications for the situation. The activity marker icons will differ depending on the type of activity that occurred.
View alerts and event details
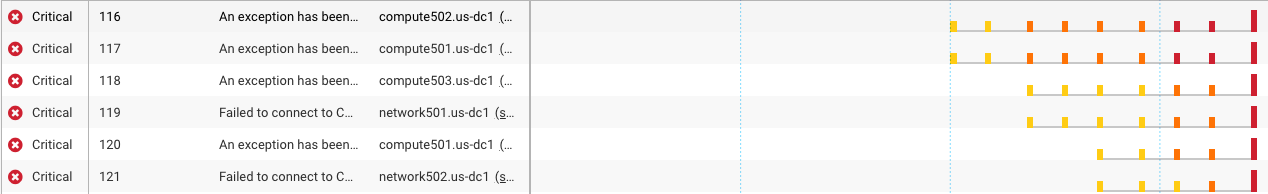
The alerts are displayed in graphical form on the bottom of the Timeline tab, with each alert represented by a rectangular block the color of its severity.
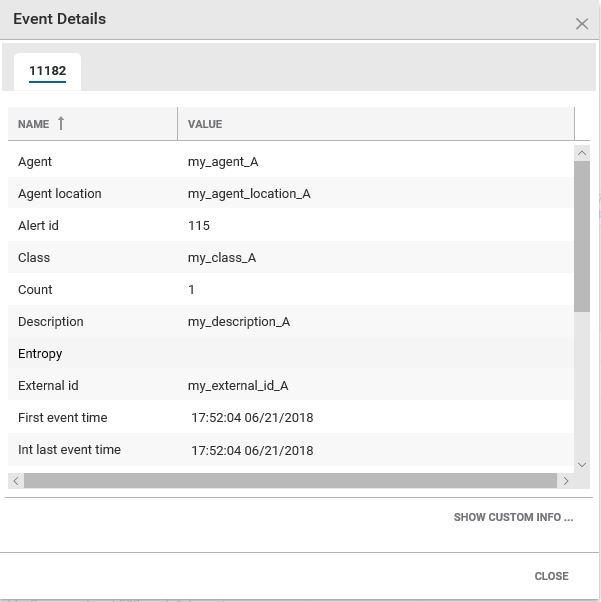
Each alert contains details of the events within it. Click on one of the timeline blocks to open the Event Details window for that event.
Show and hide leading events
By default, the timeline does not show events that occurred before the Situation was created. To see these events, click Show > Show leading events. The UI maintains your selection when you view other Situation timelines.