Alerts Overview
Alerts represent new instances of events or de-duplicated events that have been created by Moogsoft AIOps. You can view these in filterable and sortable lists, via the Side Menu links, from the Search bar or by looking within Situation Rooms.
The highest severity alert within a Situation determines the severity of a Situation. Alerts follow the same severity levels as Situations.
Alert views
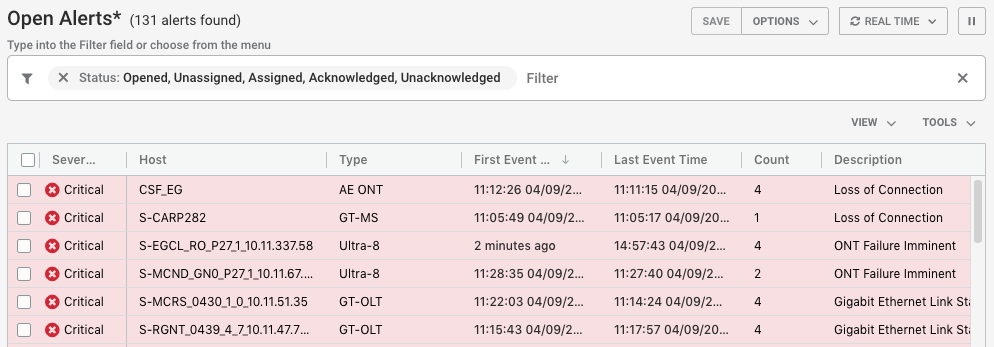
The My Alerts View displays all of the alerts that have been assigned to you. The Open Alerts view displays all open alerts that are yet to be resolved.
Select refresh rate
You can choose how frequently you want your Situations View to refresh. Click on Real Time and select an option from the drop-down list.
Moogsoft AIOps remembers the refresh rate that you selected when you log in again.
Pause alerts and Situations
Alert View menu
You can select the columns you want to display using the View menu. See the Configure an Alert View for more information on the different options.
Alert details
You can explore the forensic details of an alert in Alert Details:
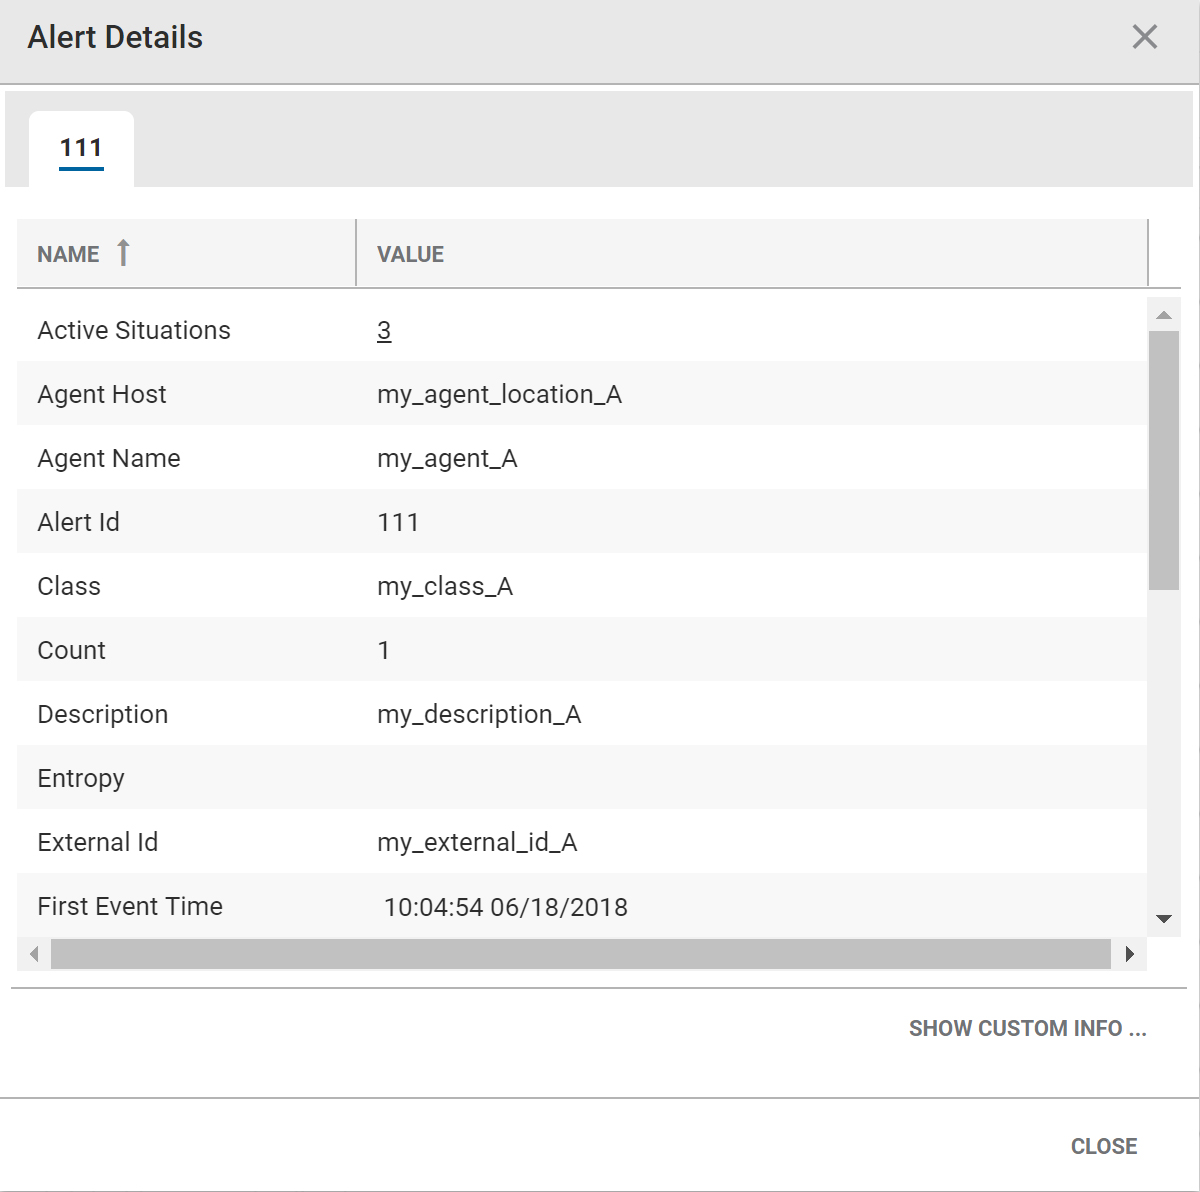
The individual column names and their descriptions are listed in the table below:
|
Name |
Description |
|
Active Situations |
All active Situations to which this alert is linked. |
|
Agent Host |
The IP address or co-ordinates of the geographic location where the events were detected. |
|
Agent Name |
The name of the monitor that detected the Events. Frequently a sub-category of Manager. |
|
Alert Id |
This is the numeric identifier given to the alert. |
|
Class |
The subcategory of the Agent. |
|
Count |
The number of events in the alert. |
|
Description |
A text summary or description of the alert. |
|
Entropy |
The entropy value (between 0 and 1). |
|
External Id |
The external ID given by another management system to reference the alert. |
|
First Event Time |
The time of the first event that Moogsoft AIOps recorded. |
|
Host |
The source where the alert originated. |
|
Internal Last Event Time |
The internal time recorded within the last event itself. |
|
Last Change |
The time of the last change to the alert. |
|
Last Event Time |
The time of the last Event that Moogsoft AIOps recorded. |
|
Manager |
The system sending the alert. |
|
Owned By |
The username of the User who owns the alert. |
|
Severity |
The severity of the alert. |
|
Significance |
The significance of the alert. |
|
Situations |
The Situations that the alert is associated with. |
|
Source Id |
The unique number of the source being managed. |
|
Status |
The status of the alert. |
|
Type |
The alert type. For example, DBFail, HTTPDDown, LinkDown. |
You can copy the Alert Details by clicking and dragging across the text to highlight it. You can use Ctrl+C (⌘+c on Mac) to copy the text. This can be pasted in an external editor or tool as required.
Custom Info
You can view custom fields for the alert in the Custom Info tab. This appears in a page tree format. Click the drop-down arrows to view the properties beneath each branch.
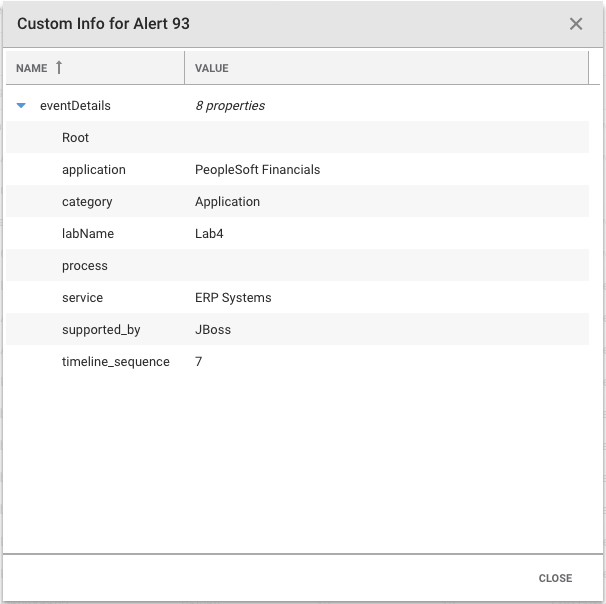
Administrators can add custom info fields during system configuration. They can also add custom info fields with a Situation Client Tool using a JSON snippet under the 'Merge Custom Info' field.
Configure an Alert View
Use the View menu to customize which field columns are displayed in My Alerts or Open Alerts or an Alert filter view. Click View in the top right corner of the screen to view and select the options in the drop-down menu.
View options
The top option, 'Alert Row Striping', changes the filter display and each alert row is a colored stripe depending on its severity:
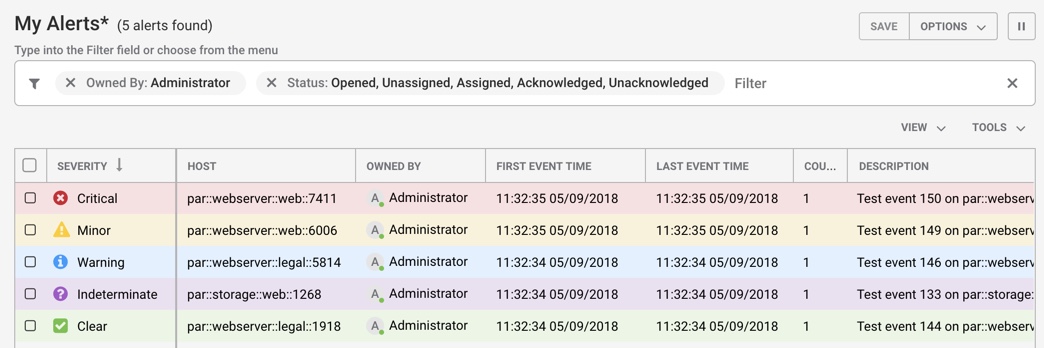
You can add or remove the following alert columns by checking or unchecking the options in the View drop-down menu:
|
Column |
Description |
|
Active Situations |
Any active Situations the alerts are linked to. |
|
Agent Host |
IP address or co-ordinates of the geographic location where the events were detected. |
|
Agent Name |
Name of the monitor that detected the events, frequently a sub-category of Manager. |
|
Alert Id |
Numeric alert ID. |
|
Class |
Subcategory of the Agent. |
|
Count |
Number of times this alert has been counted. |
|
Description |
A text summary or description of the alert. |
|
Entropy |
Entropy value of the alert, a number between 0 and 1. |
|
External Id |
External ID given by another management system to reference the alert. |
|
First Event Time |
Time when the alert's first event was recorded. |
|
Host |
Source where the alert originated. |
|
Internal Last Event Time |
The last time and date there was an internal change to the alert. |
|
Last Change |
The last time and date there was a change to the alert. |
|
Last Event Time |
Time when the alert's last event was recorded. |
|
Manager |
System sending the alert. |
|
Owned By |
User that owns the alert. |
|
Significance |
Significance of an alert, whether it is Collateral, Related, Impacting or Causal). |
|
Situations |
All of the Situations that the alert is linked to. |
|
Source Id |
The unique name of the source being managed. |
|
Status |
Alert status, whether it is Unassigned, Assigned or Acknowledged. |
|
Type |
Alert type. For example, DBFail, HTTPDDown or LinkDown. |
Change columns and rows
To change the width of a column:
-
Hover your mouse cursor over the line between the columns in the heading row.
-
Click and drag it to increase or decrease the width of the column.
To change the order of the columns:
-
Click and hold down the heading cell of the column you want to move.
-
Drag the heading to a new location in the heading row. Two green arrows indicate if the move is valid.
To change the sort order of the alerts:
-
Click the column heading. Click once to display them in ascending alphabetical and numerical order, or click twice to display them in descending order.
You can sort on up to four columns including the ID. In addition to your selected sort columns, Moogsoft AIOps automatically adds ID as the final sort priority. For example, to sort on Description and Host:
-
Click the Host column heading.
-
Then click the Description column heading.
-
The alerts are sorted by Description, then Host and then ID.
Alert tools menu
You can perform other actions on an alert or a group of alerts using the Tools menu or the right-click menu.
To perform an action available on the Tools menu:
-
To select an alert or multiple alerts, click the checkboxes in the far left column.
-
Click Tools or right-click on the alert list.
-
Select the action you want to use.
The following actions are available on the Tools menu:
|
Action |
Options |
Description |
|
Export |
Filename: String Format:
Export:
|
Exports a row, multiple selected rows or all rows in CSV or JSON format. |
|
Own |
- |
Makes you the owner of the selected alert(s). |
|
Assign |
- |
Assigns the selected alert(s) to a user, subject to permissions. |
|
De-Assign |
- |
Deassigns the selected alert(s) from a user. |
|
Acknowledge |
- |
Acknowledges the selected alert(s) and assumes responsibility for it. |
|
De-Acknowledge |
- |
De-acknowledges the selected alert(s) to indicate that you are no longer responsible for it. |
|
Set Severity |
Critical Major Minor Warning Indeterminate Clear |
Changes the severity of the selected alert(s). |
|
Set Significance |
Causal Impacting Related Collateral |
Sets the relative significance of the selected alert(s), initially calculated based on its entropy (a measure of the rarity or uniqueness of this alert) with 'Causal' being the most unique, and 'Collateral' being the least. |
|
Show Details |
- |
Opens the Alert Details pop-up window with more information about the selected alert(s). |
|
Copy |
- |
Copies the displayed columns for the selected rows. You can use the copied information to create a comma-separated file. |
|
Selective Copy |
Dialog box of displayed columns |
Select/deselect columns from the dialog box. Copies the selected rows and columns. You can use the copied information to create a comma-separated file. |
|
Show Timeline |
- |
Displays the Timeline view for the selected alert(s) showing you the time extent of the alert, from when it was first created to its last change. |
|
Tools |
Server Tools... SSH to Host |
Lists the client-side alert tools that you can run. Opens the SSH dialog box so that you can connect to the host using Secure Shell (SSH). |
|
Add to Situation... |
- |
Opens the Add Alerts to Situation dialog box so that you can add the selected alert(s) to a Situation. |
|
Remove from Situation... |
- |
Opens the Remove Alerts from Situation dialog box so that you can remove the selected alert(s) from a Situation. |
|
Move to Situation... |
- |
Opens the Move Alerts dialog box so that you can move the alert(s) to a Situation. |
|
Resolve... |
- |
Opens the Resolve Alerts dialog box so that you can resolve the selected alert(s). It prompts you to submit an entry to the Journal thread of all Situations that the alert is a member of. |
|
Close... |
- |
Opens the Close Alerts dialog box. It prompts you to submit an entry to the Journal thread of all Situations that the alert is a member of. Once an alert has been changed to a closed state it cannot be revived. |
Add alerts to Situations
You can add a single or multiple alerts to a Situation if you think that they are related or it makes sense to do so. To add one or more alerts to a Situation from the alert filter view such as My Alerts or Open Alerts:
-
Select the alert or alerts you want to add to a Situation by clicking the checkbox(es) in the far left column.
-
Right-click on the alerts or click Tools to open the Tools menu and then click Add to Situation.
-
Use the Filter to find the relevant Situations and select the Situation or Situations to add the alert(s) to.
-
Click Done.
Alert workflow
Administrators can assign alerts to different Moogsoft AIOps users, own alerts and add them to Situations.
The standard method of working with alerts is to have an Administrator who assigns alerts to the Users within a team. An alternative is to have a single Administrator who owns Situations and deals with all of their associated alerts. The sections below outline the standard workflow that can be applied to both of these methods.
Assigned alerts
Once an alert has been assigned to you, you will either receive a Notification or it will appear in your My Alerts filter.
After identifying which alerts have the highest priority, typically the alerts with the highest severity, the next step is to Acknowledge them to let others know that you are aware of them. A standard way of working would be to work through all of the day's 'Critical' alerts and resolve those first before working on the days 'Major' and then 'Warning' alerts to prevent them becoming 'Critical' alerts.
To do this, right click in the alert's row or tag it using the checkbox in the far left column and then click Tools > Acknowledge.
Timeline
To access an alert's timeline, right click on it and select Show Timeline.
The timeline shows a graphical view of an alert and a breakdown of the events that were de-duplicated to create the alert. It also displays the severity of each event and the times at which they occurred.
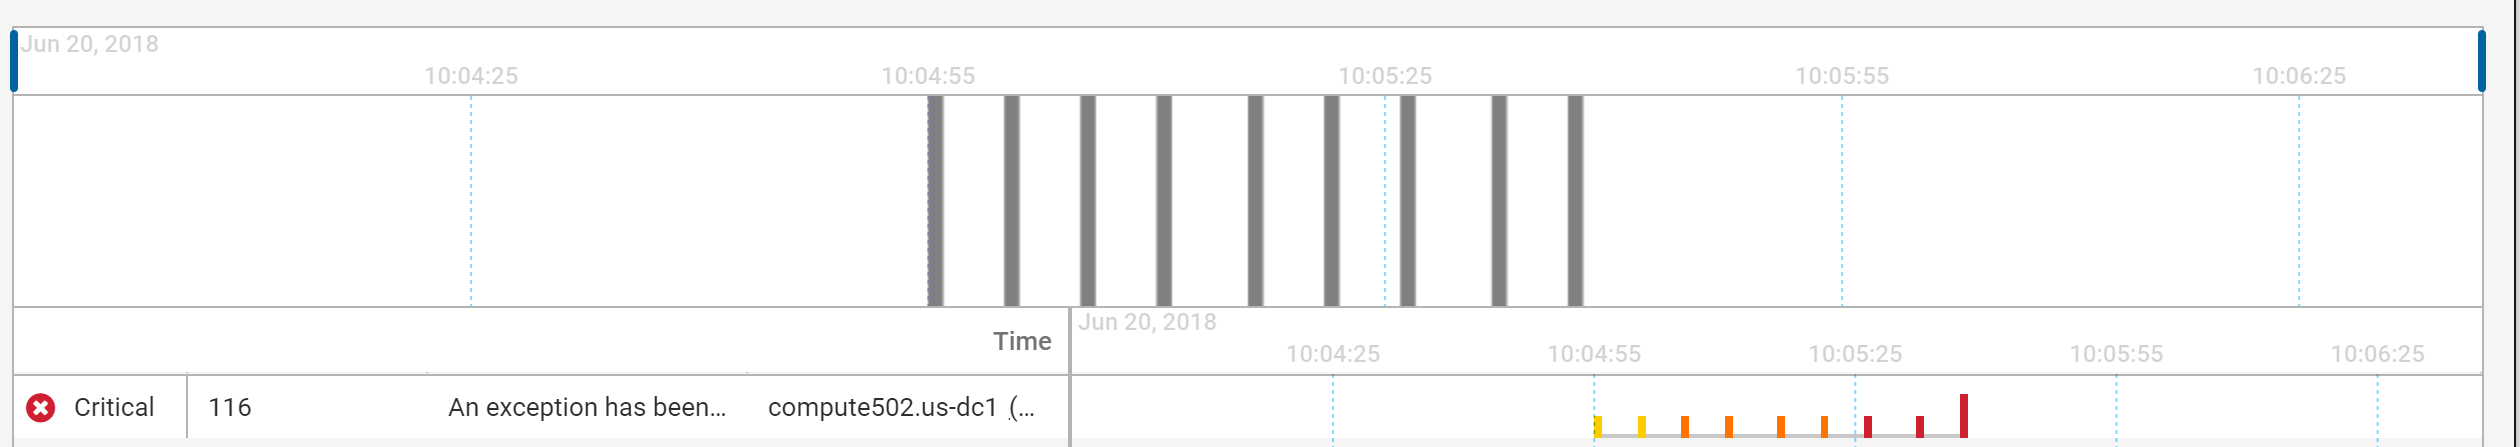
Click the Zoom In or Zoom Out options to focus in on a particular time period or group of events. Alternatively use the blue sliders to focus in on an area of interest. The severity of each event is indicated by the color of the line. For example, the events in the screenshot above are a mixture of indeterminate and critical Events.
The alert's severity is defined by the severity of the latest event rather than the event with the highest severity.
Click any of the colored lines for more information on any event in the timeline. This will open the Event Details window. The Events Details window allows you to explore the forensic details of an event or events.
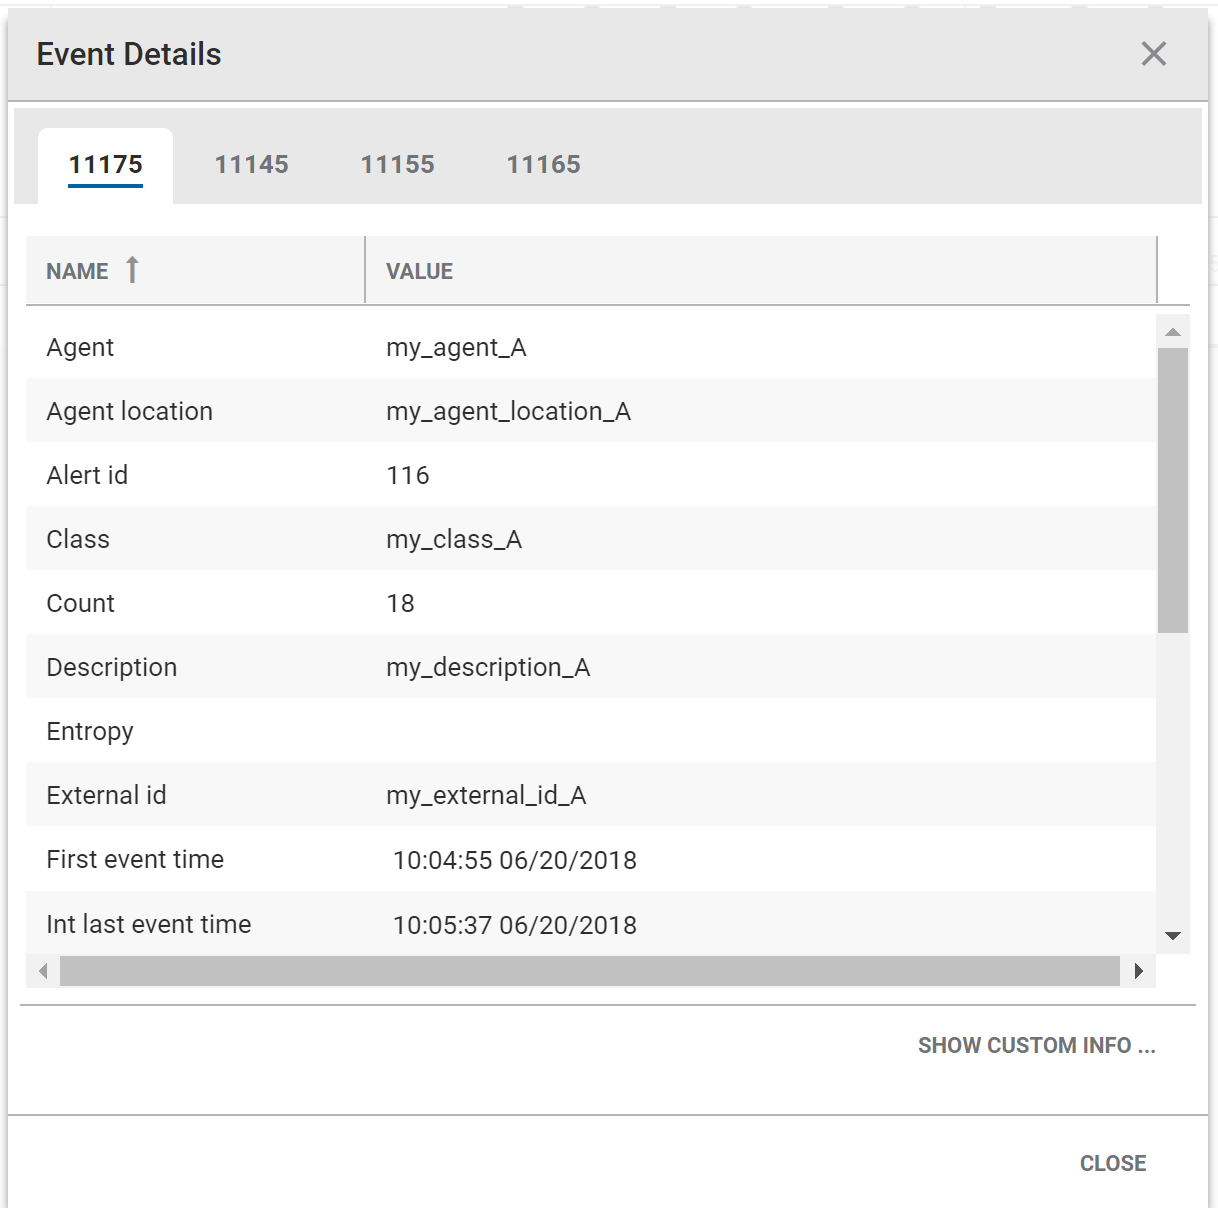
The individual column names and their descriptions are listed below:
|
Name |
Description. |
|
Agent |
The name of the monitor that detected the events. Frequently a sub-category of Manager. |
|
Agent Location |
The IP address or co-ordinates of the geographic location where the events were detected. |
|
Alert Id |
This is the numeric identifier given to the alert. |
|
Class |
The subcategory of the Agent. |
|
Count |
The number of times this alert has been counted. |
|
Description |
A text summary or description of the alert. |
|
Entropy |
The entropy value (between 0 and 1). |
|
Event Id |
The ID given to the event. |
|
Event Time |
The time of the event. |
|
Event Type |
The type of event. |
|
First Event Time |
The time of the first event that Moogsoft AIOps recorded. |
|
Internal Last Event Time |
The time that the last event was recorded by MoogDb. |
|
Last Event Time |
The time of the last event that was recorded by the Agent. This may be set by the LAM or the Alert Builder. The default is when the LAM first registered the event. |
|
Last State Change |
The time of the last event state change. |
|
Manager |
The system sending the event. |
|
Owner |
The username of the user who owns the alert and its events. |
|
Severity |
The severity of the event. |
|
Significance |
The significance of the alert. |
|
Source |
The name of the source machine. |
|
Source Id |
The unique identifier for the source machine. |
|
State |
The state of the event. |
|
Type |
The alert type. For example, DBFail, HTTPDDown, LinkDown. |
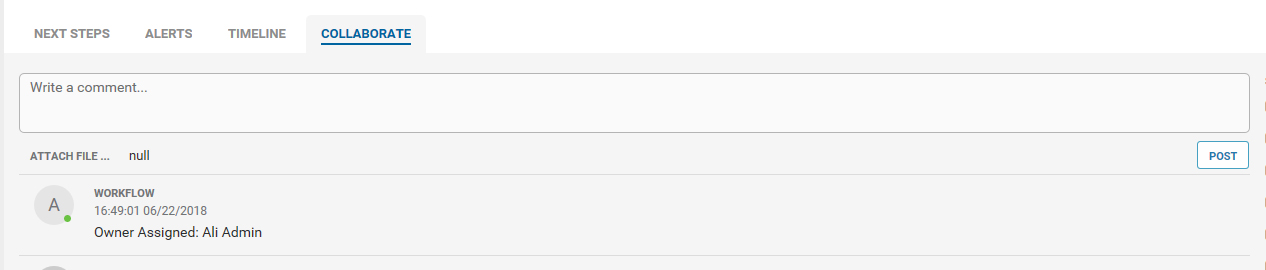
Collaborate
Go to Collaborate in the Situation Room and share comments or ideas with your colleagues to find a resolution.
Ultimately, the aim is to resolve high severity alerts before you resolve the Situation. If anyone proposes a solution, this can be tested using Tools or going back to the My Alerts view and clicking on the Host column to SSH into it.
Resolving steps
If you or another user finds a solution that fixes the problem, the comment should be marked as the Resolving Step. To do this, click the check icon next to the post in Comments or under Collaborate:
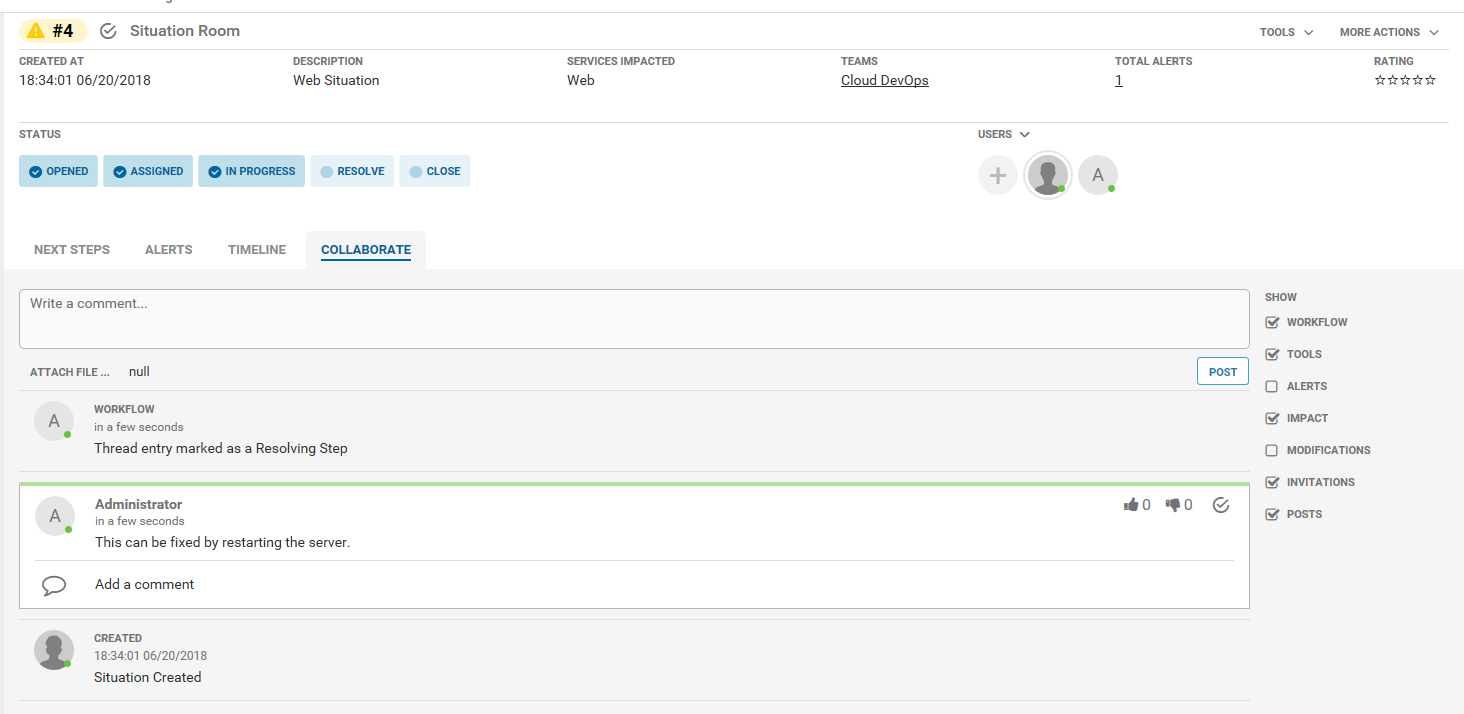
The comment which has been marked as the Resolving Step will be highlighted with a green line. Now a resolution has been found, this Situation can be resolved.
To do this click on the Resolve button under Status in the Situation Room. The 'Resolve Situation' pop-up window will appear:
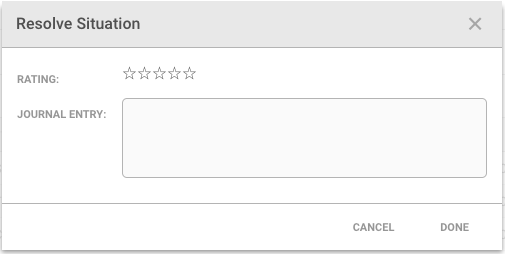
Add a star rating to indicate the relevance and quality of information given in the Situation along with a journal entry comment. Click Done to continue.