Moogsoft AIOps Component Performance
Moogsoft AIOps features the ability to ingest large amounts of event data from various sources, process the data using configurable logic, and display the data to multiple concurrent users. This document outlines the various system components and how their interactions can impact system performance. It includes performance tuning suggestions where applicable.
To learn about opportunities to plan your implementation for increased performance capabilities, see Scaling Your Moogsoft AIOps Implementation.
For information on monitoring your system performance and handling performance issues, see Monitor and Troubleshoot Moogsoft AIOps.
System Component Summary
Moogsoft AIOps comprises several components which have tuning and configuration options available:
-
Integrations and LAMs that listen or poll for data, parse and encode them into discrete events, and then pass the events to the Message Bus.
-
The Message Bus (RabbitMQ) that receives published messages from integrations and LAMs. It publishes messages destined for data processing (Moogfarmd) and the web application server.
-
The system datastore (MySQL) that handles transactional data from other parts of the system: integrations and LAMs, data processing, and the web application server.
-
The data processing component (Moogfarmd), an application that consumes messages from the Message Bus. It processes event data in a series of servlet-like modules called Moolets. Moogfarmd reads and writes to the database and publishes messages to the bus.
-
The web application server (Apache Tomcat) that reads and writes to the bus and the database.
The diagram below shows the general data flow of the components:
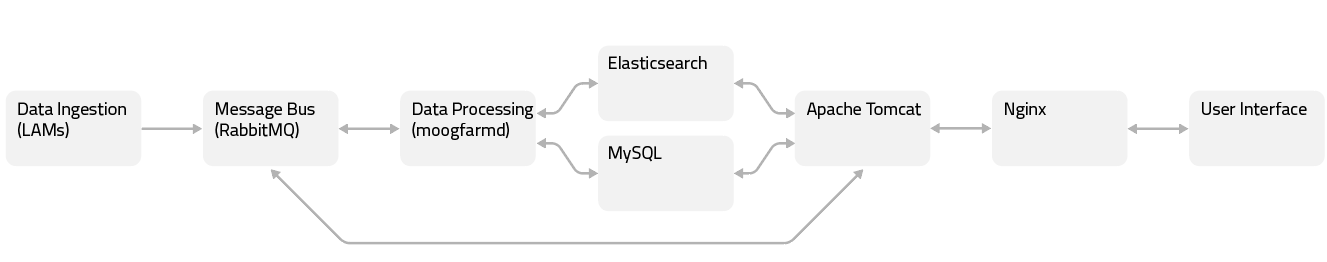 |
Other components include:
-
A proxy (Ngnix) for the web application server and for integrations. See the Ngnix docs for more information.
-
The search engine (Elasticsearch) for the UI that indexes documents from the indexer Moolet in the data processing series. It returns search results to Apache Tomcat. See the Elasticsearch documentation for more information.
Integration Performance
Event data enters the system via integrations and LAMs. Integrations and LAMs running on a large system can normally process up to 10,000 events per secondand publish them to the Message Bus at an equivalent rate. Integrations can buffer events under event storm conditions. The following factors affect the capacity to process events:
-
CPU clock speed and number of available cores.
-
Threads setting.
-
Complexity of the LAMbot logic.
-
Whether you have enabled "guaranteed delivery settings". For example,
rest_response_modefor the REST LAM. -
Log level. For example, DEBUG is the slowest.
You can specify a value for the number of threads in the LAM's configuration file to control the
number of active threads for the integration. To tune the socket LAM, for example, edit socket_lam.conf. Increasing the number of threads can improve ingestion
performance. However it will also result in higher CPU usage and may cause internal buffering.
Buffering increases memory usage until the buffer is cleared.
Message Bus Performance
RabbitMQ is very lightweight and, in all known cases, has been able to process the incoming event rate from Integrations. Refer to the RabbitMQ documentation for its performance tuning options.
Database Performance
Manage and tune your MySQL instance as you would any other database system in your enterprise. In
addition to the standard tuning options in the MySQL documentation, consider the following recommendations
for settings in /etc/my.cnf :
-
On servers with >= 16 GB RAM that run MySQL and Moogsoft AIOps applications ,set
innodb-buffer-pool-sizeto 50% of system RAM. -
On servers where only MySQL is running, set
innodb-buffer-pool-sizeto 80% of system RAM. -
If
innodb-buffer-pool-size> 8 GB, increase theinnodb-buffer-pool-instancesto divide the buffer buffer pool into 1 G (GB) chunks to the maximum supported value of 64 G. For example, if your buffer pool size is 64 GB:innodb-buffer-pool-size=64G innodb_buffer_pool_instances=64
Data Processing Performance
The data processing component for Moogsoft AIOps, Moogfarmd, is the most complex and configurable system component. It offers a range of performance capabilities depending on which Moolets you use and the workload for those Moolets. The following factors affect Moogfarmd performance:
-
Incoming event rate from integrations and LAMs.
-
CPU clock speed and number of available cores.
-
Available memory and
-Xmxsetting of Moogfarmd process. -
Top-level and per-Moolet threads setting.
-
Number of Moolets and their complexity and/or interaction with external services.
-
Database load from other parts of the system, for example API requests.
-
Incoming messages from the Message Bus or other parts of the system.
Moogfarmd buffers messages in message storm conditions. Each Moolet has its own message queue that enables it to handle message storms and process the backlog once the storm has cleared.
You can configure thread allocation for Moogfarmd in the $MOOGSOFT_HOME/config/moog_farmd.conf file as follows:
-
The top-level threads property controls the following:
-
The default number of threads for each Moolet unless you specify a setting for a particular Moolet.
-
The size of the database pool for Moogfarmd to database connections.
-
-
The per-Moolet level threads property allows individual control of the number of threads for a particular Moolet.
Increasing either setting can lead to improved processing performance but will likely increase CPU and memory usage. Too many threads can lead to overload of connections or transactions to the database and impact other areas of the system. For example, increasing the number of threads for the Alert Builder Moolet can improve the event processing rate, but increases load on the database potentially causing deadlocks.
Alert Builder Moolet
The main performance gateway for Moogfarmd is the Alert Builder because it interacts with MySQL the most. In simple configurations with a tuned MySQL database and no other load, you can increase number of threads for the Alert Builder to process up to 2500 events per second and write them to the database at an equivalent rate. The following graph illustrates the performance impact of adding Alert Builder threads for moogfarmd running only with Alert Builder.
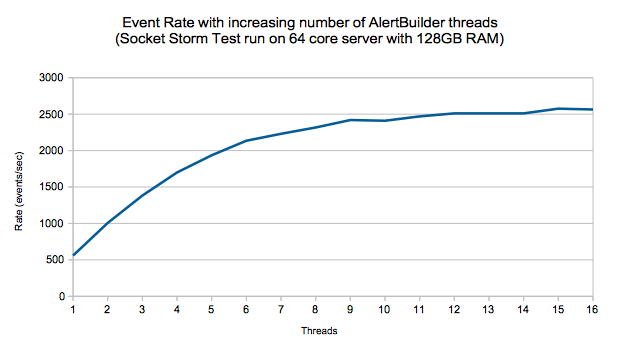 |
This scenario does not account for other database load, other Moolets, or any custom logic added to the Alert Builder Moobot. Event processing would run at about half this rate in a real-world case.
Sigalisers
Moogsoft AIOps clustering algorithms or Sigalisers, employ complex
calculations. Depending on its settings, the Sigaliser can account for a lot of processing time
and memory within Moogfarmd. It is impossible to predict a processing rate for these algorithms
because as they vary greatly according to configuration and workload. Normally Sigalisers do not
add much load to the database except in a burst of Situation creation. Moogfarmd retains
previously created active Situations in memory according to the retention_period setting in the Moogfarmd configuration file. You can expect
memory to grow in Moogfarmd as a consequence under a high rate of Situation generation.
Other Moolets
The performance of other Moolets varies based upon configuration and the rate at which they receive messages to process. Moolets that interact with external services may introduce processing delay to Moogfarmd when there is network or processing latency associated with the external service.
Web Application Server Performance
The Apache Tomcat servlets provide the backend for the Moogsoft AIOps UI which drives the end-user experience. Scalability tests show that a single Tomcat instance can support up to 500 concurrent UI users before response times degrade. Tomcat performance depends on the following factors:
-
Incoming event rate from integrations and LAMs.
-
Incoming messages from other parts of the system, such as Moogfarmd.
-
CPU clock speed and number of available cores.
-
Available memory and -Xmx setting of the Tomcat process.
-
Database load from other parts of the system.
-
Number and complexity of alert and Situation filters being used.
-
Activities of the users.
To provide quicker load times for users, the UI employs caching benefits for filtered views. Tomcat writes to the Message Bus to cope with event or update storms.
The db_connections and priority_db_connections settings $MOOGSOFT_HOME/config/servlets.conf control the size of the database
connection pool that Tomcat uses to connect to MySQL. You can increase either setting to
potentially improve UI performance. Exercise caution when changing these values because increases
to will typically increase CPU and memory usage of both the Tomcat and database processes. Too
many connections can lead to an overload of transactions to the database which impacts other areas
of the system.
JVM Performance
Integrations and LAMs, Moogfarmd, and Tomcat are all Java processes so you can tune the memory
allocation pool settings for the JVM to optimize performance. This -Xmx
setting defines the maximum allowed Java heap size of the process. The default memory allocation
for a Java process is one quarter of the server's RAM.
For LAMs, integrations and Moogfarmd, you can add the -Xmx argument to the line in $MOOGSOFT_HOME/bin/<lam name> or $MOOGSOFT_HOME/bin/moogfarmd where the JVM is launched.
For example, to set the maximum Java heap size for the Moogfarmd process to 16 GB, add "-Xmx16g" to the java_vm command line in $MOOGSOFT_HOME/bin/moogfarmd as follows:
#Run app
$java_vm -server -Xmx16g -DprocName=$proc_name -DMOOGSOFT_HOME=$MOOGSOFT_HOME -classpath $java_classpath $java_main_class "$@" &
For Tomcat, the default setting is 2GB. If you need to change it you can edit the service script
/etc/init.d/apache-tomcat.