Insights
Insights is built on the Stats API that exposes time-series data so you can report on:
Active Situations, the teams they're assigned to, and the services they impact.
Reoccurring Situations that could indicate deeper systemic issues.
Key performance indicators like Mean Time To Resolution.
You can use the reporting tool of your choice to take advantage of the Stats API. Otherwise, check out the Moogsoft Enterprise app for Grafana to view and modify the default dashboard. See Grafana Dashboards for more information.
Insights exposes a variety of statistics and metrics to help you understand your operations. For example, consider the valuable data in the default dashboard:
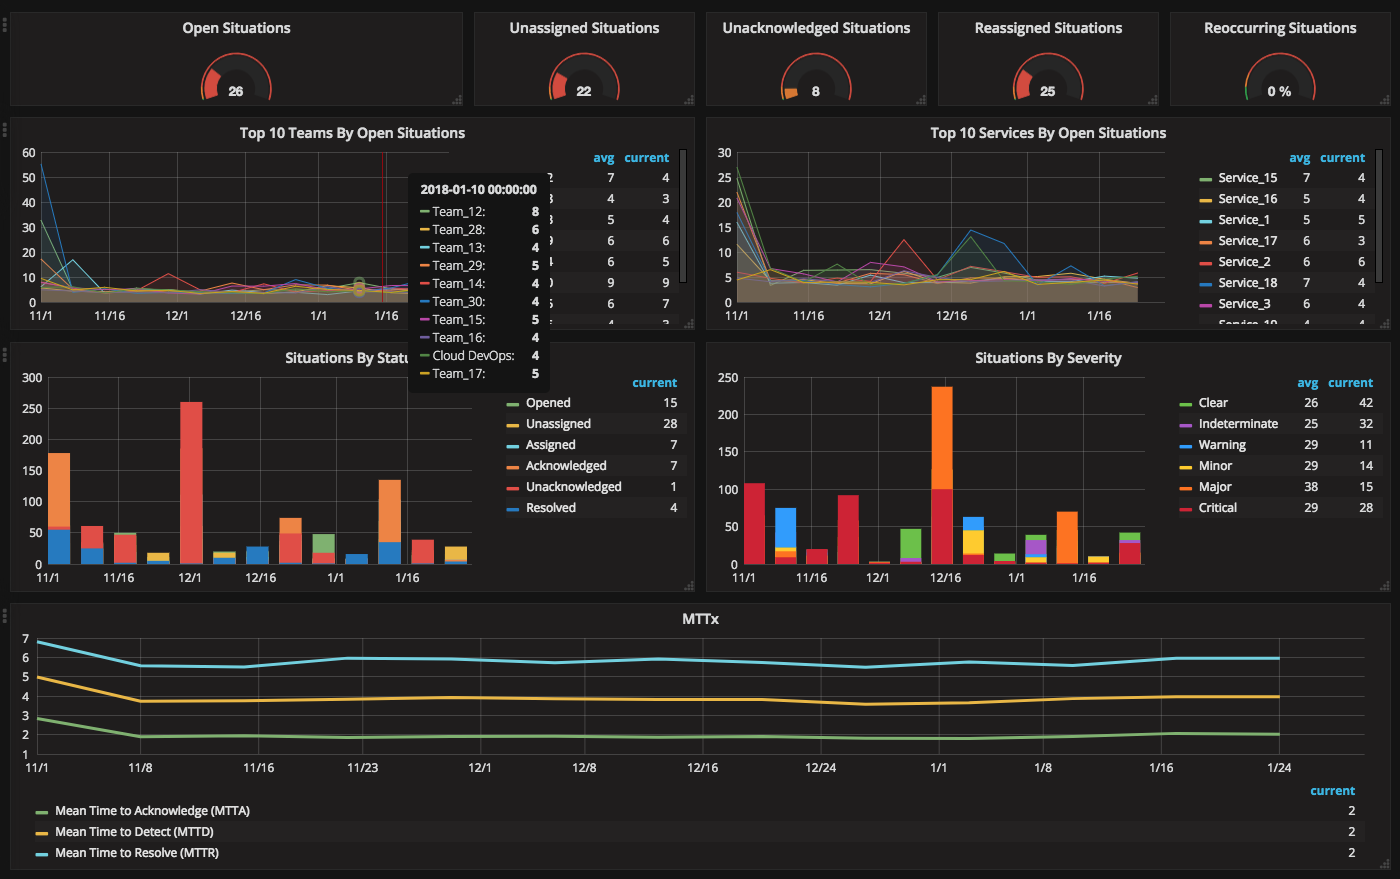
You can see how your teams are managing active Situations:
View the number of open Situations system-wide and see how many open Situations are unassigned, unacknowledged or that have been reassigned.
Identify if the number of open reoccurring Situations which can highlight areas of impact that need increased attention or resource allocation.
You can monitor the distribution of your Situations over time, to see which teams handle the most Situations and which services are most impacted by Situations. Key Performance Indicator metrics reveal how quickly Moogsoft Enterprise detects Situations and how quickly teams address open Situations over time:
Mean Time To Detect: the mean time to detect a Situation from the first event time.
Mean Time To Acknowledge: the mean time to acknowledge a Situation from the first event time.
Mean Time To Resolution: the mean time to resolve a Situation from the first event time.
For details on all the available Insights, see the Stats API.