Situation Visualization
Caution
The Visualize tab is a "Labs Feature". Enable the Visualize feature in Labs to view it in the Situation Room. See Configure Labs Feature for details. Your role must have the "sig_visualize" permission to use this feature. See Manage Roles for details.
The Visualize tab in Situation Rooms allows administrators and implementers to see which process created a Situation and the similarity of the alerts within the Situation. You can use this information to adjust your Moogsoft AIOps configuration to improve the relevance of the Situations it creates.
Note
Currently, Moogsoft AIOps does not fully handle alerts that a user has manually added to a Situation. For example, manually added alerts do not display in a similarity diagram if their similarity to the reference alert is below the threshold for a component but they will appear in another diagram if their similarity is above the threshold for that component.
Currently, the similarity diagrams only work with core alert fields. If Moogsoft AIOps uses custom info fields to cluster alerts, the similarity diagrams do not display.
To view the Visualize feature, go to a Situation Room and click the Visualize tab.
This tab displays the origin of the Situation and additional detail depending on the origin. For example:
-
Cookbook Recipe: Cookbook and Recipe names.
-
Manual Situation creation: ID of the user who manually created the Situation.
-
Situations merged: ID of the user who merged the Situations and the merged Situation IDs.
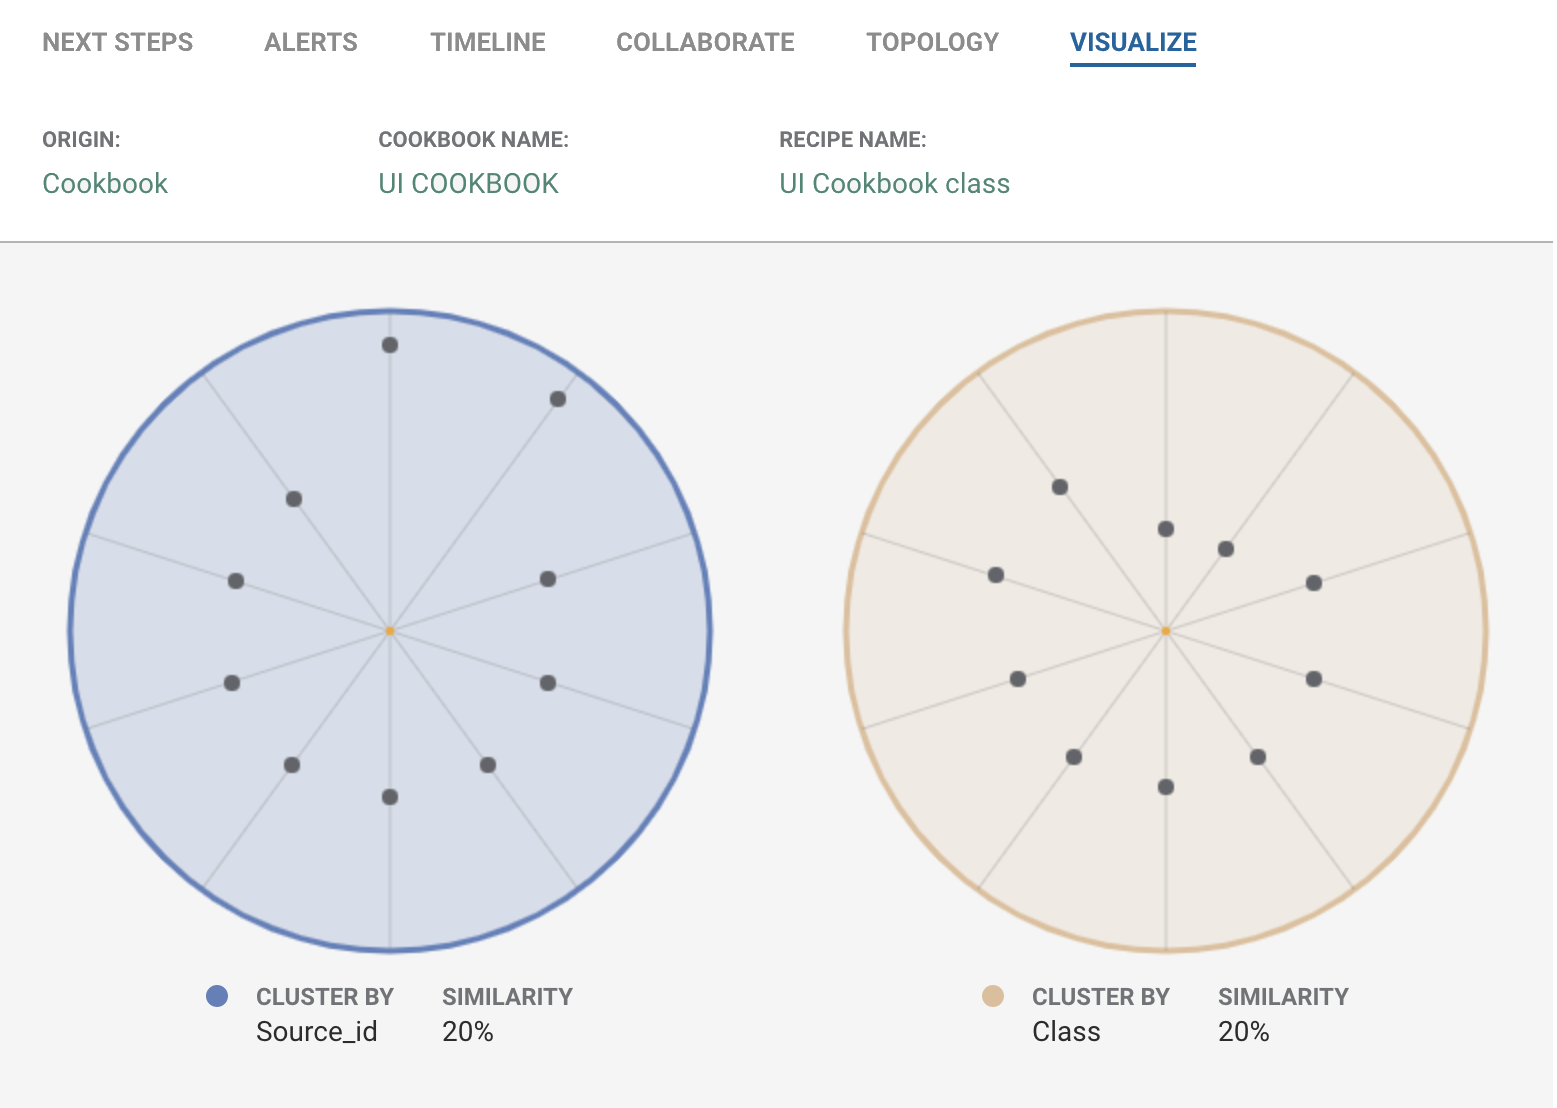
The Visualize tab shows diagrams of the alerts in the Situation according to how the Cookbook Recipe has clustered them. In the example below, this Situation has ten alerts which are clustered by two components: Source ID and Class. The Cookbook Recipe clusters alerts whose Source ID is at least 20% similar to the reference alert and whose Class is also at least 20% similar to the reference alert. The reference alert may be a seed alert or simply the first alert that the Cookbook Recipe added to the cluster.
Each diagram shows the similarity of the alert to the reference alert for one of the components. The reference alert has a similarity of 100% and is shown at the center of the circle. Alerts with a high similarity display closer to the center of the circle and alerts with a low similarity display nearer the edge of the circle. In the example below, alerts that are only 20% similar would display at the edge of the circle.