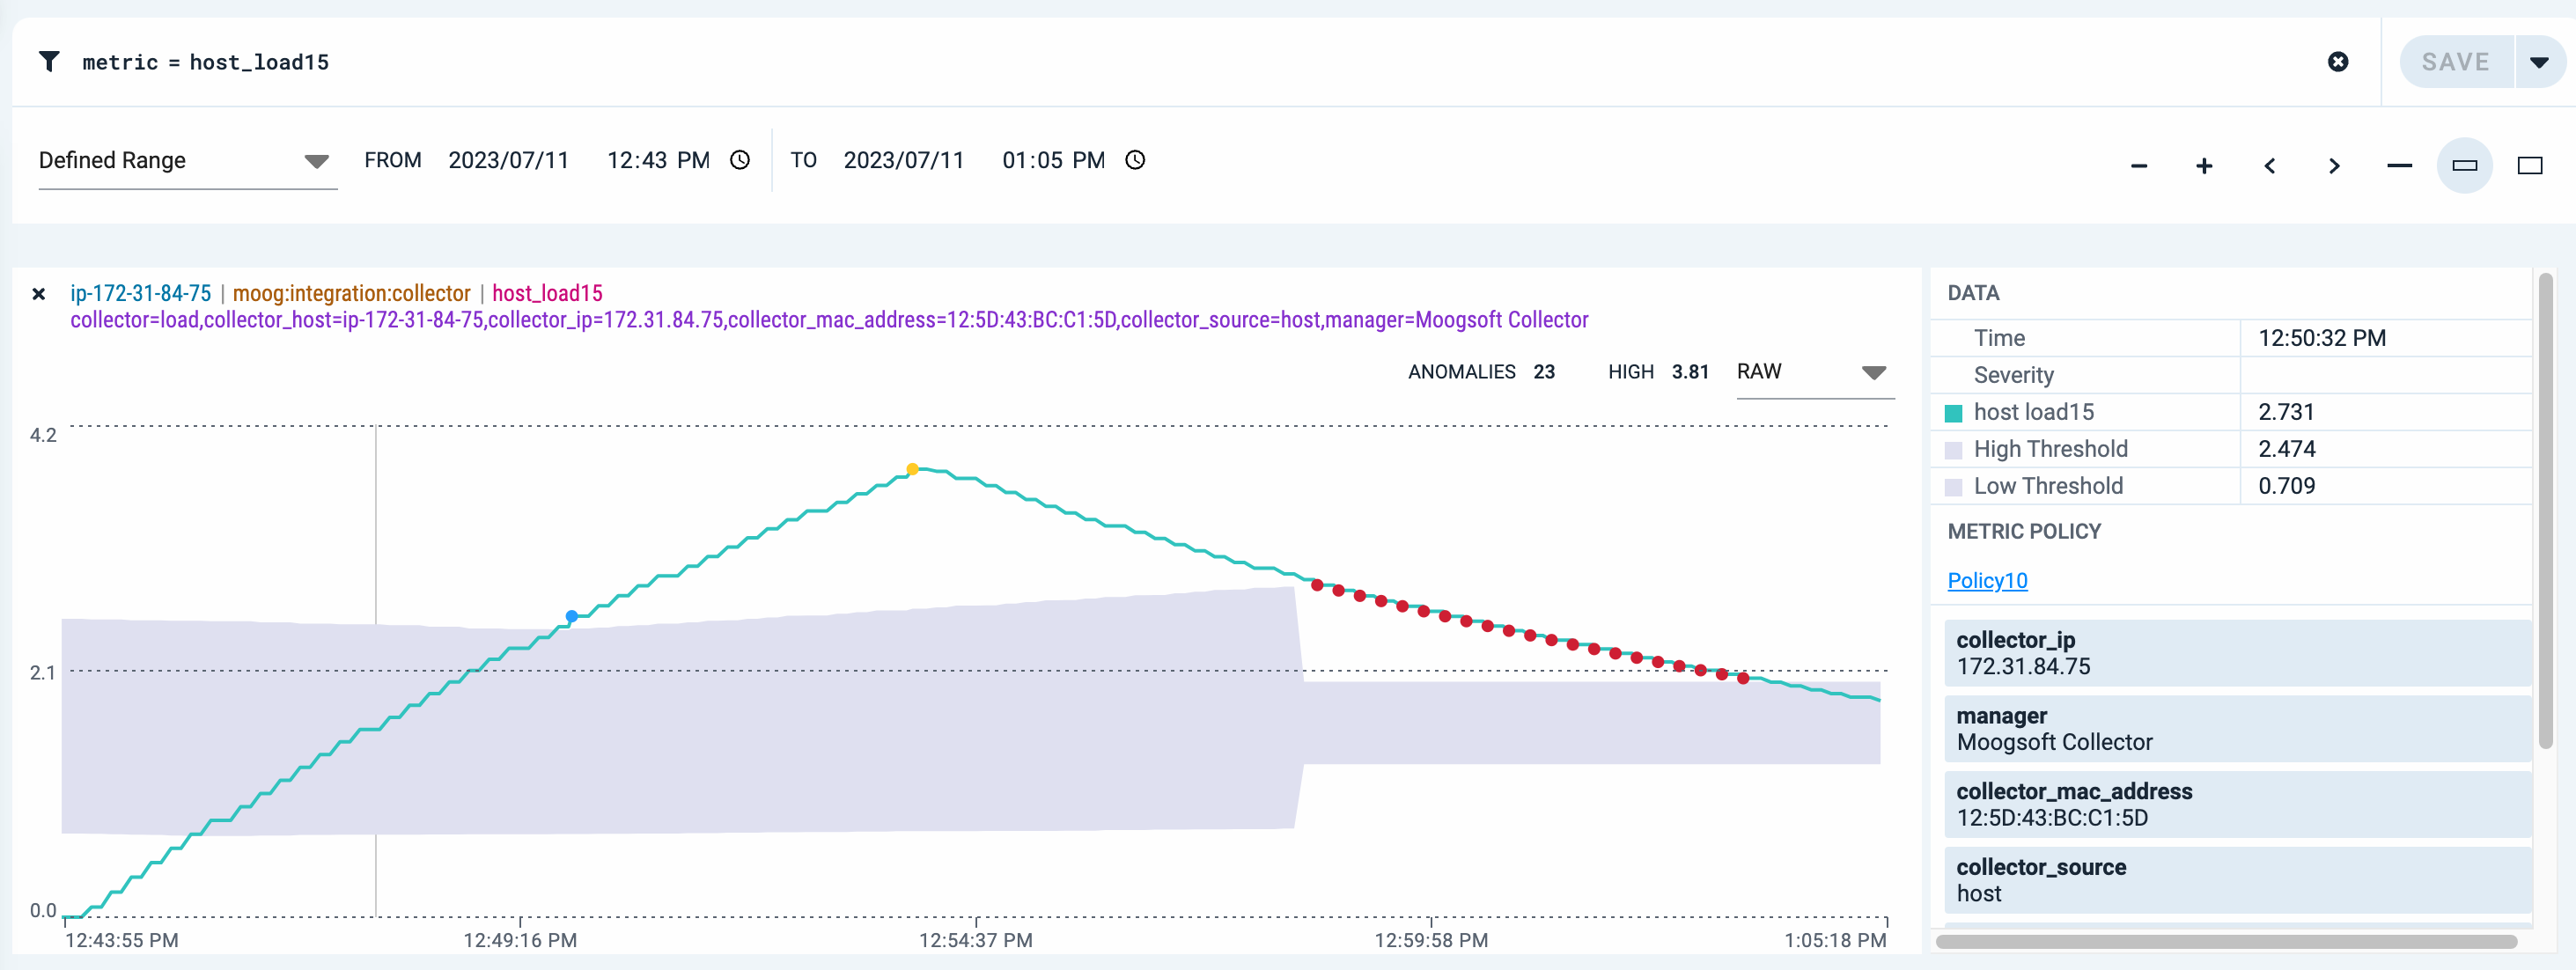
View metrics
The Metrics page provides a single location to view ingested time series data from your monitored systems. You can view metric trends over time, view anomaly details, and view data for time periods of particular interest. Create scope queries to view specific metrics and to focus on particular metric attributes. Metric policies let you control the metric data which is stored or discarded, and to define anomalous behavior.
Note
The Default Metric Policy identifies all metric anomalies and generates alerts until you create additional metric policies or change the default behavior. A metric policy enables Moogsoft Cloud to determine thresholds and to characterize anomalous data. For details, see Configure metric policies and Change the Default Metric Policy behavior.
For information on integrations which support metric data ingestion, see Compare ingestion methods.
View metrics on the Metrics page
Access the Metrics page by navigating to Incidents > Metrics in the left-hand navigation.
Create queries using the query box to view specific aspects of your metric data. See Use metric charts and Search and filter metrics for more information.
 |
View metrics from the Incidents and Alerts pages
Access the Incidents and Alerts pages by navigating to Incidents > Incidents or Incidents > Alerts, respectively.
Then, click the Metric tab (Alerts page) or Metrics tab (Incidents page) in the details pane to view the associated metrics.
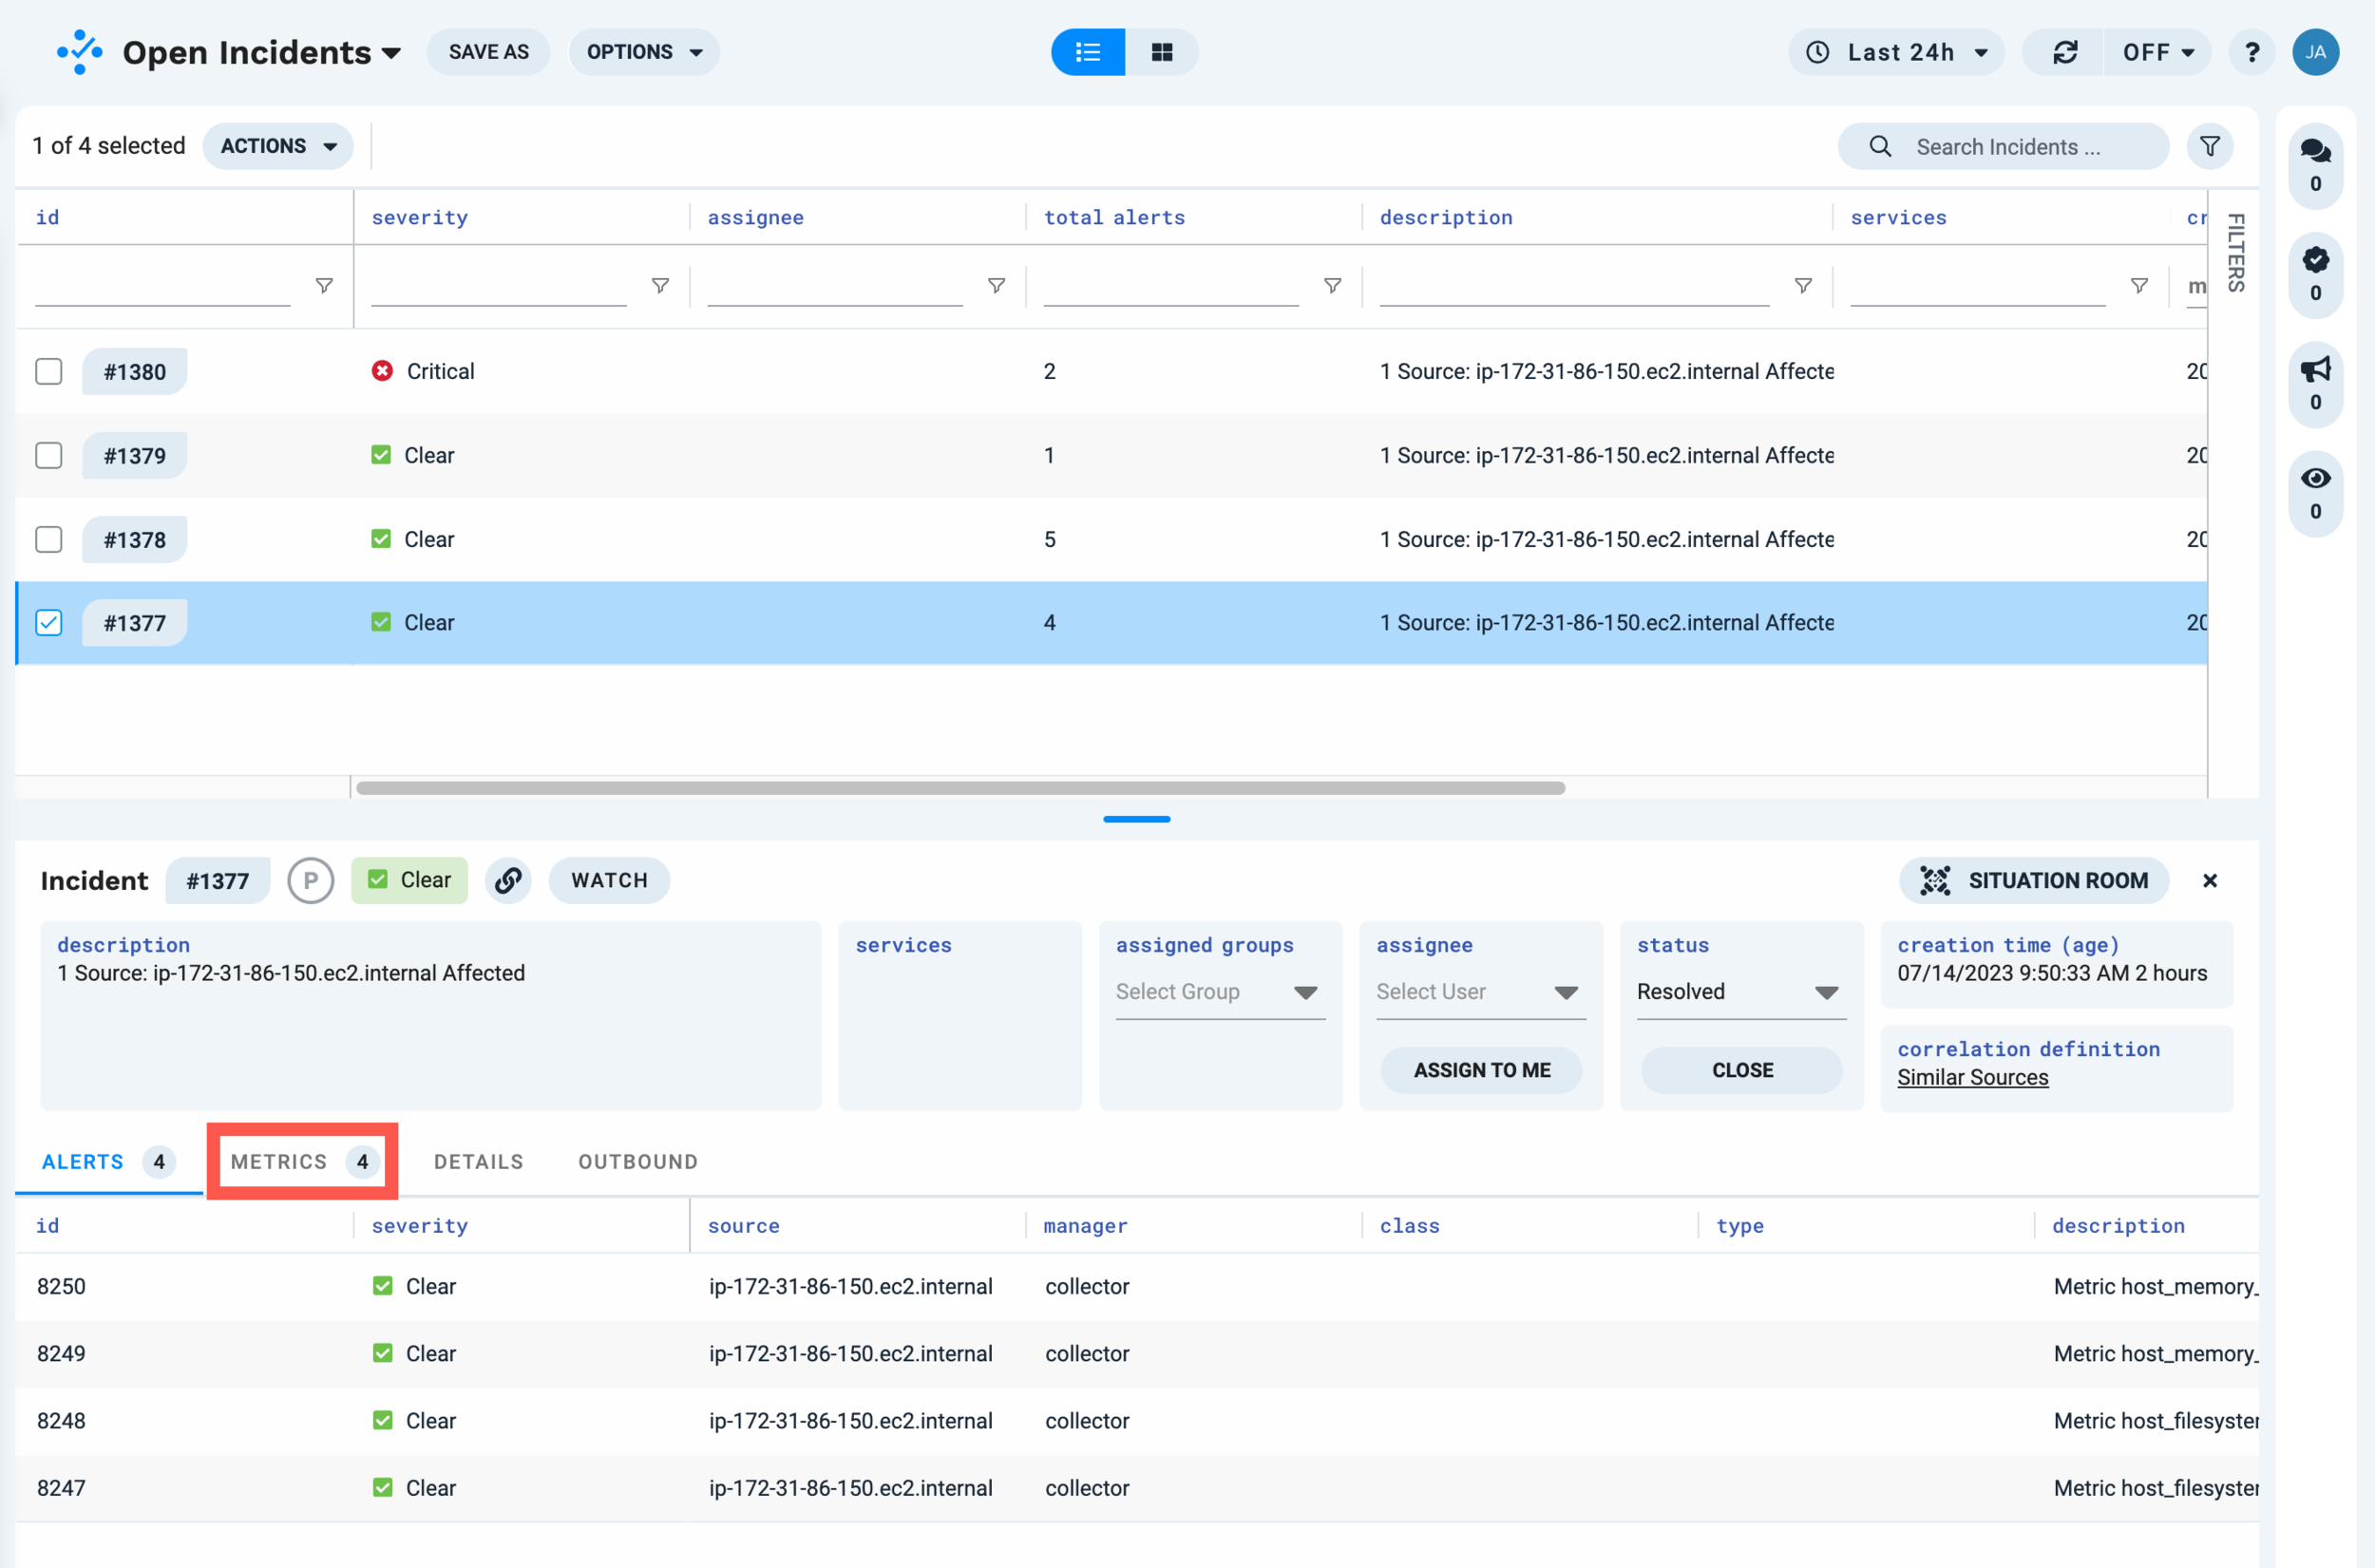 |
Note
Clicking the Metric or Metrics tab opens a pane at the bottom of the page which displays the metric charts. Clicking the number to the right of the world "Metric" (4, in the example shown) opens the metric charts in a new page.
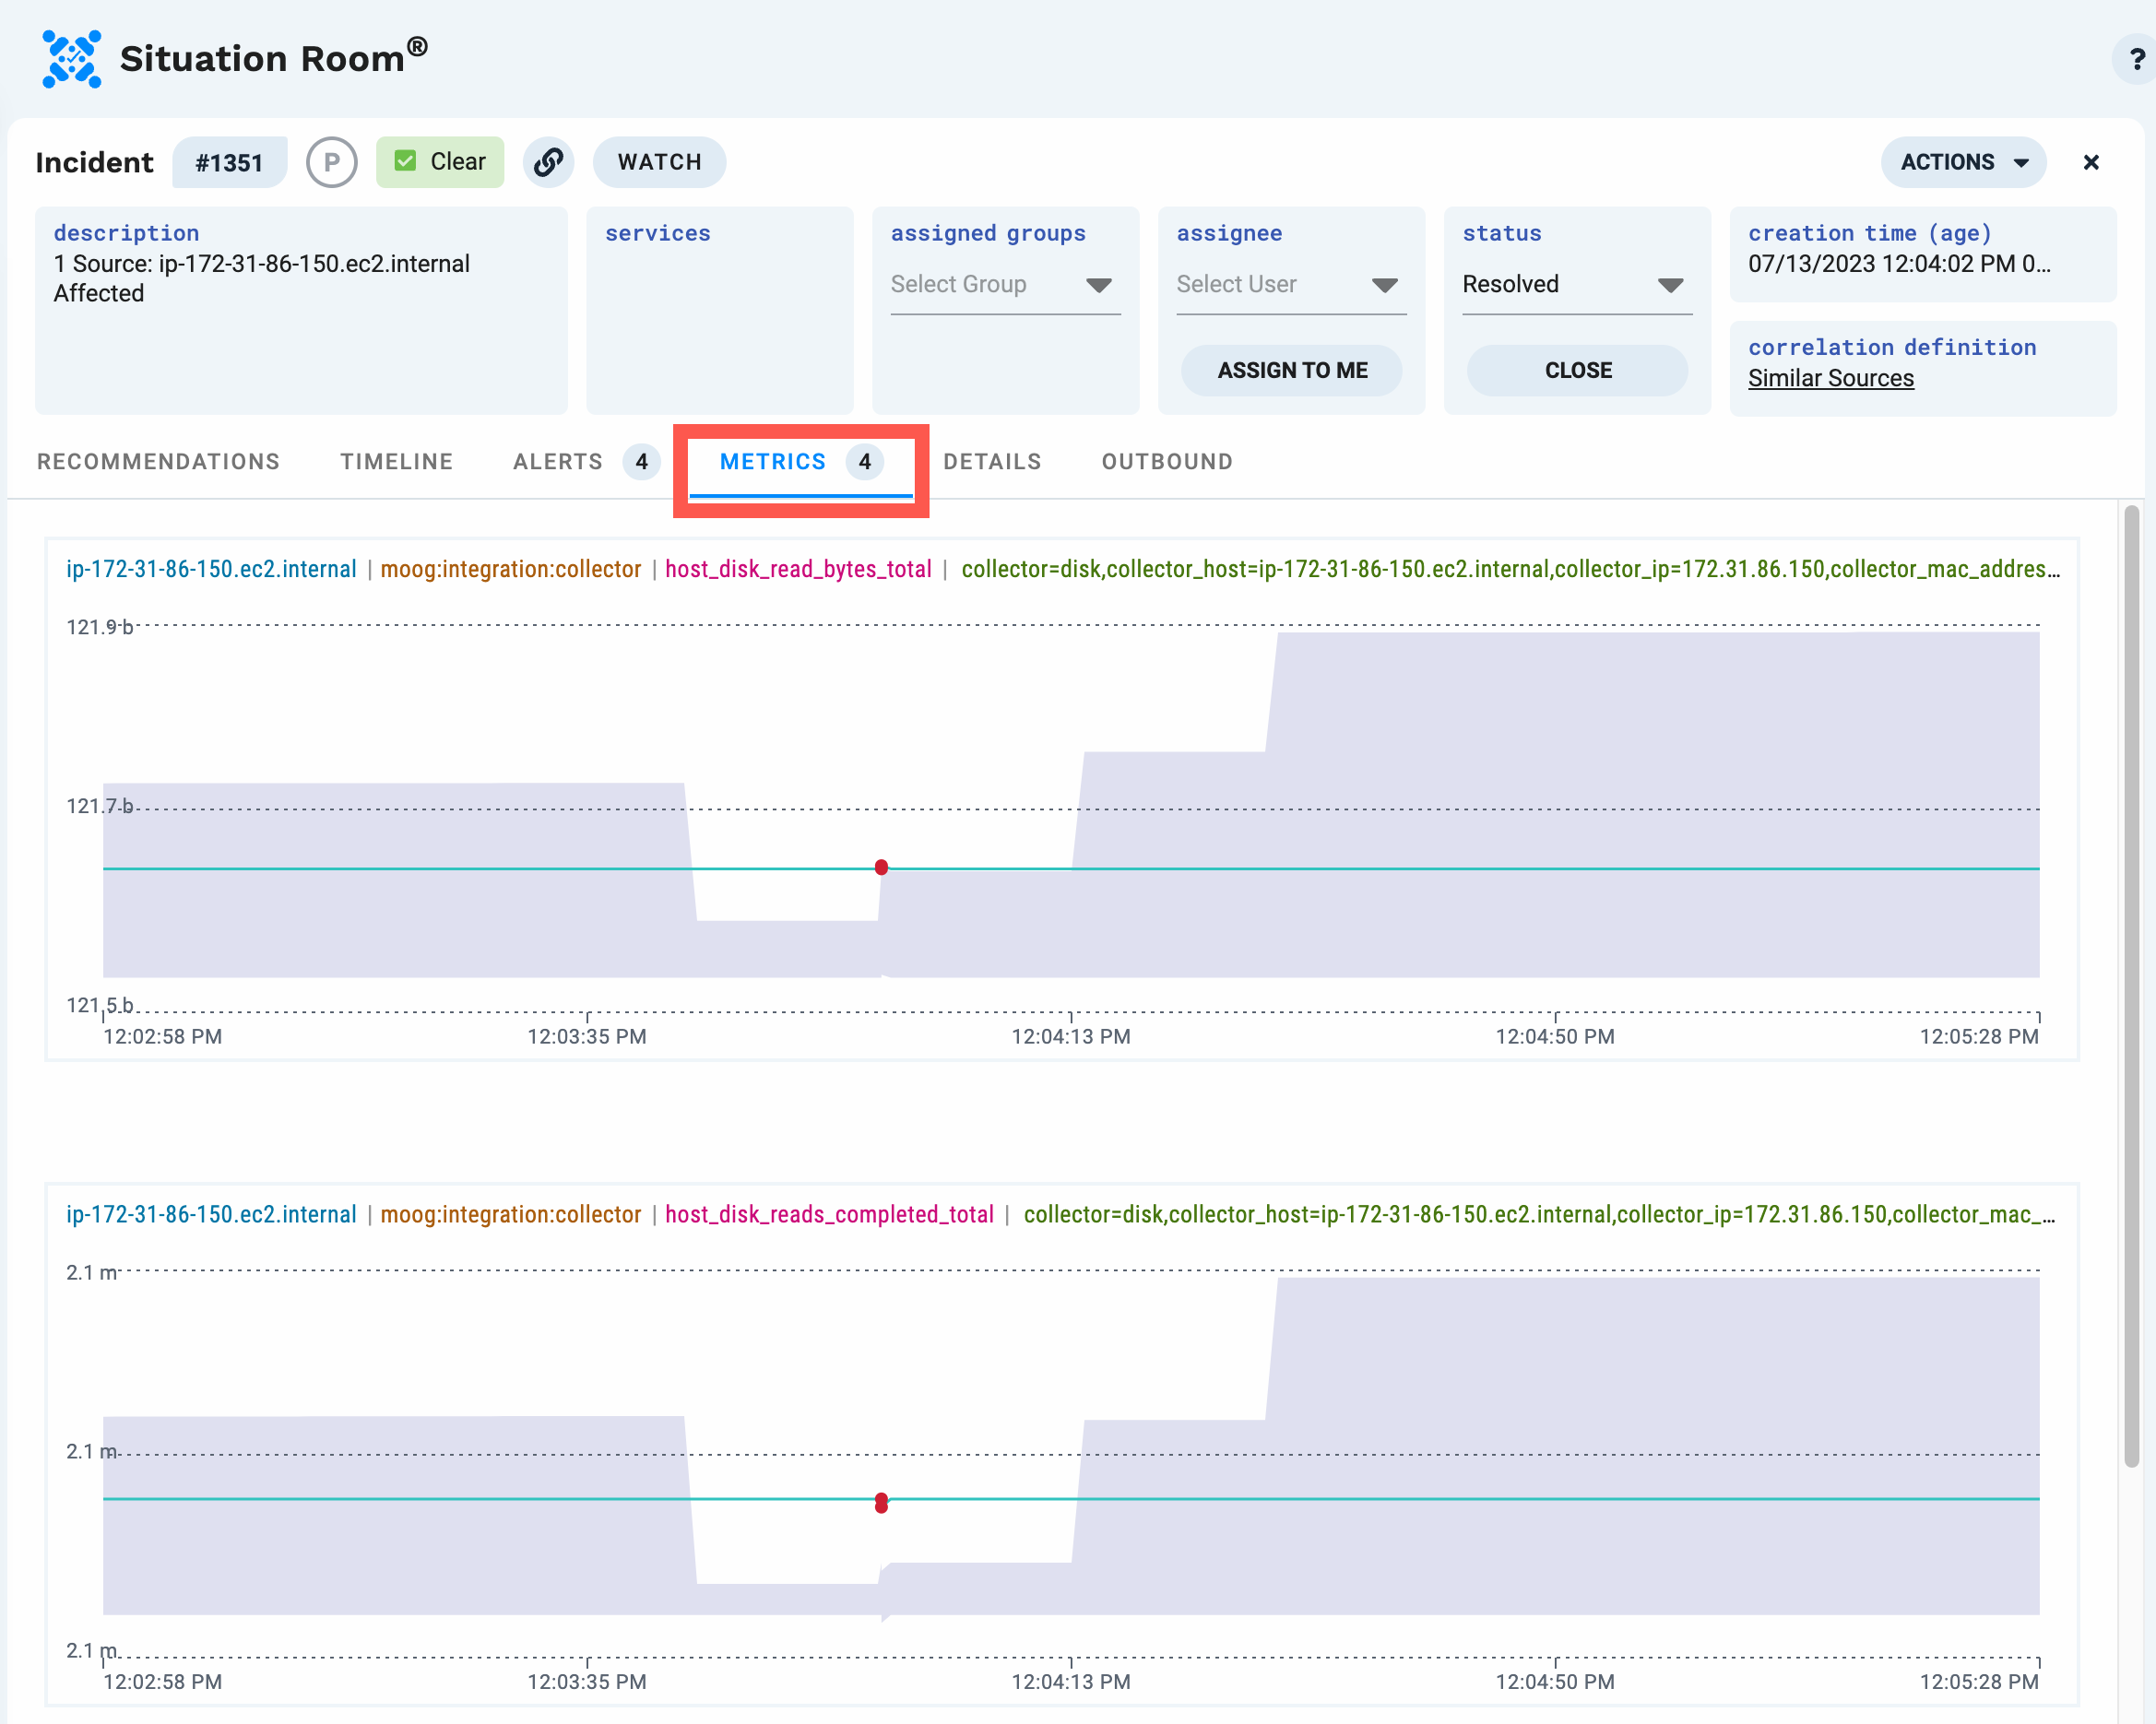
View metrics in the Situation Room
Access the Situation Room for any incident by selecting an incident in the Incidents page and then clicking Situation Room.
Click the Metrics tab in the Situation Room to view the metric charts, including the anomalies associated with the incident:
 |