Concept explainer: Analyze data in Moogsoft Cloud ►
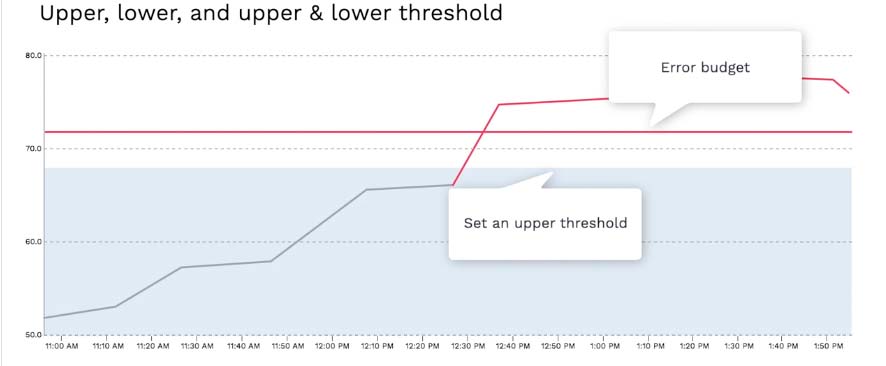
Vector allows you to set the upper threshold, lower threshold, or both upper and lower thresholds.
For example, you don’t care how low the errors are, so you can set the upper threshold as the error gets close to the error budget value
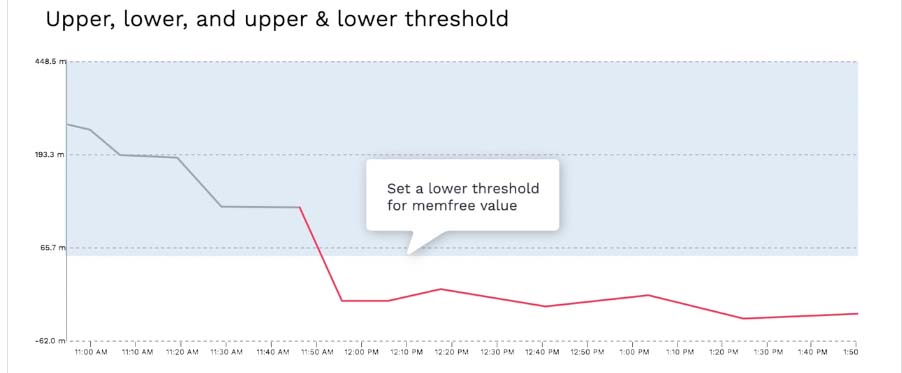
Or, you can set the lower threshold only for something like memfree. You don’t care if a lot of memory is free, so you only set the lower threshold for when the free memory value goes below a certain level.
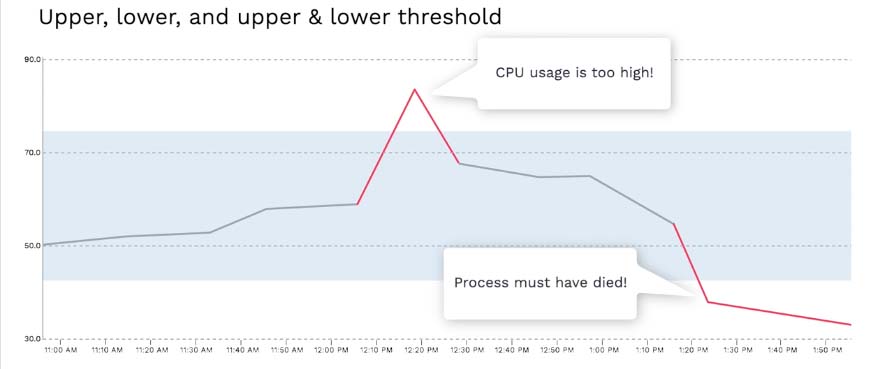
Of course you can set both upper and lower thresholds. For example, the CPU usage for our EC2 environment is typically around 50%. Naturally you want to watch for the high CPU usage, but also if the usage goes down too too low, then most likely your processes died and it’s also a problem.
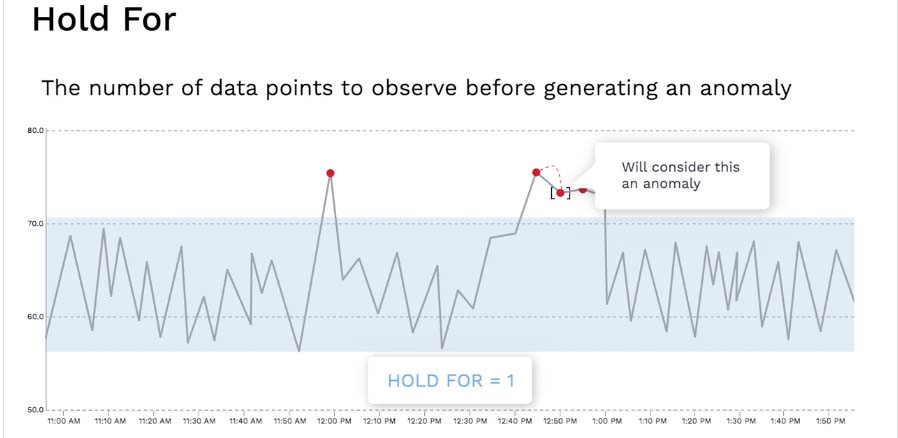
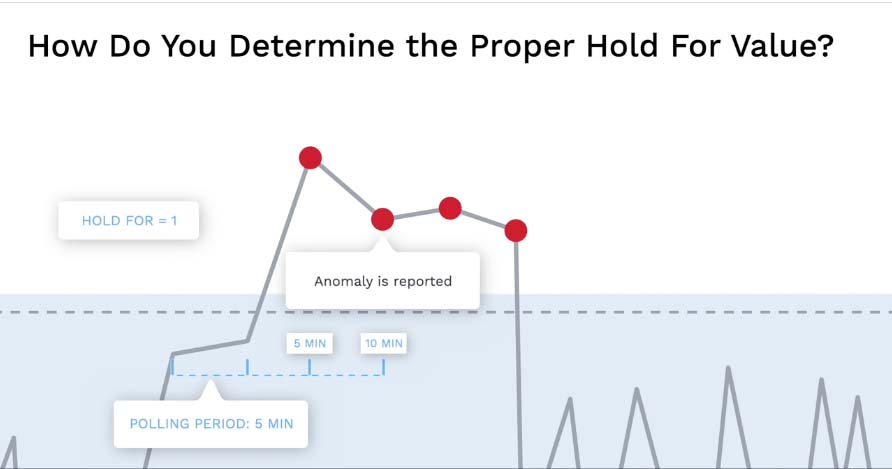
Next, hold for is the number of data points to observe before generating an anomaly.
For example, if there’s a spike in your metrics and one data point falls out of the norm. If your hold for value is set to 1 or above, then the collector will wait for the next data point to see if it is also an anomaly before sending the data to Moogsoft. (point at the first pink dot) In this example the next data point went back to the norm, so the collector will not process this further.(point at the second pink dot) In this example, the second data point stayed outside the norm, so at this point, the collector will handle this as an anomaly.
If you want the first anomalous data point to be processed as an anomaly right away, then set the Hold for value to 0.
You may be wondering how to best determine the hold for value, so here’s a best practice advice.
Consider the polling period and SLA.
For example, suppose your polling period is every 5 minutes and your hold for value is set to 1. Then it’ll be potentially almost 10 minutes from the problem starts before the anomaly is reported.Does this meet your SLA? If so, great, if that’s too long, then you might want to change the hold for to 0.
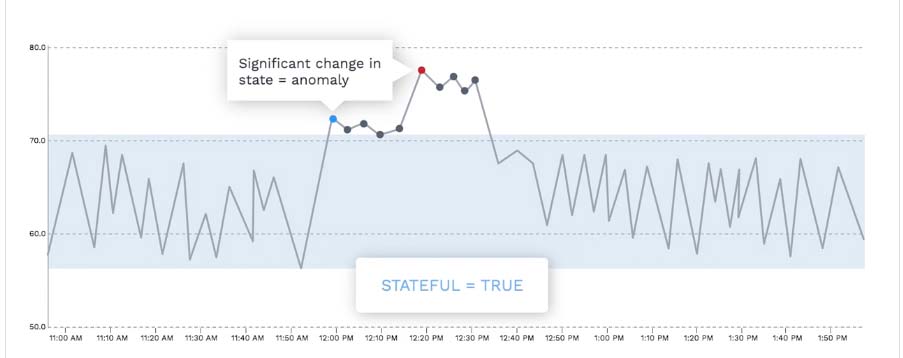
Stateful lets you choose whether you want to only report on the anomaly that changes the state of the metric.
For example, if you set the stateful value to be true, these two data points that shows significant change in state will be considered an anomaly.
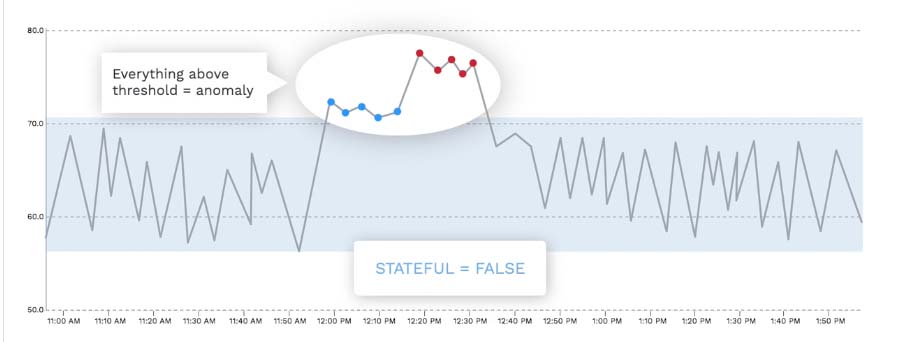
If you choose false, then all these will be processed as anomalies
Window is where you can define how many data points should be included when a collector sends the anomaly data to Moogsoft.
For example, if you set it to 1, 1 data point before and 1 after will be sent to Moogsoft.
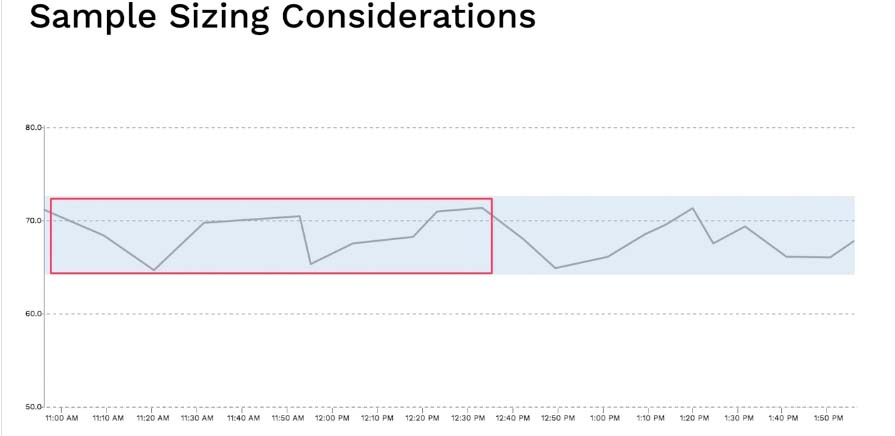
Here’s a common questions we get - how big should the sample size be?
If the sample size is too small, you may not catch the typical fluctuations.
In general, a bigger sample size renders a better calculation of standard deviation. So you will end up getting less false positives.
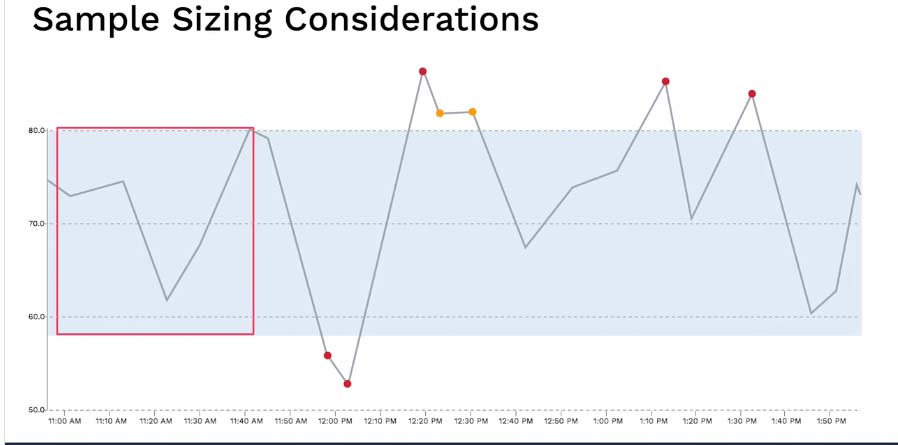
However if the data doesn’t vary too wildly, making sample size too large makes everything “normal”. Also the larger the sample data is, the more memory it takes.
In general set the learning period pretty close to the sample period. Now you know some of the key metrics attributes in Moogsoft to help you analyze data. Thanks for watching!