Use case walkthrough: User workflow in Moogsoft Cloud ►
In this video, we will step through the typical workflow of a Moogsoft user as they work through incidents.
Here comes a slack message, notifying us there’s a critical incident requiring our attention.
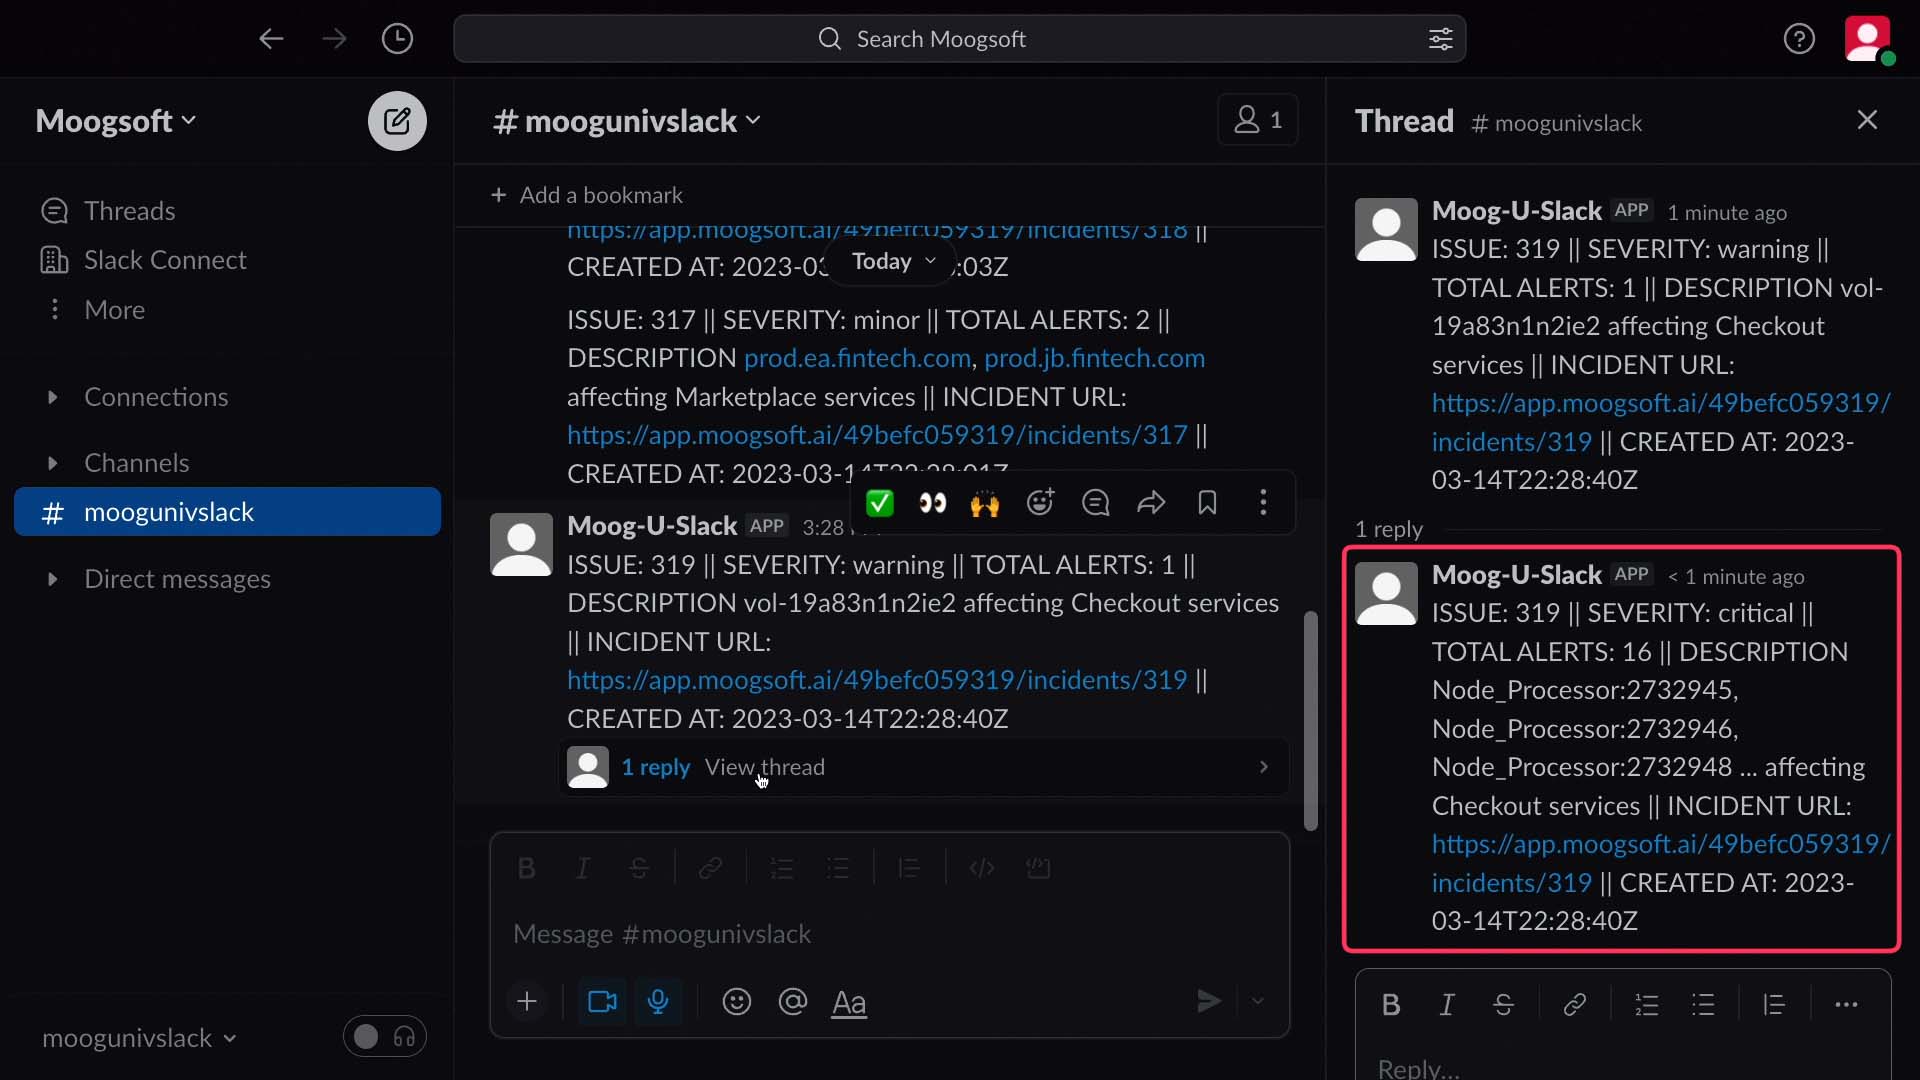
So we click through to Moogsoft Cloud, which takes us to this incident’s Situation Room.
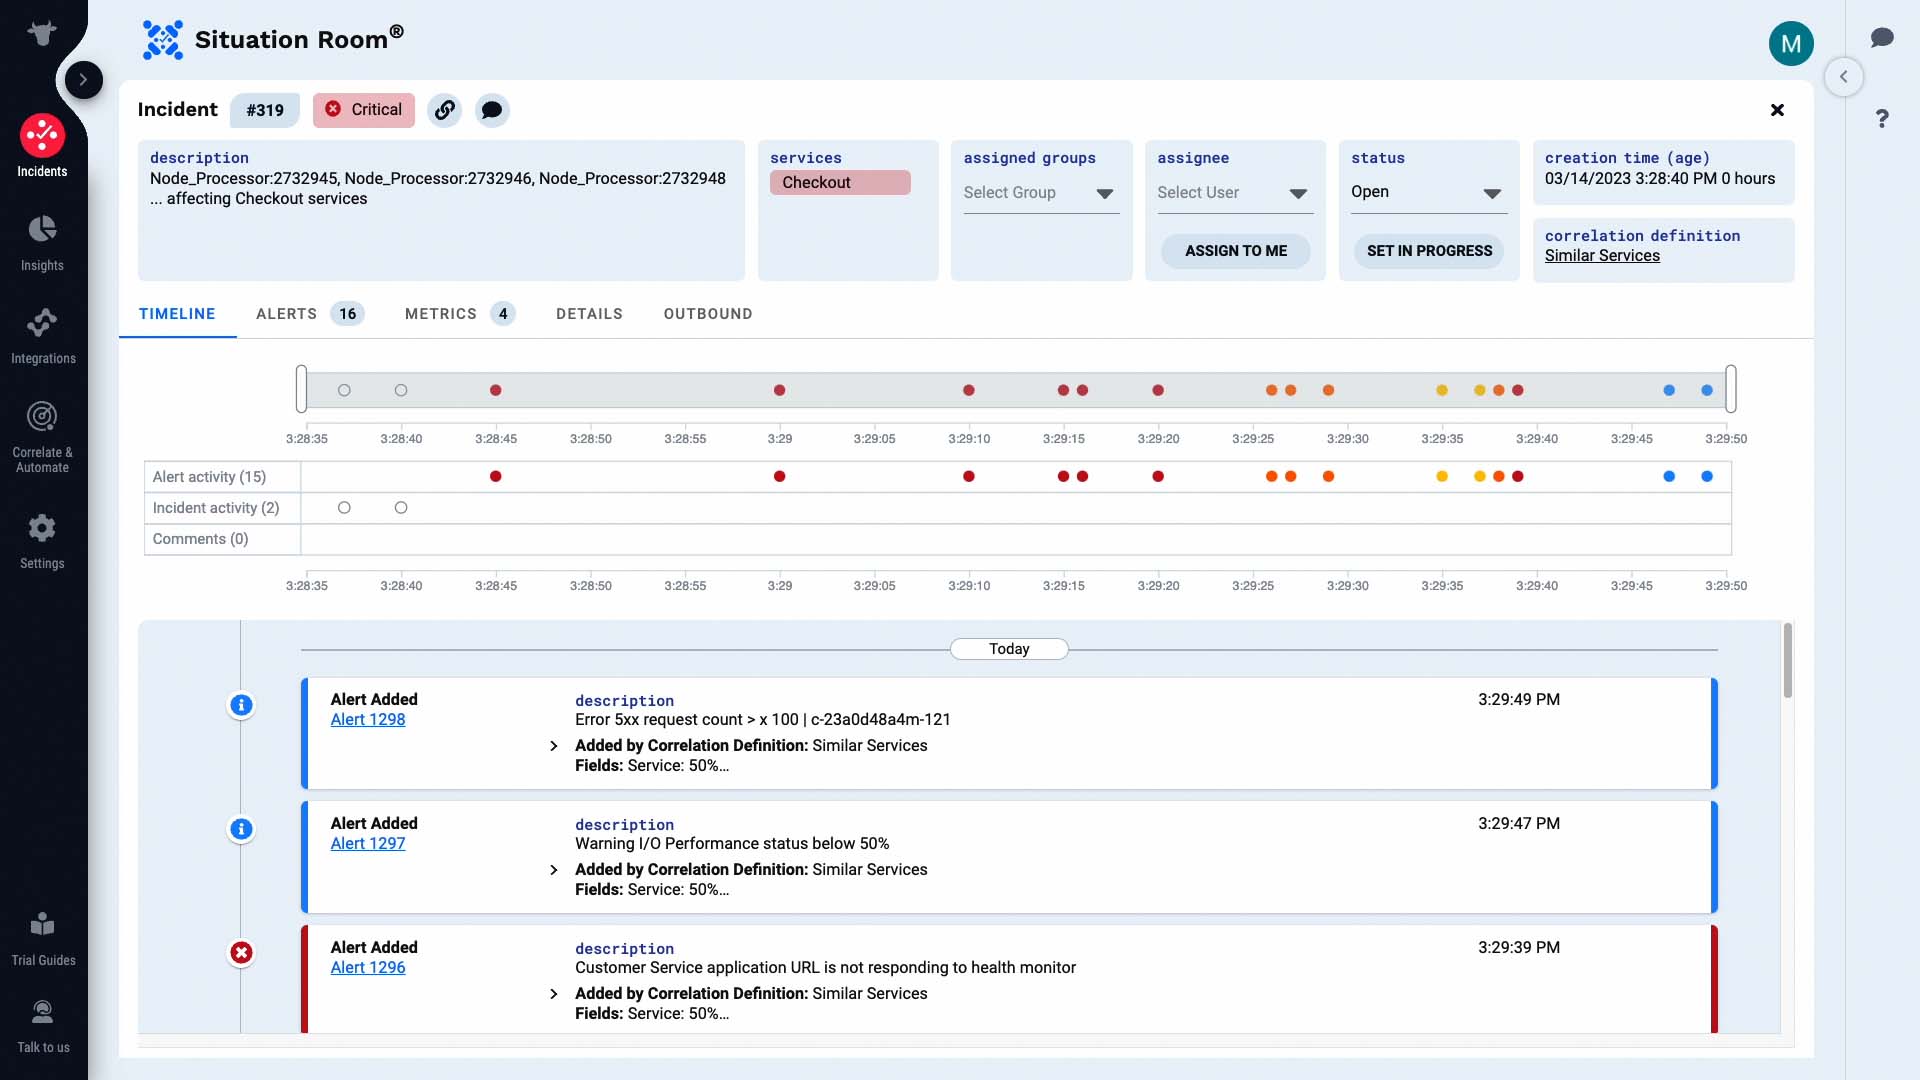
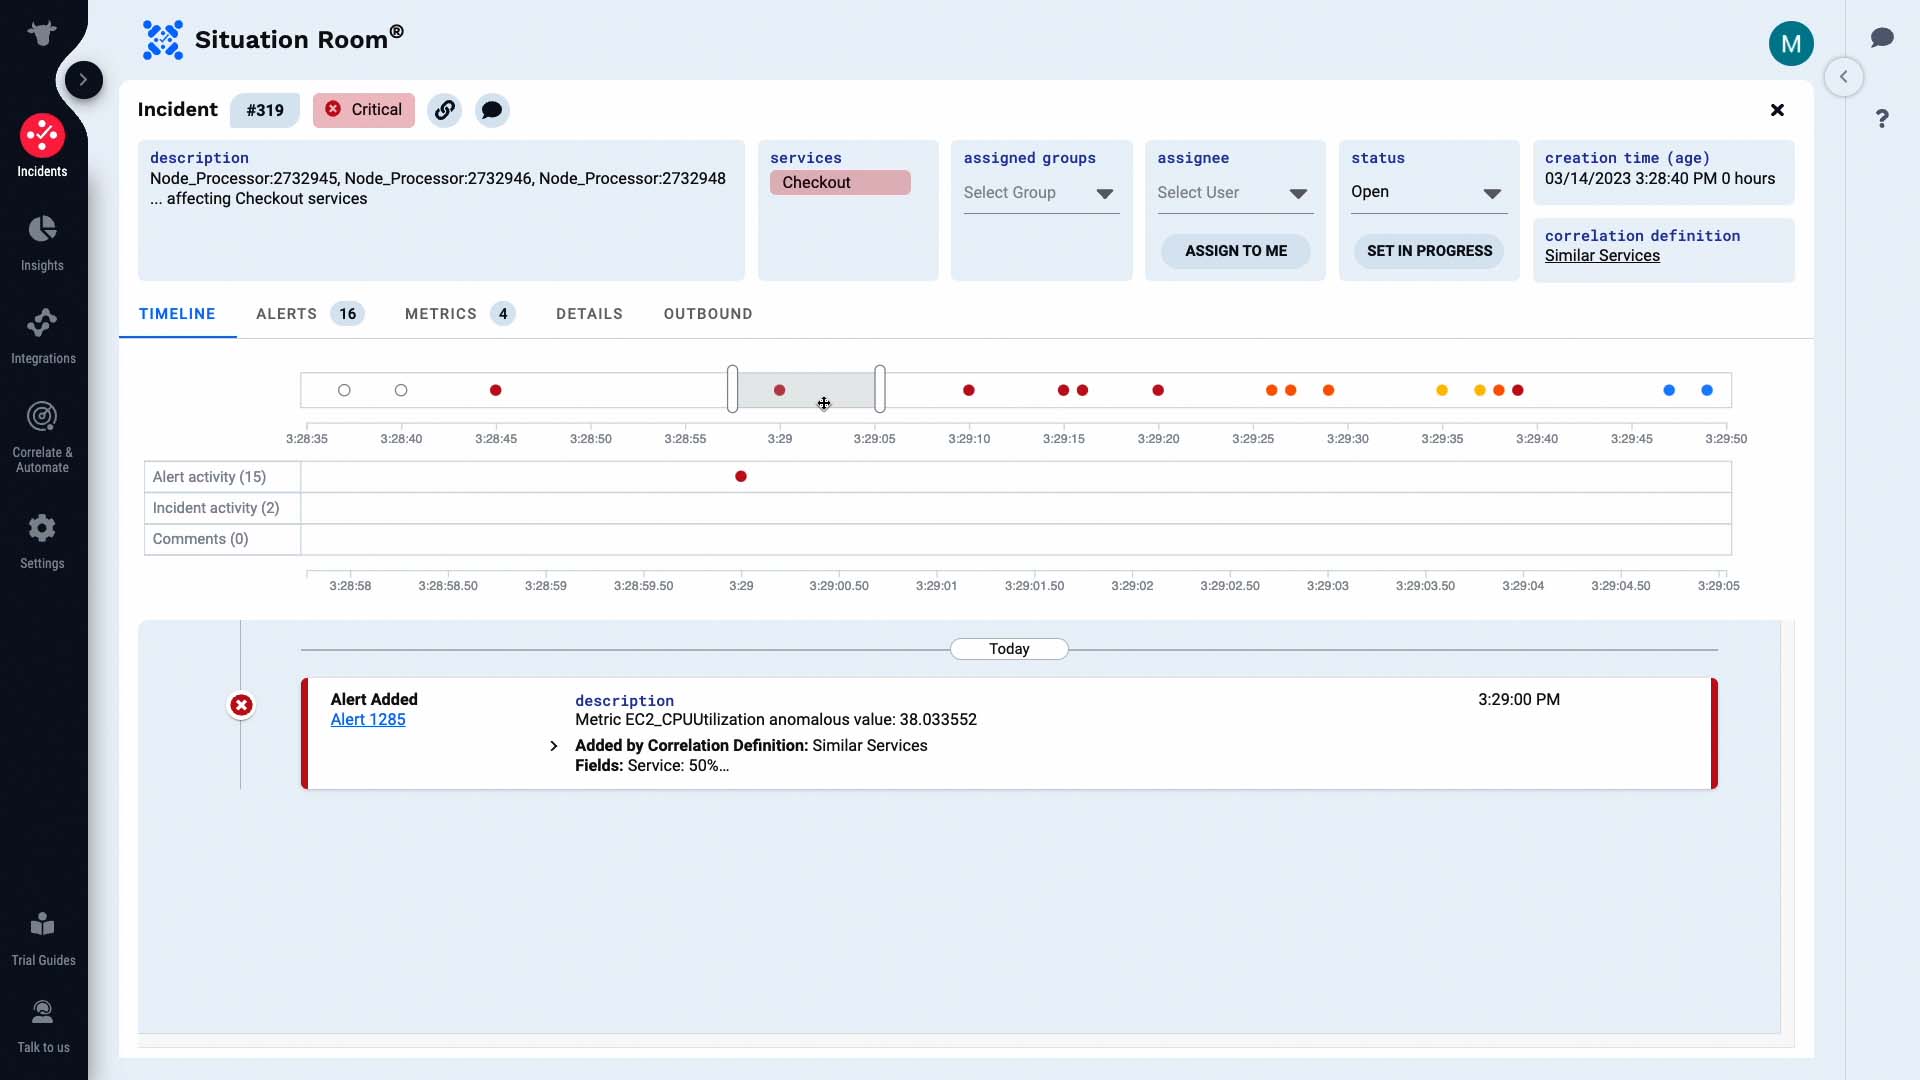
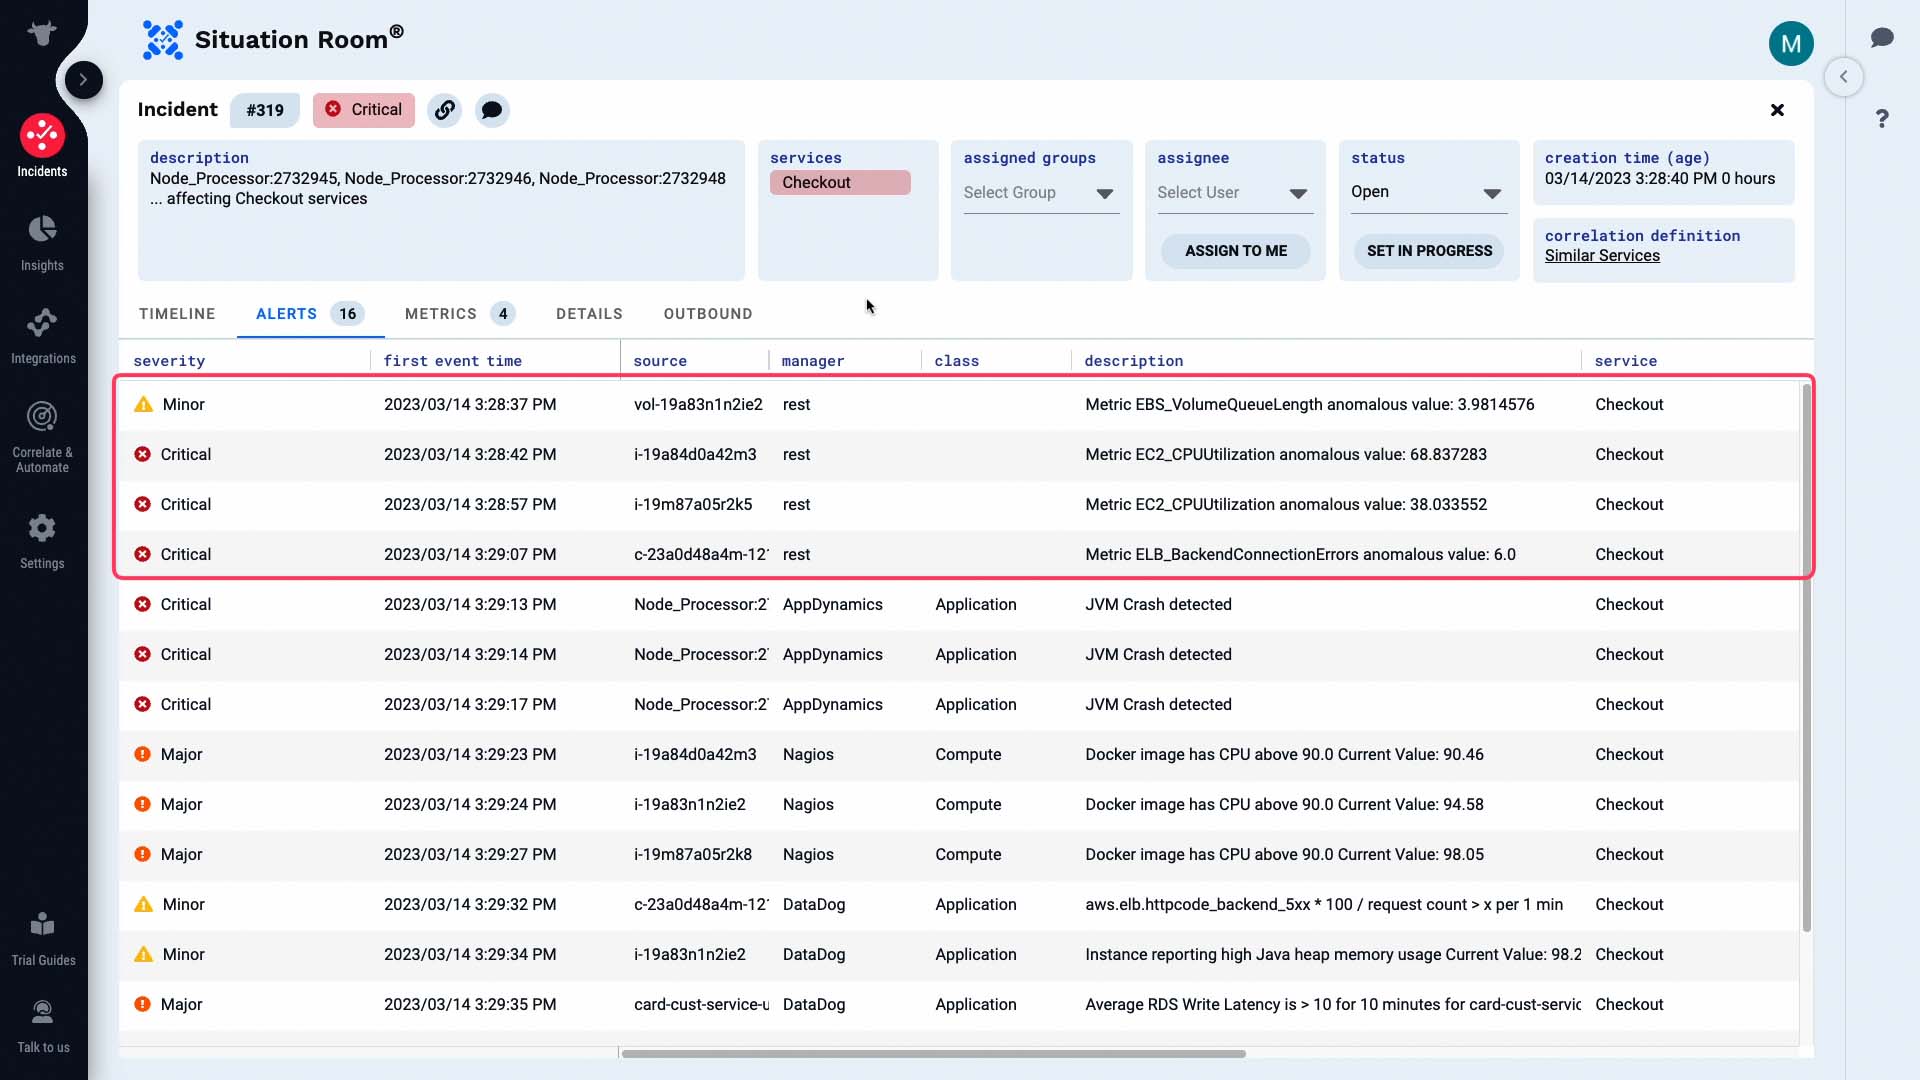
The Situation Room is where you and your team can collaborate on an incident. This is the timeline for this incident. These sliders let you zoom in on particular areas, and the list below filters to match the time frame you choose.
Let’s examine all alerts. These are the alerts that make up this incident. Some of these are alerts from a monitoring system.
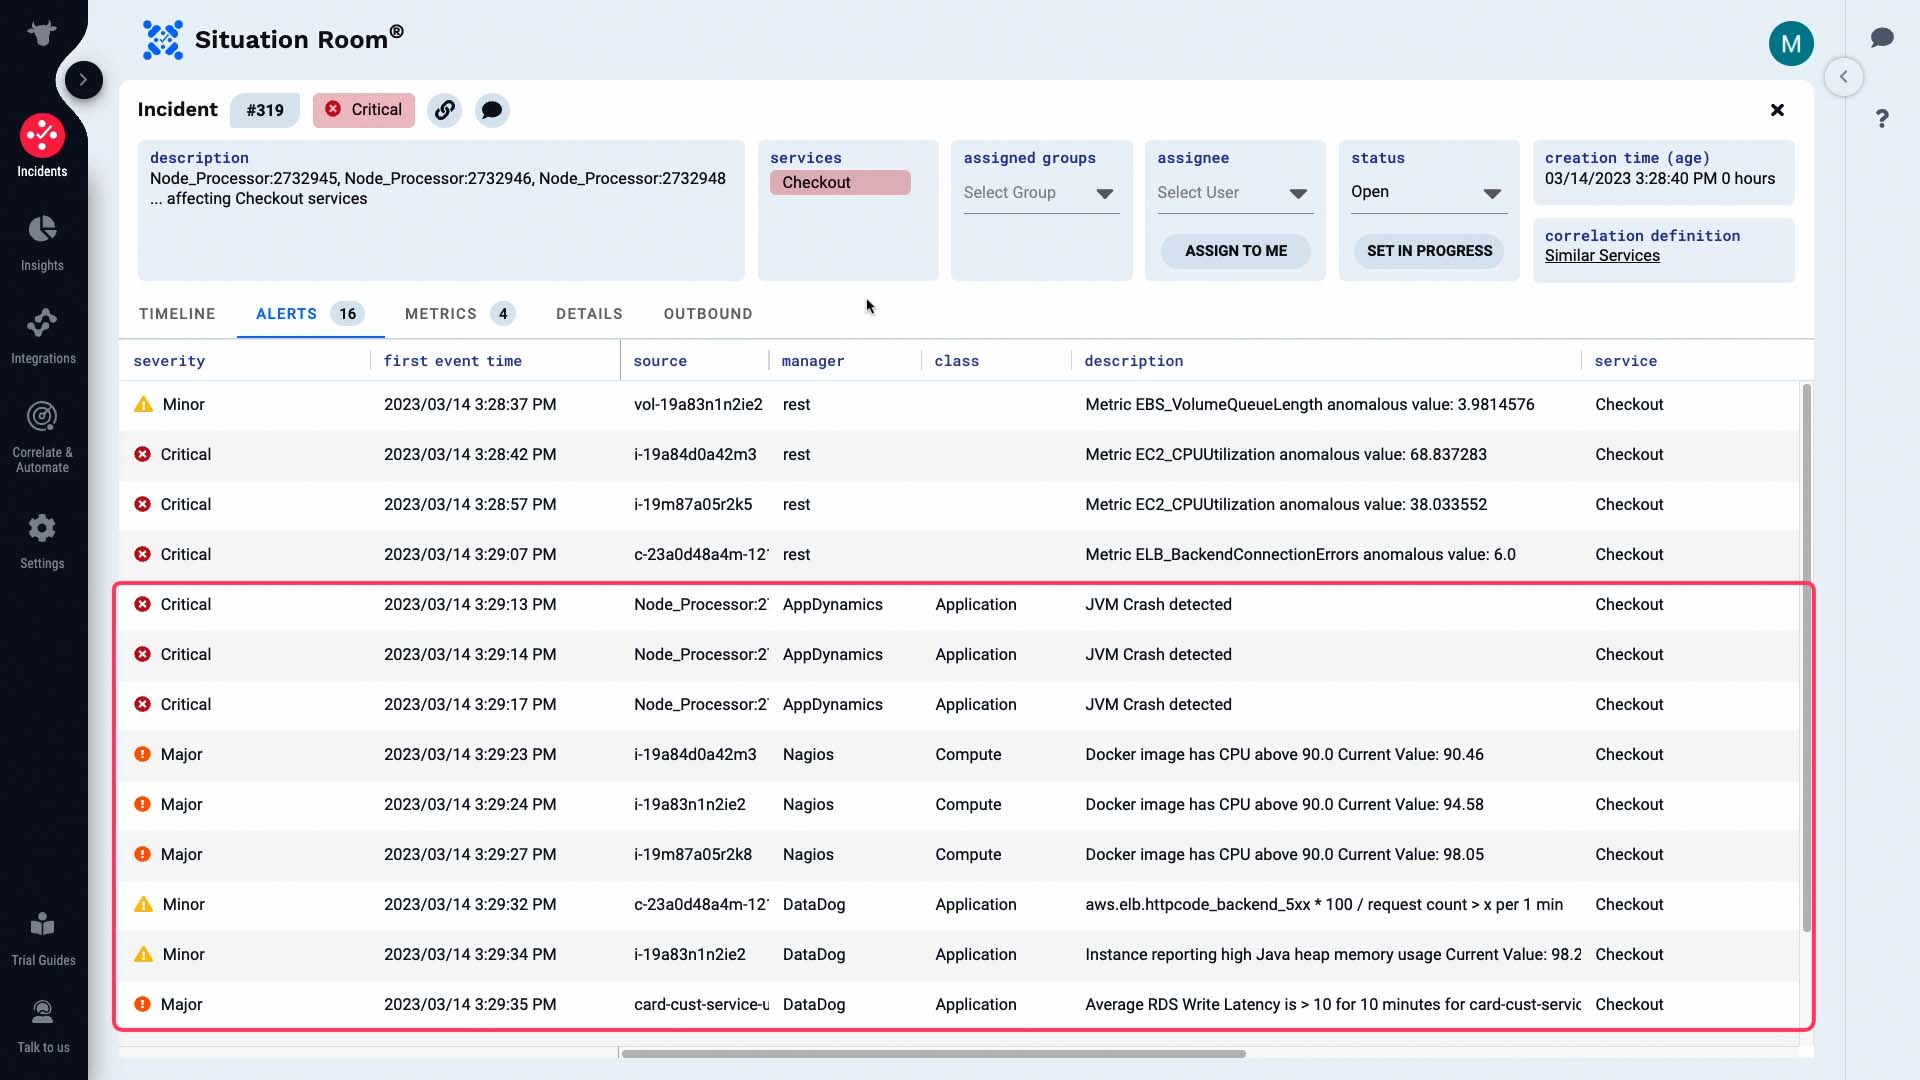
And these are alerts generated by Moogsoft based on the metrics it is tracking.
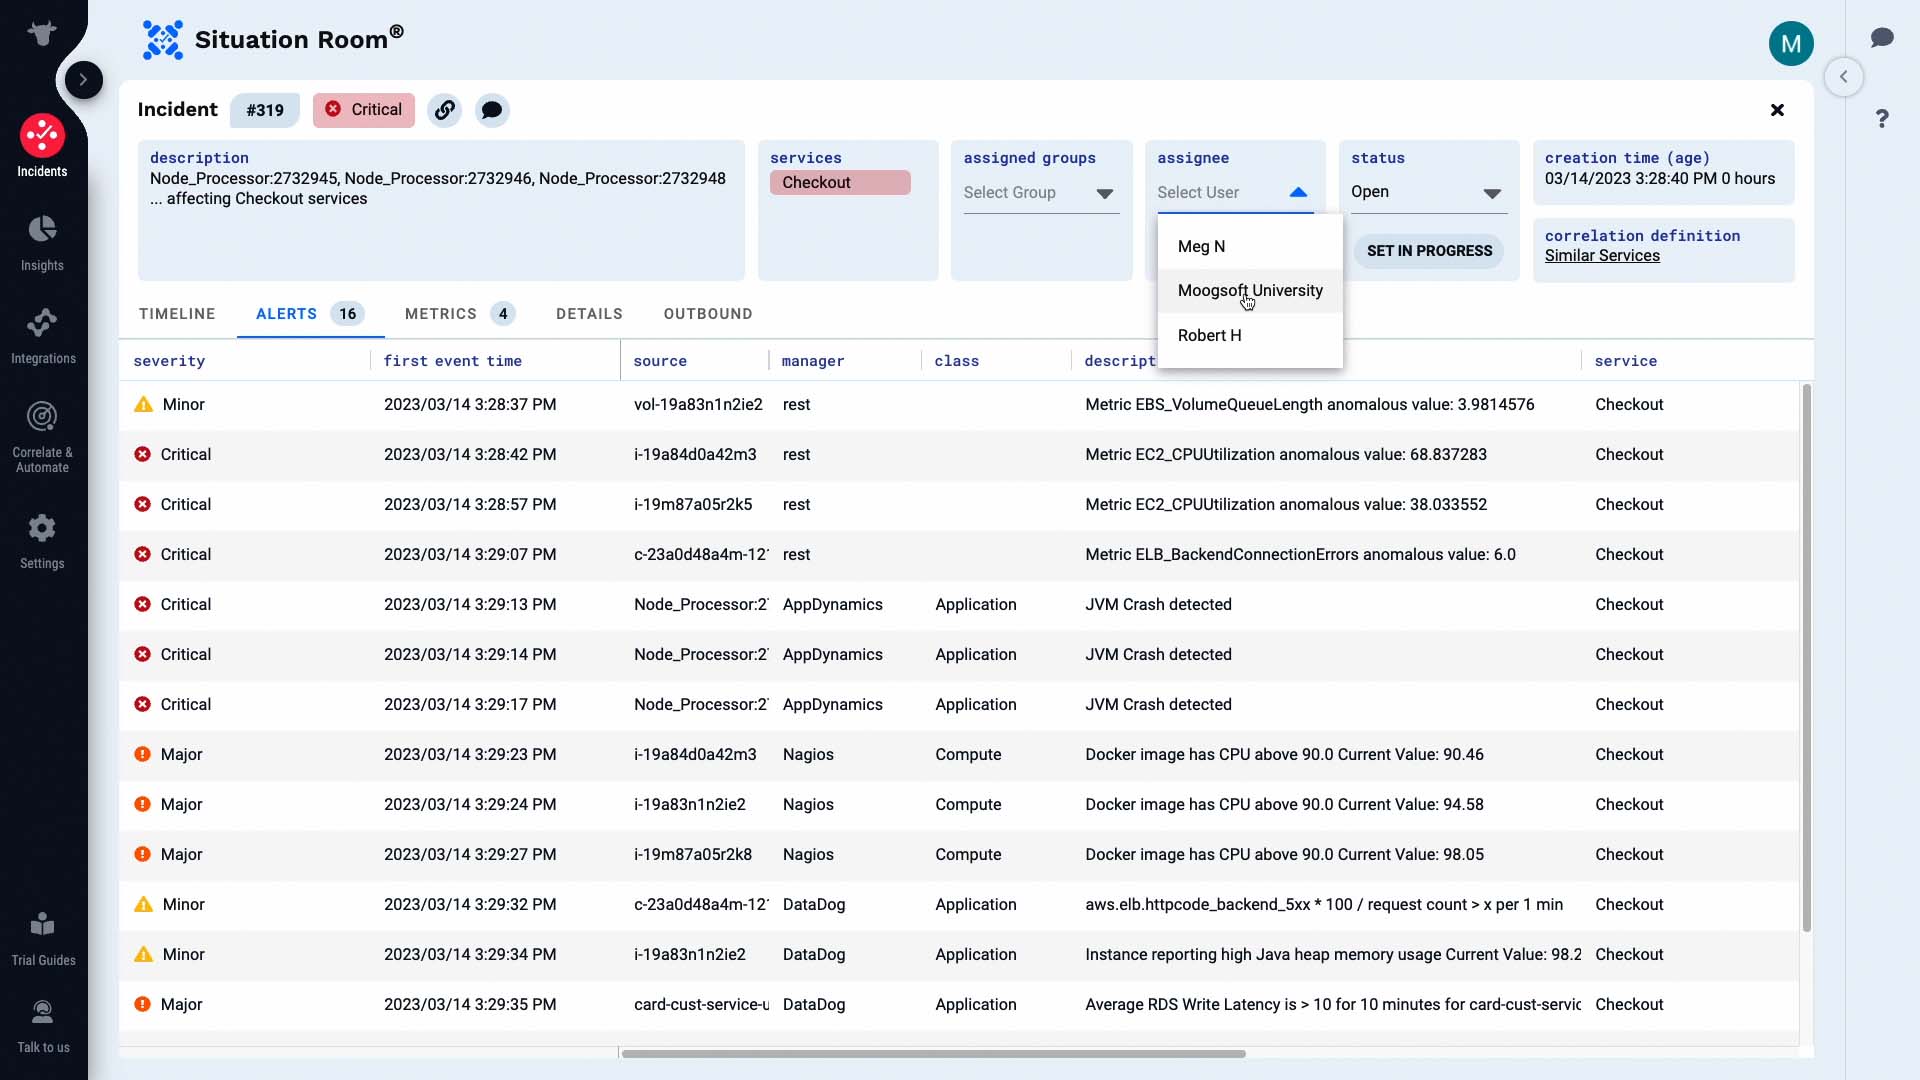
We are going to own this incident.
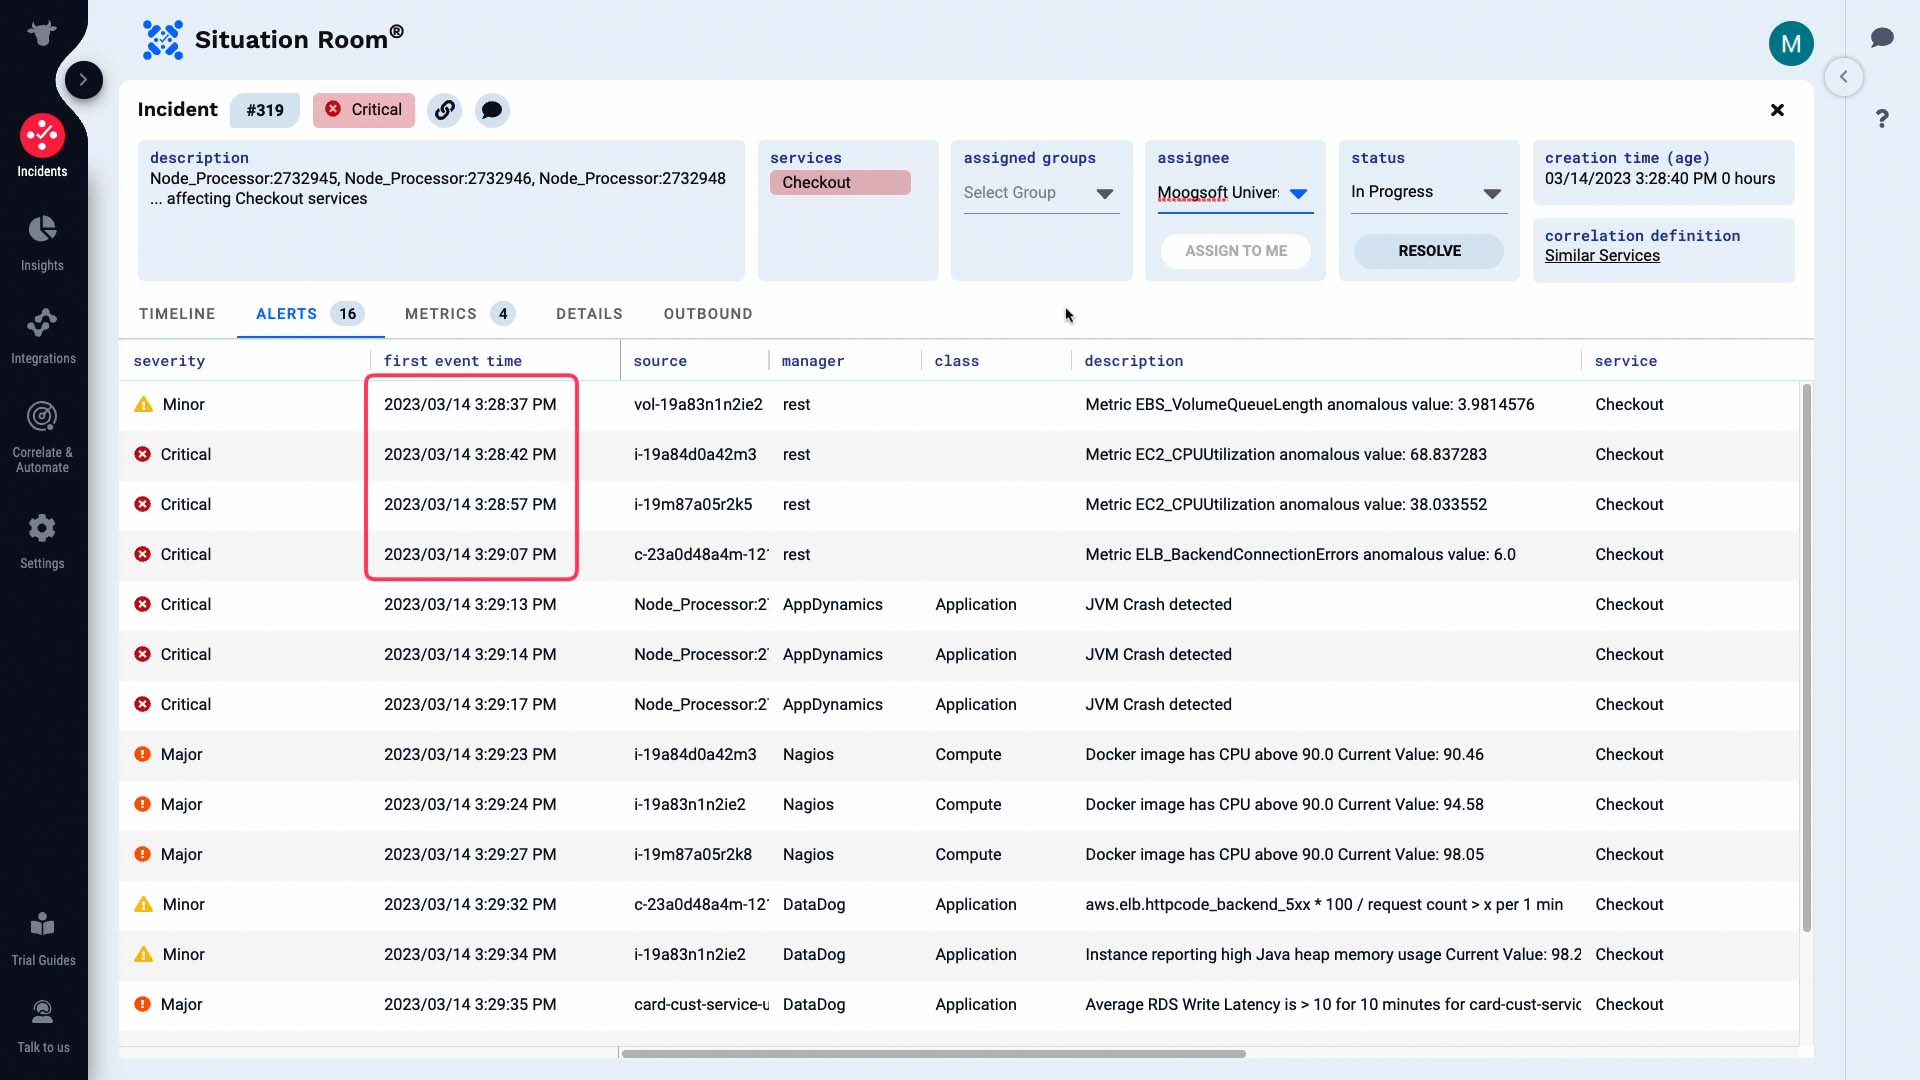
Now we will start our investigation.
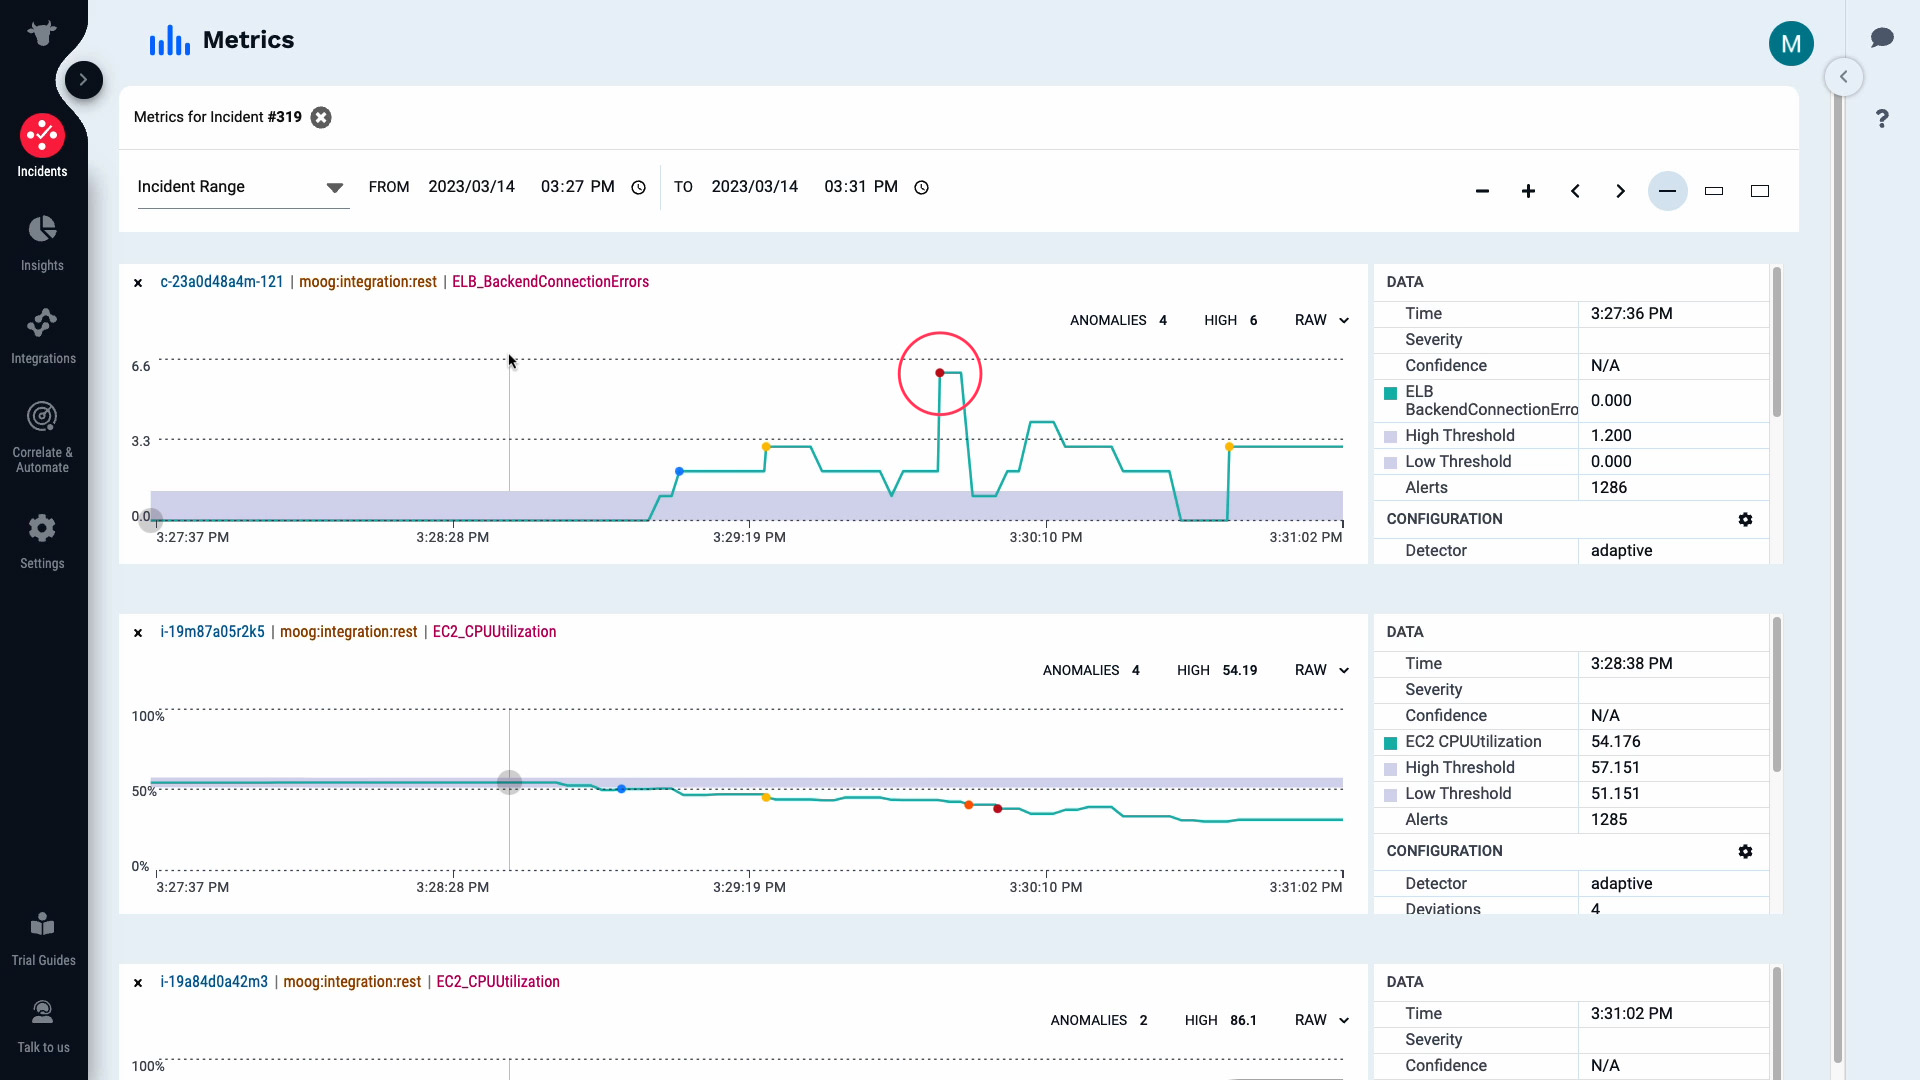
These alerts came in within a few seconds of each other. Let’s look at the details of this first alert.
All attributes of this alert are visible now.
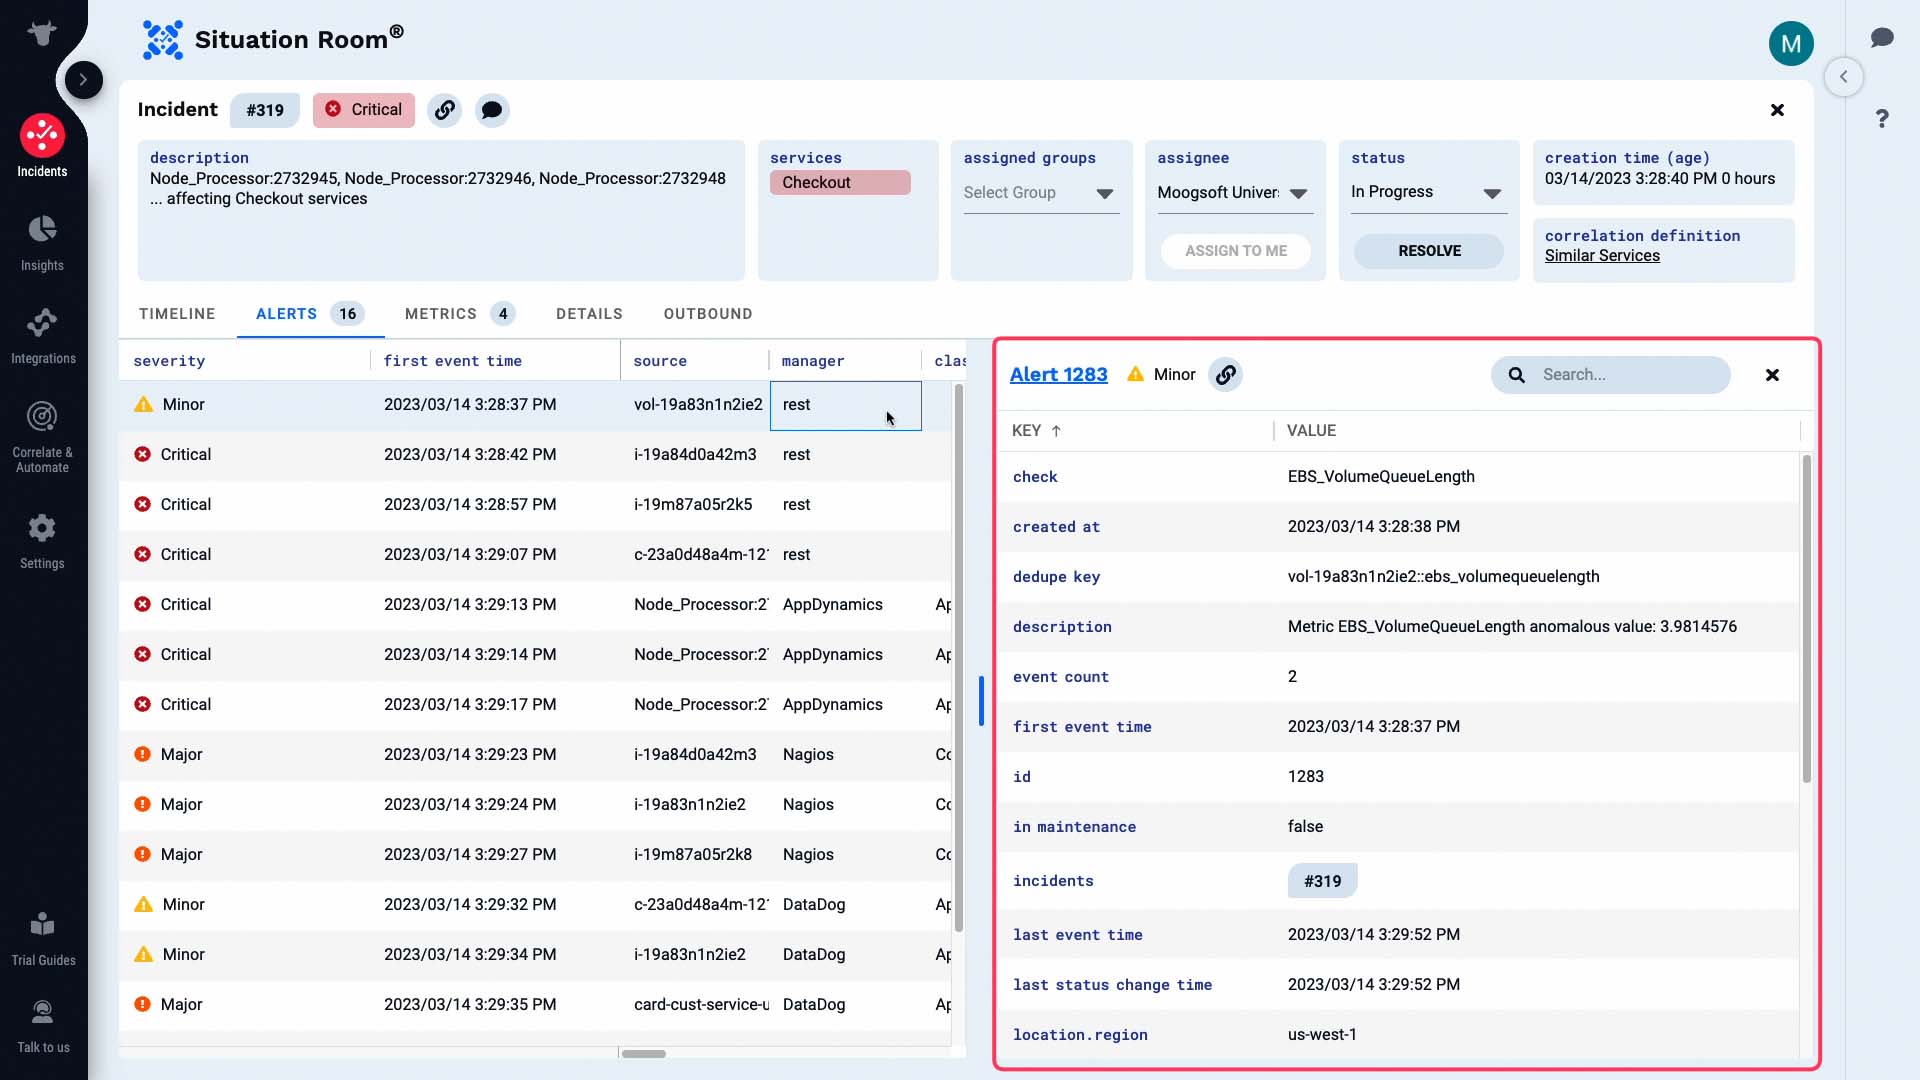
And the metric information of the alert is visually presented here.
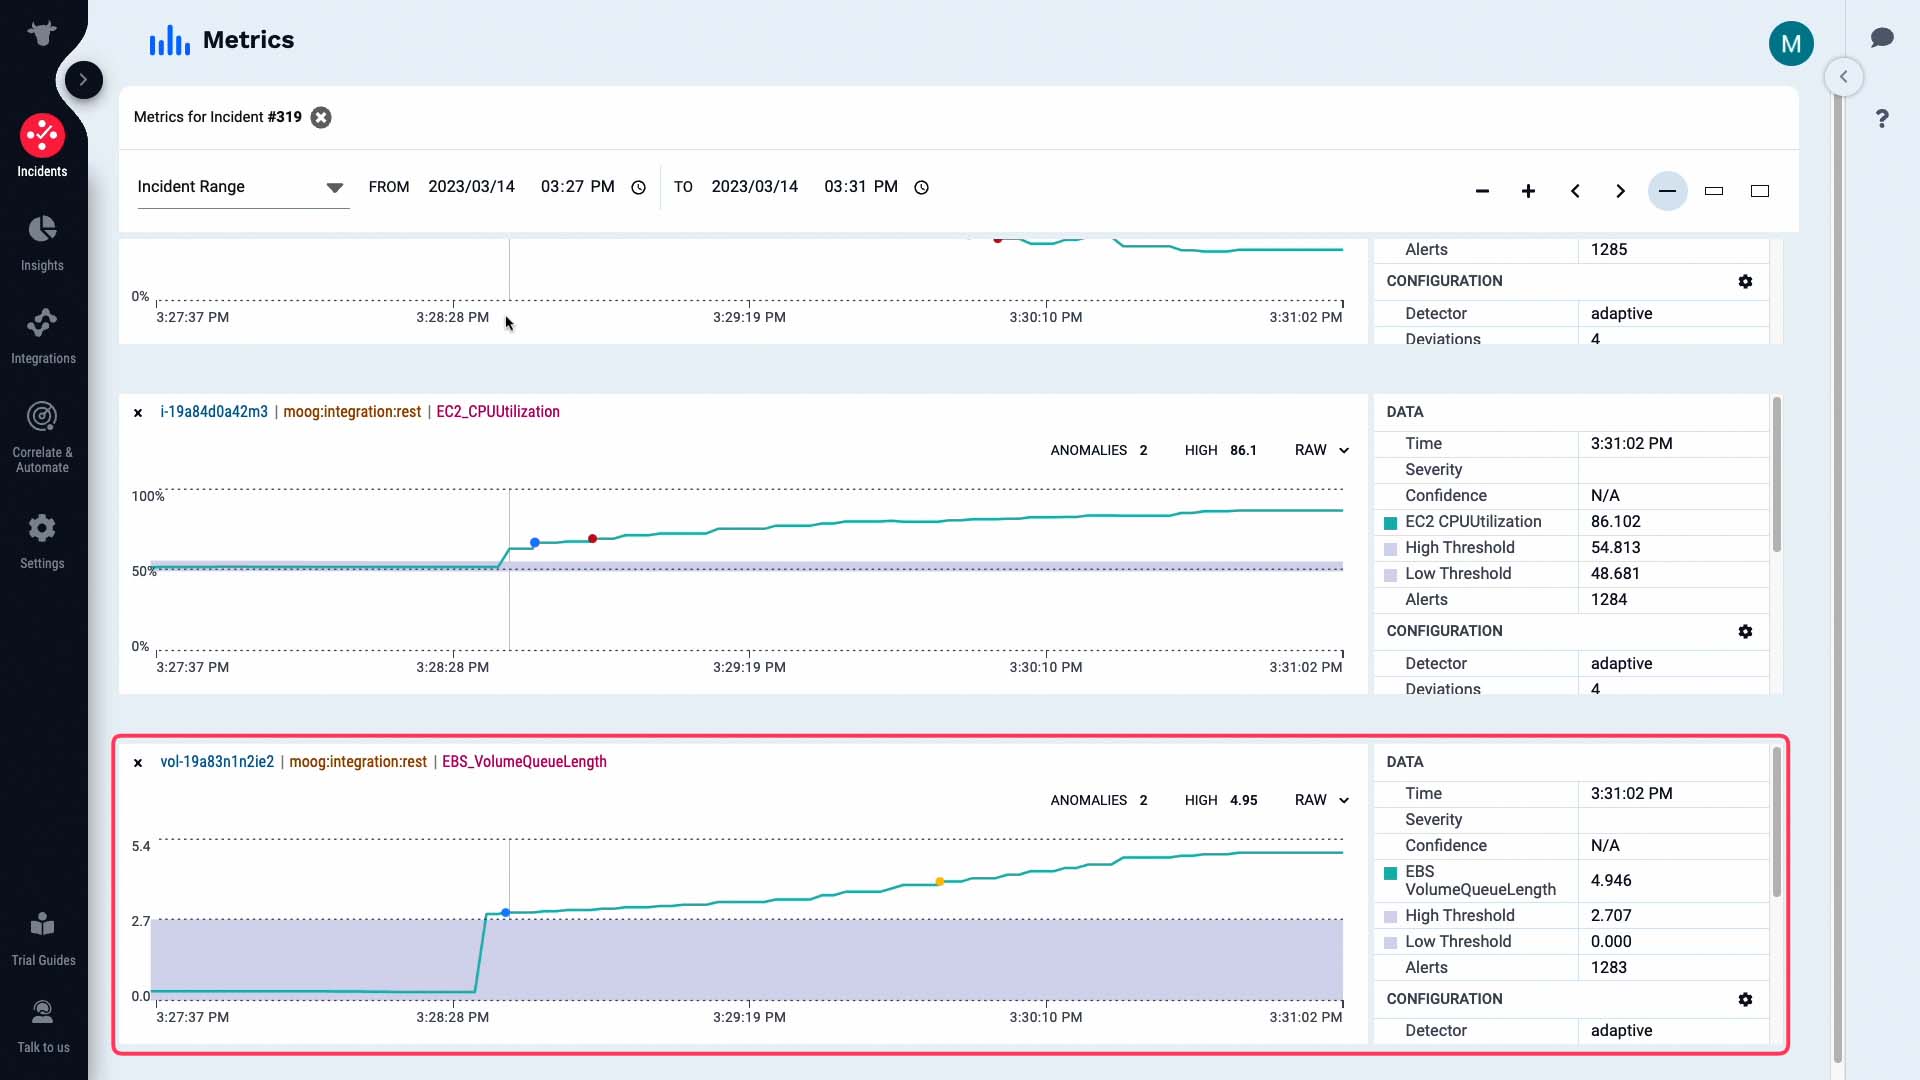
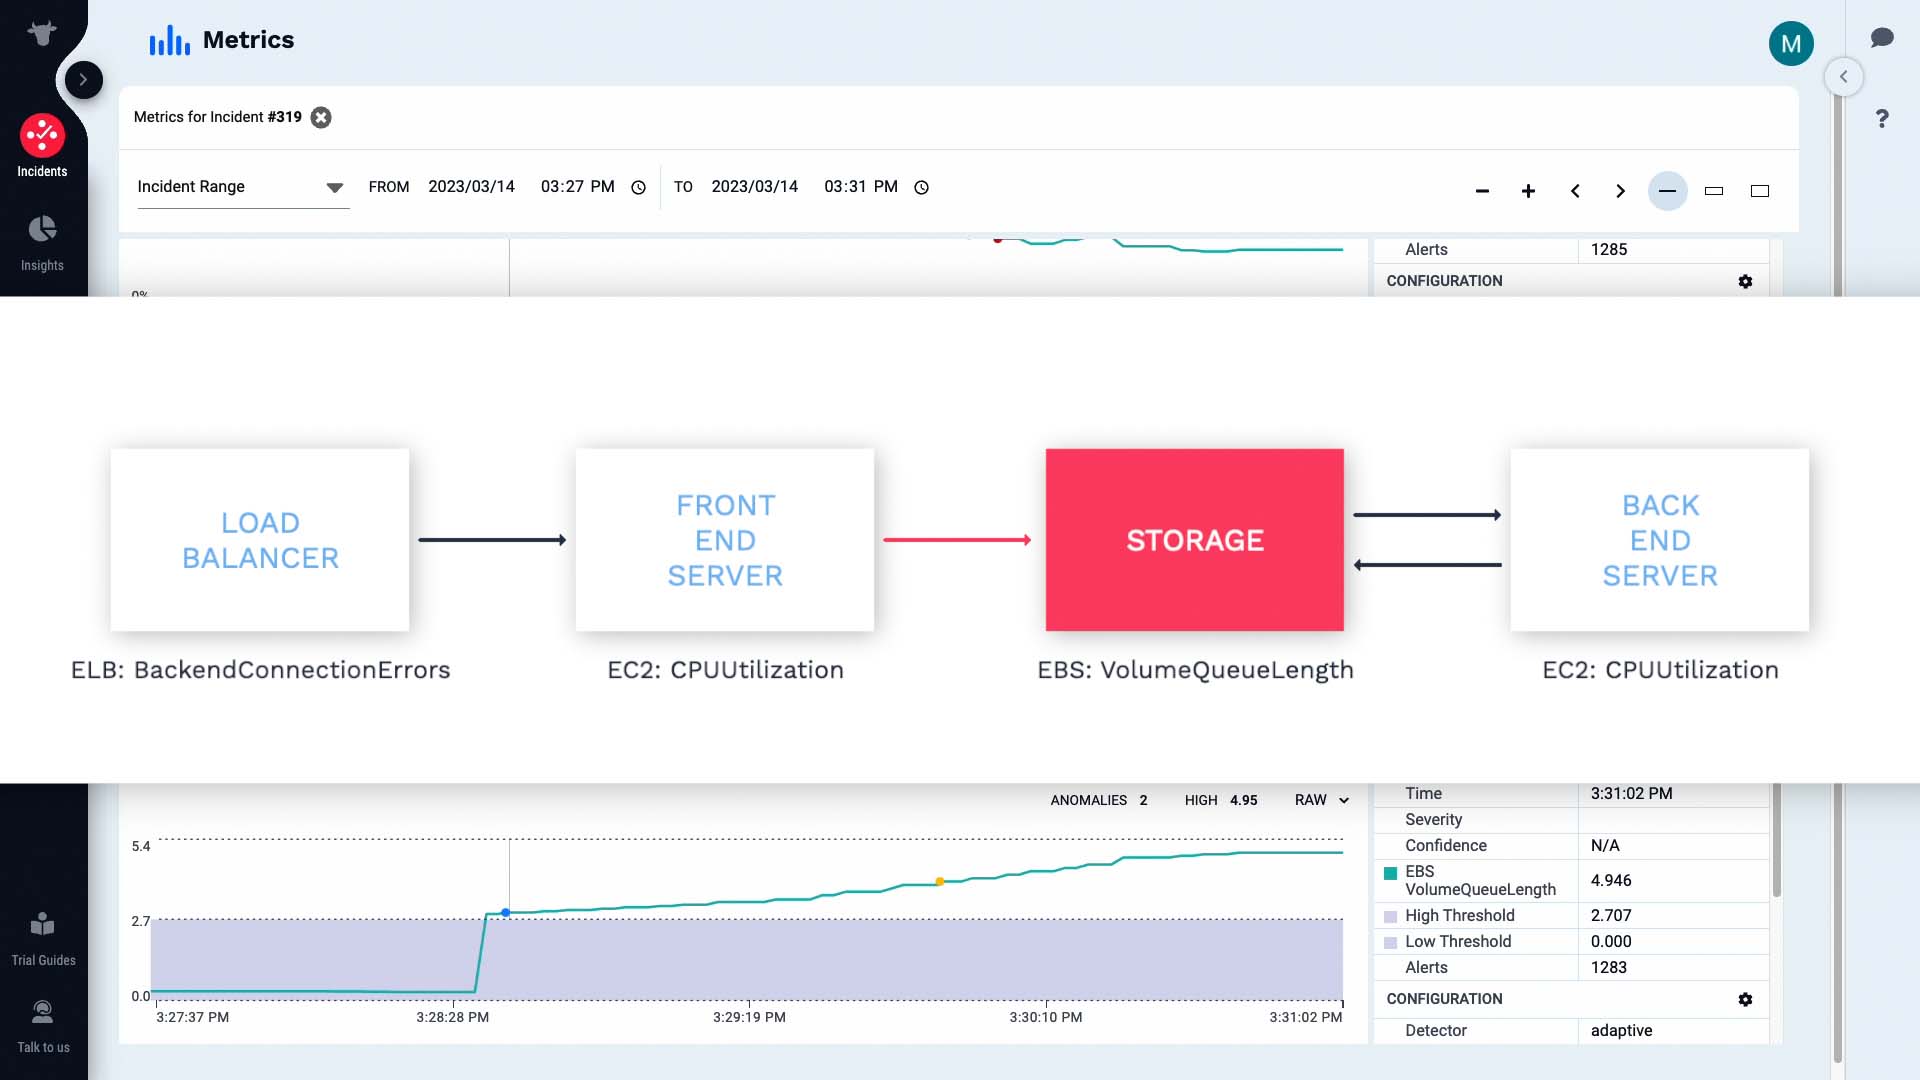
Moogsoft shows you the relevant context and their relationship to each other. This way, it’s much easier to grasp how the whole incident unfolded over time.
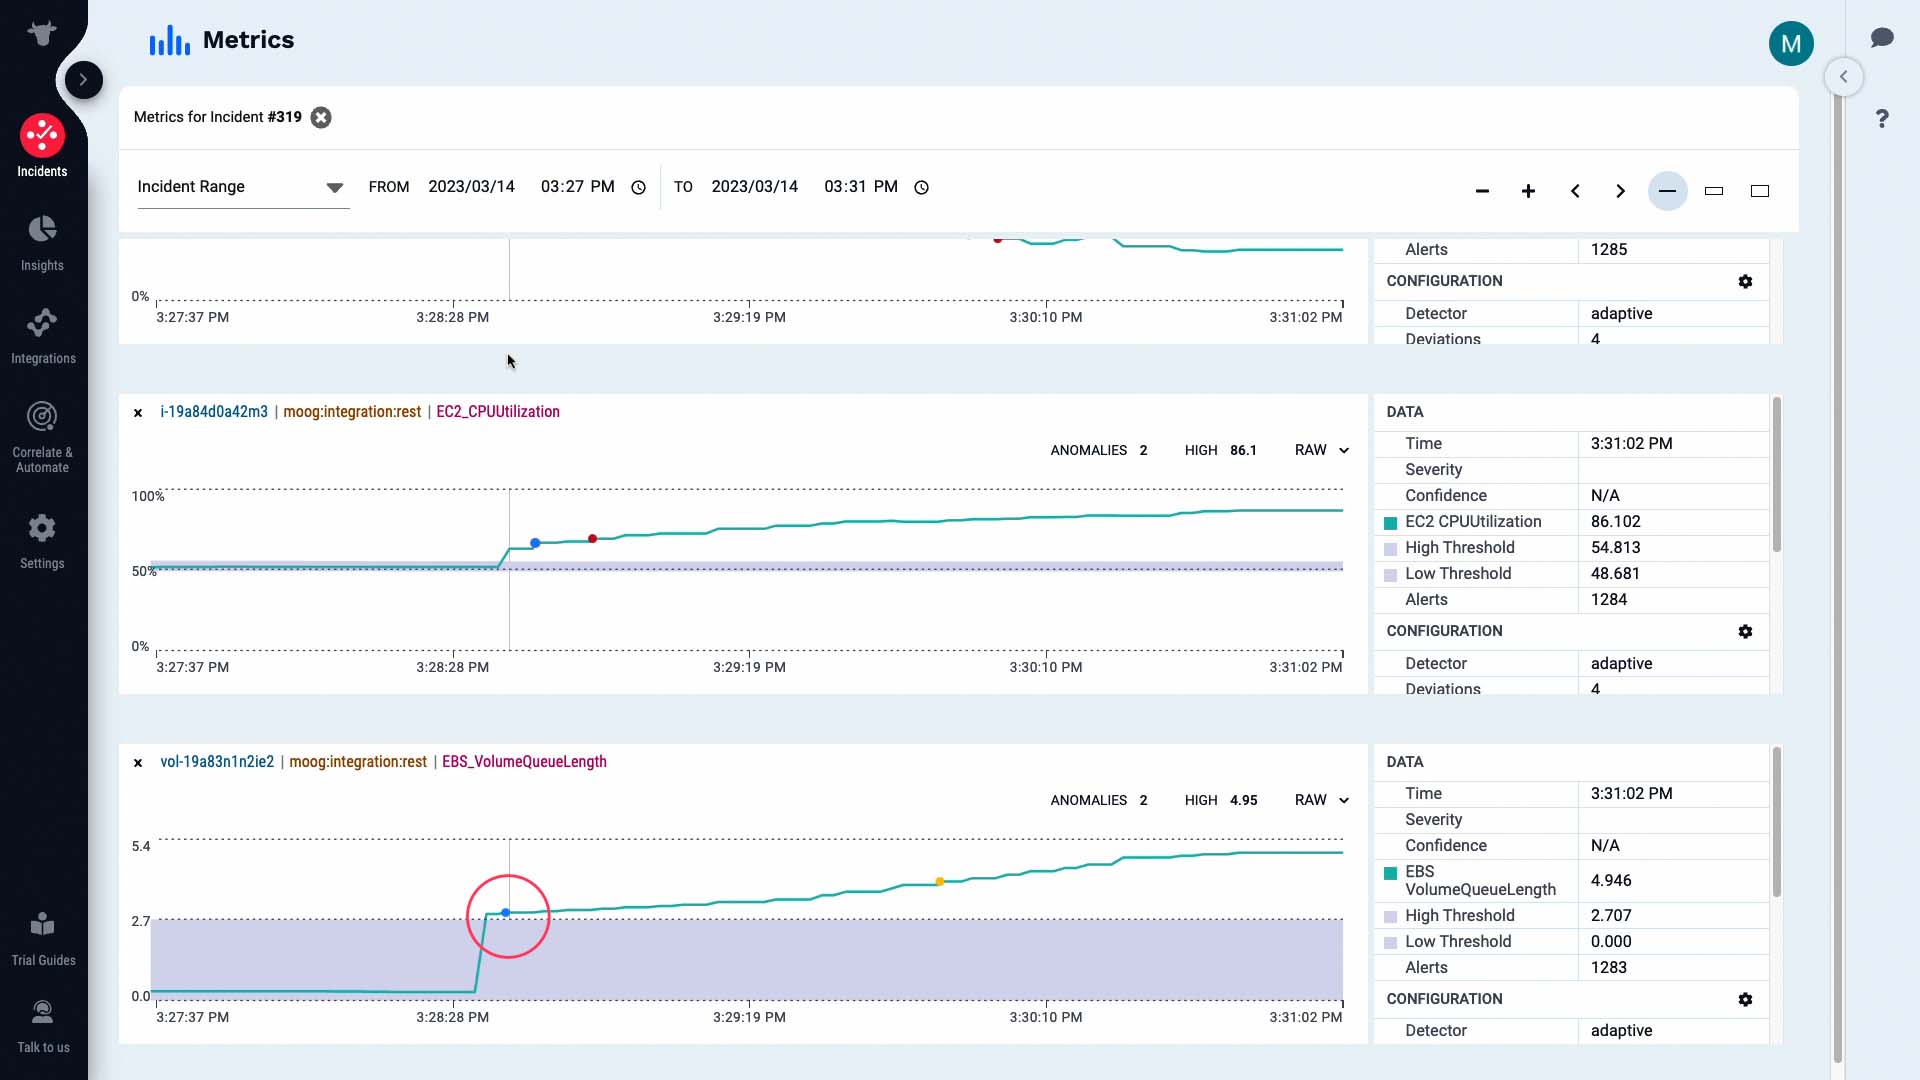
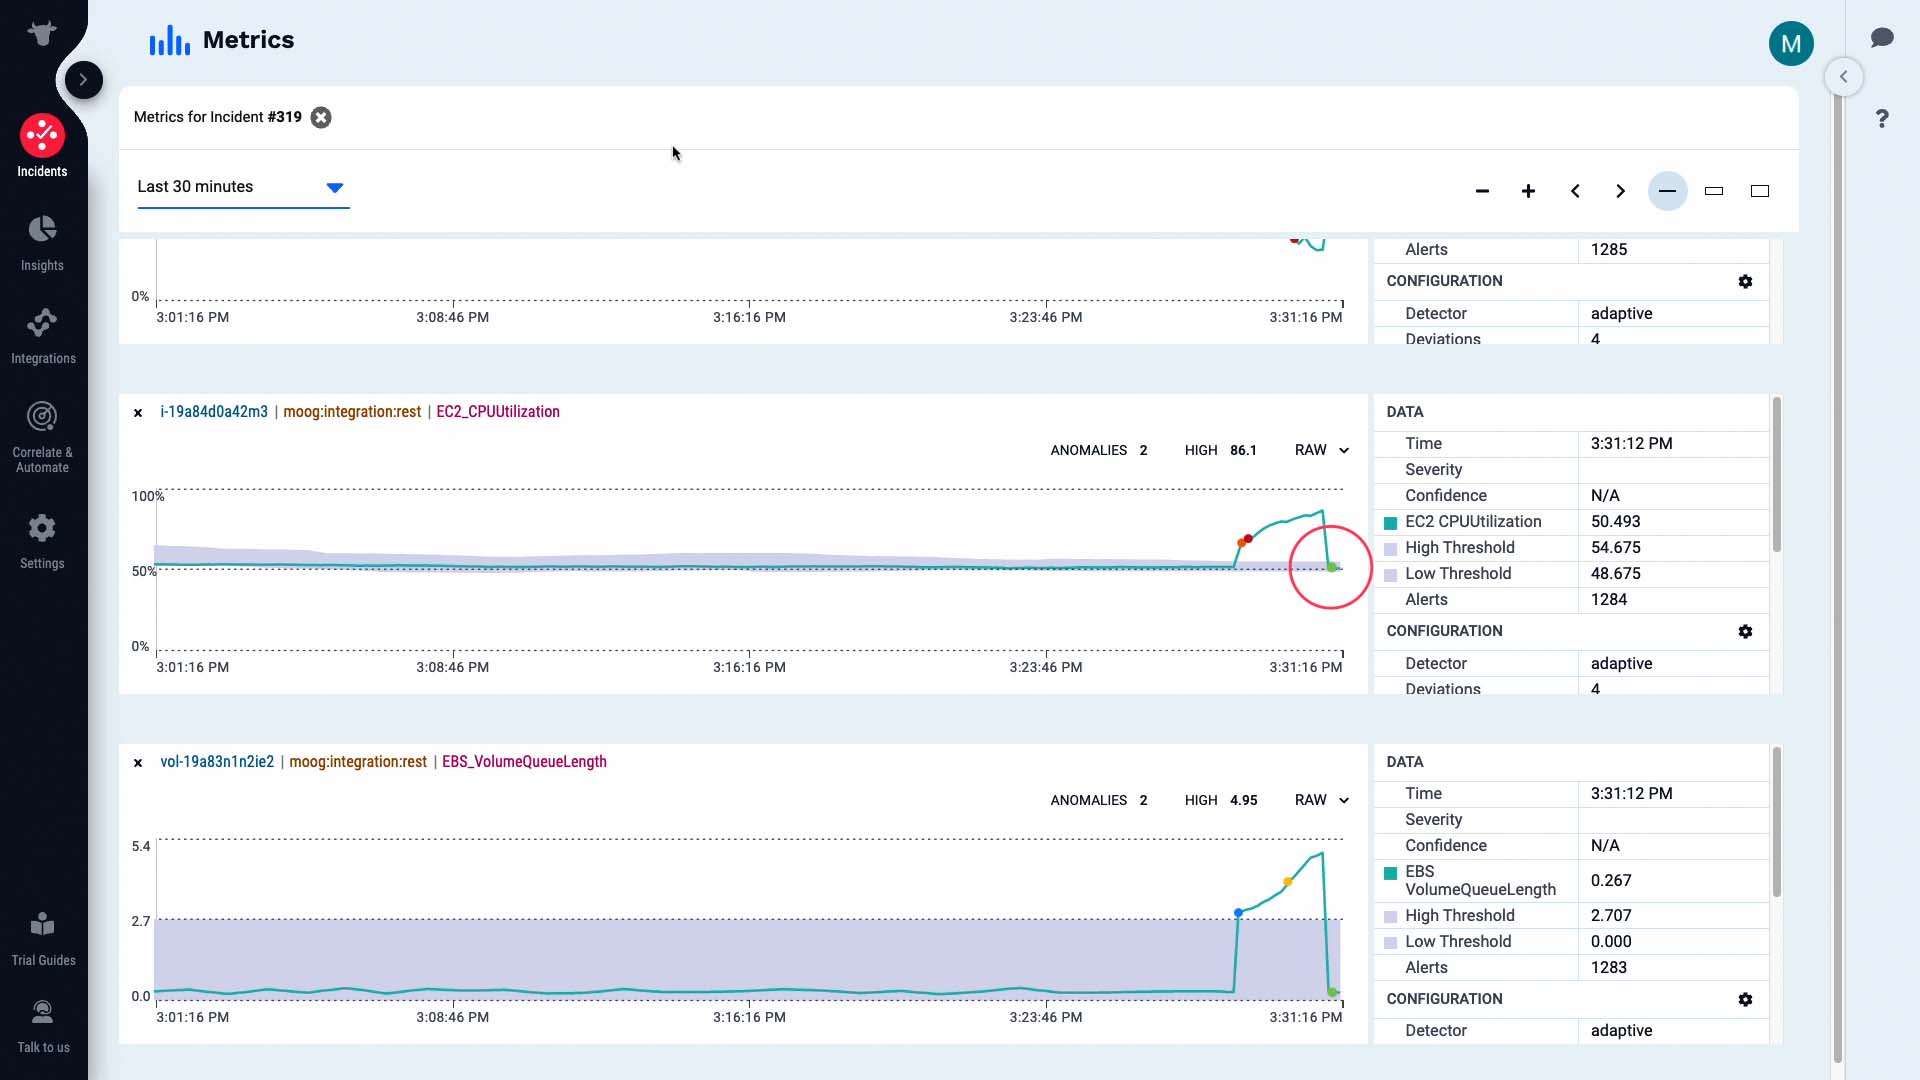
According to this, the volume queue length metric exceeded the threshold level and triggered a warning alert.
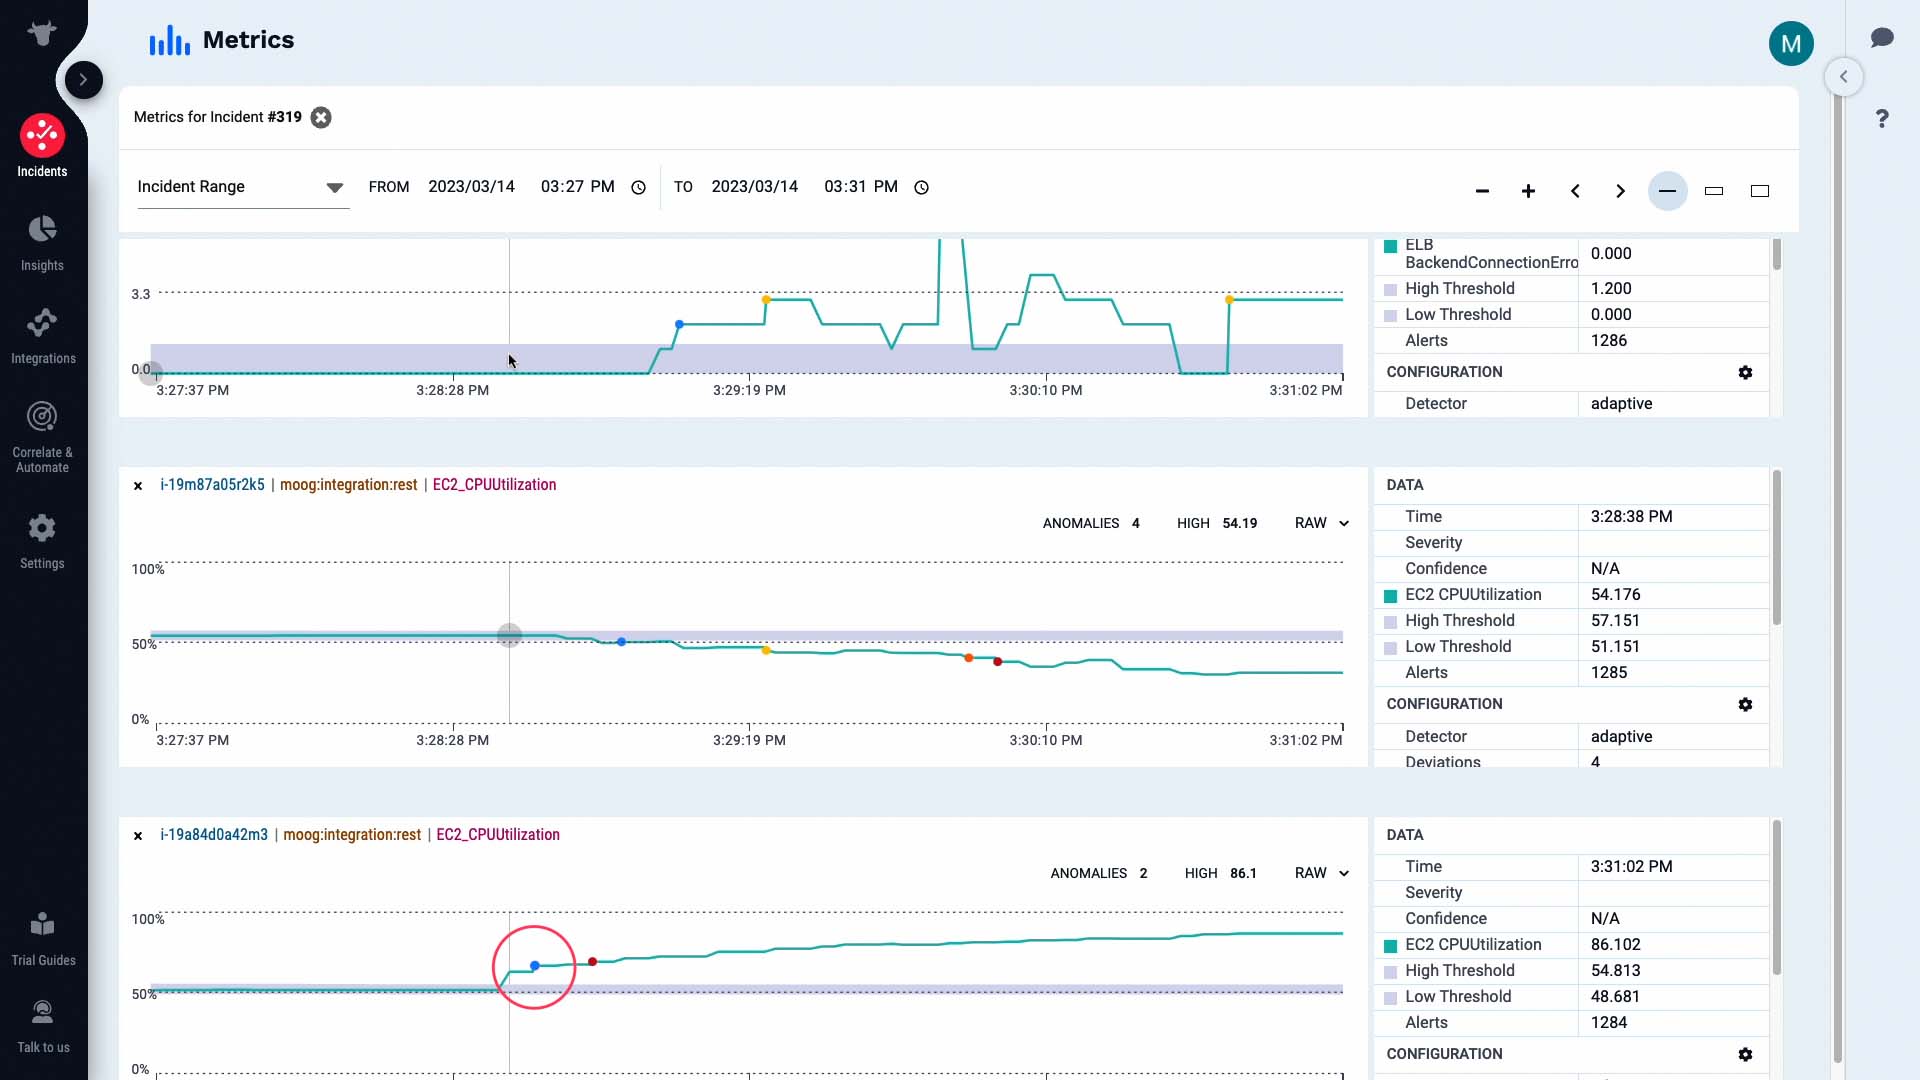
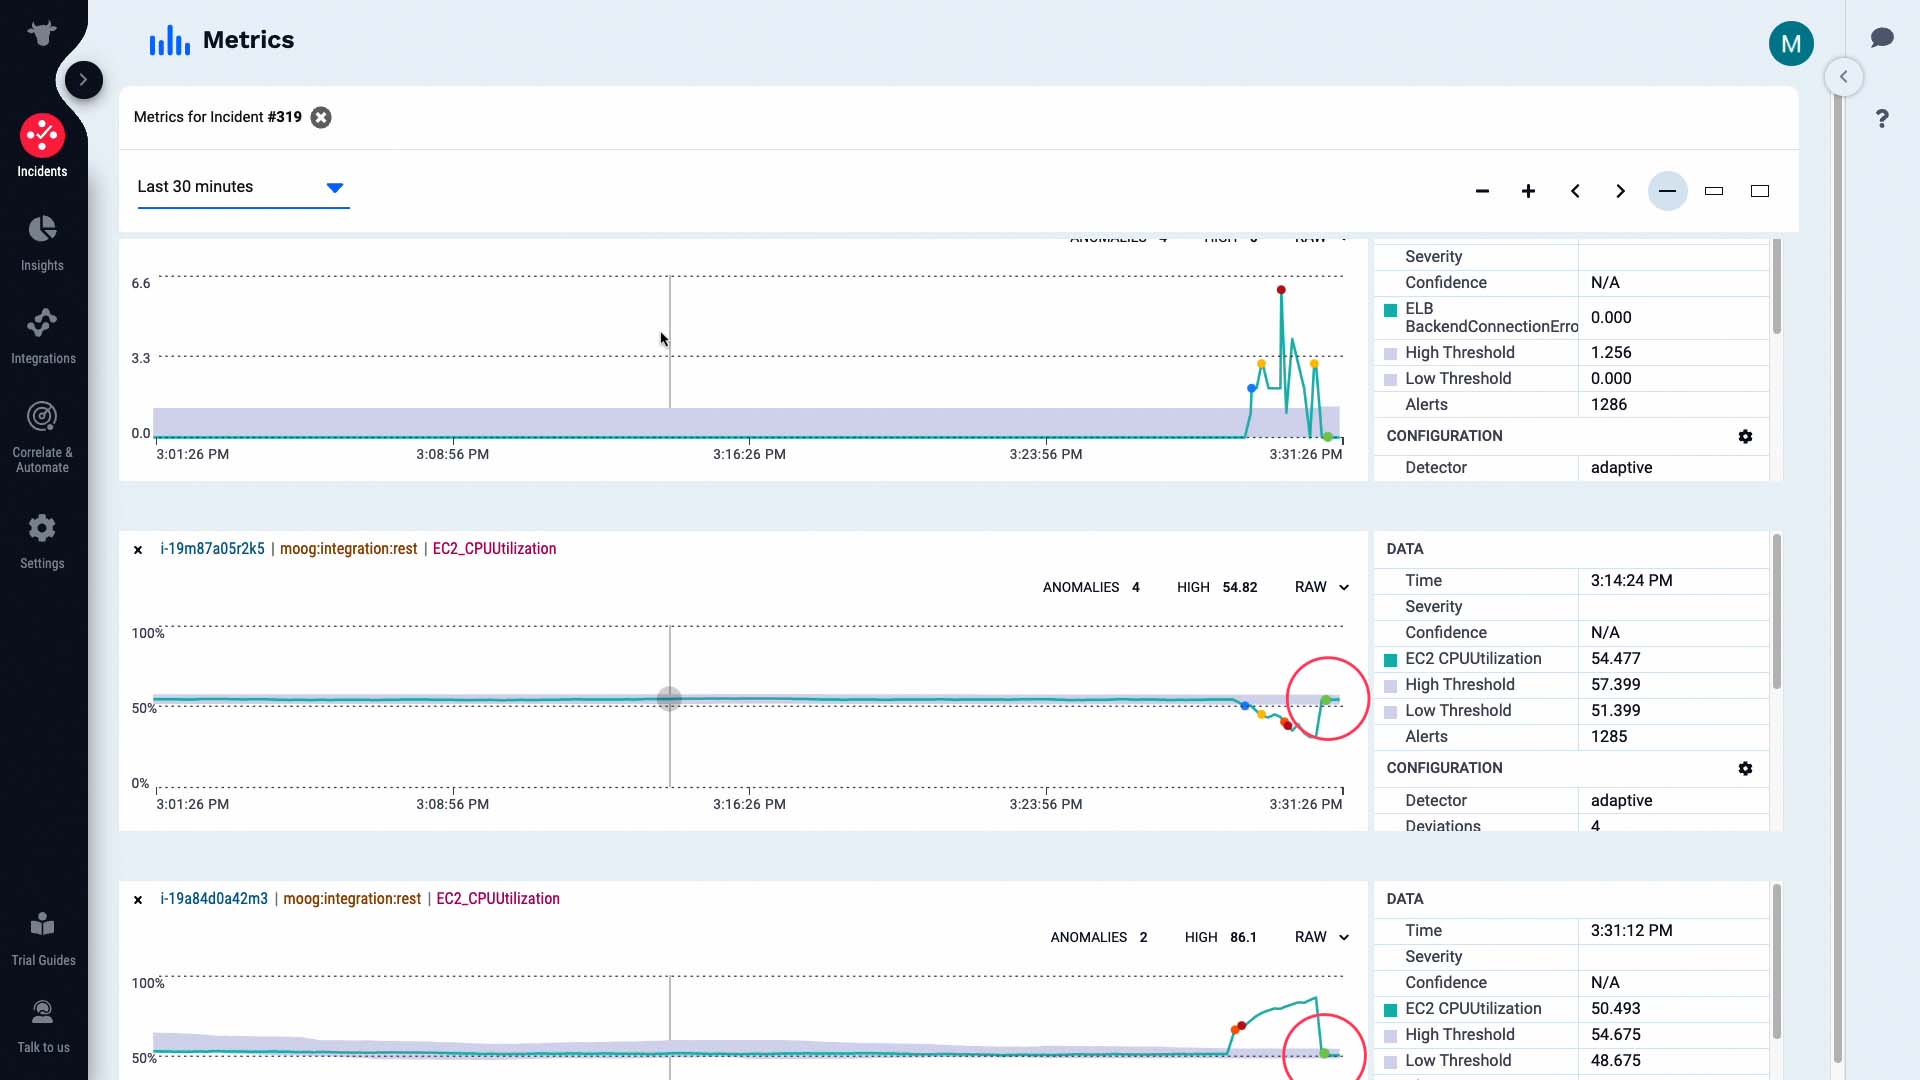
Then the CPU usage metric on our front end server increased and triggered a warning alert...
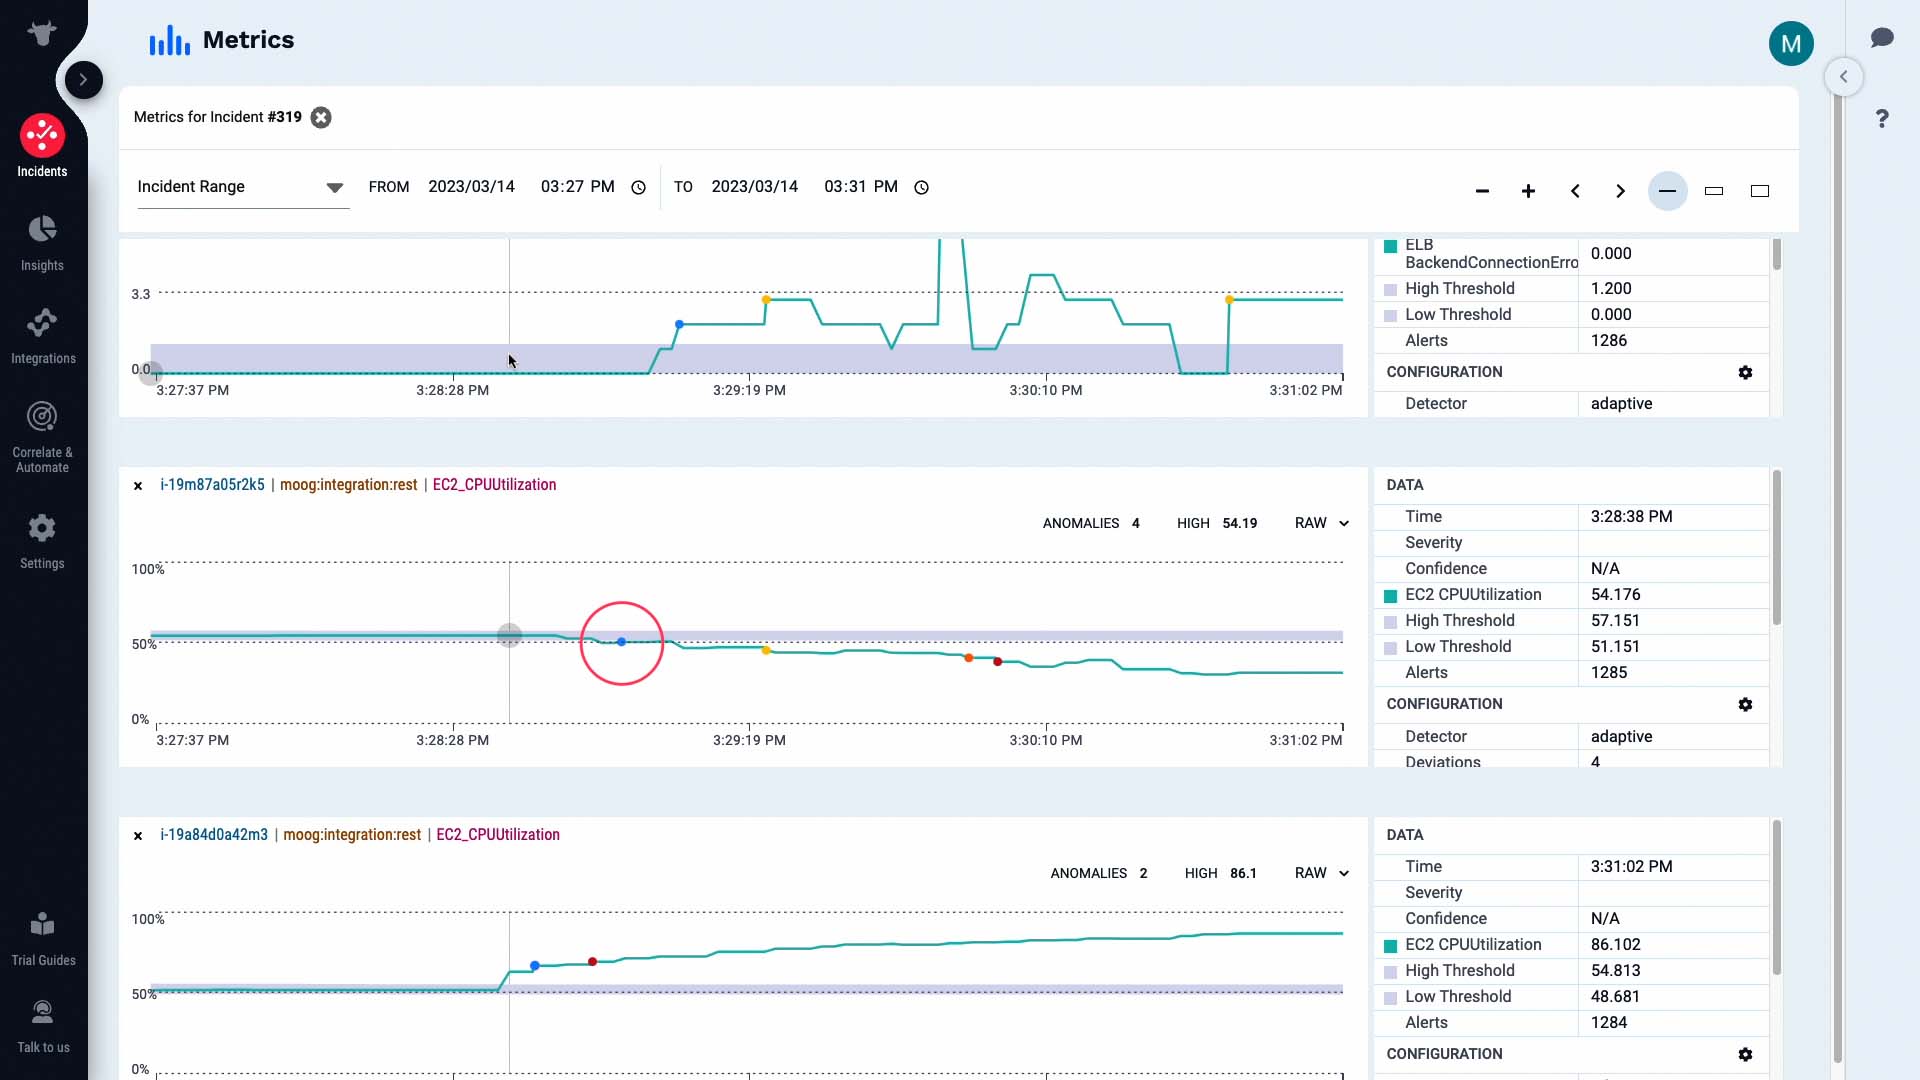
...the activity on the backend server fell...
...and we are seeing a backend connection error critical alert.
So, could this be the root cause that had a cascading effect to cause other alerts?
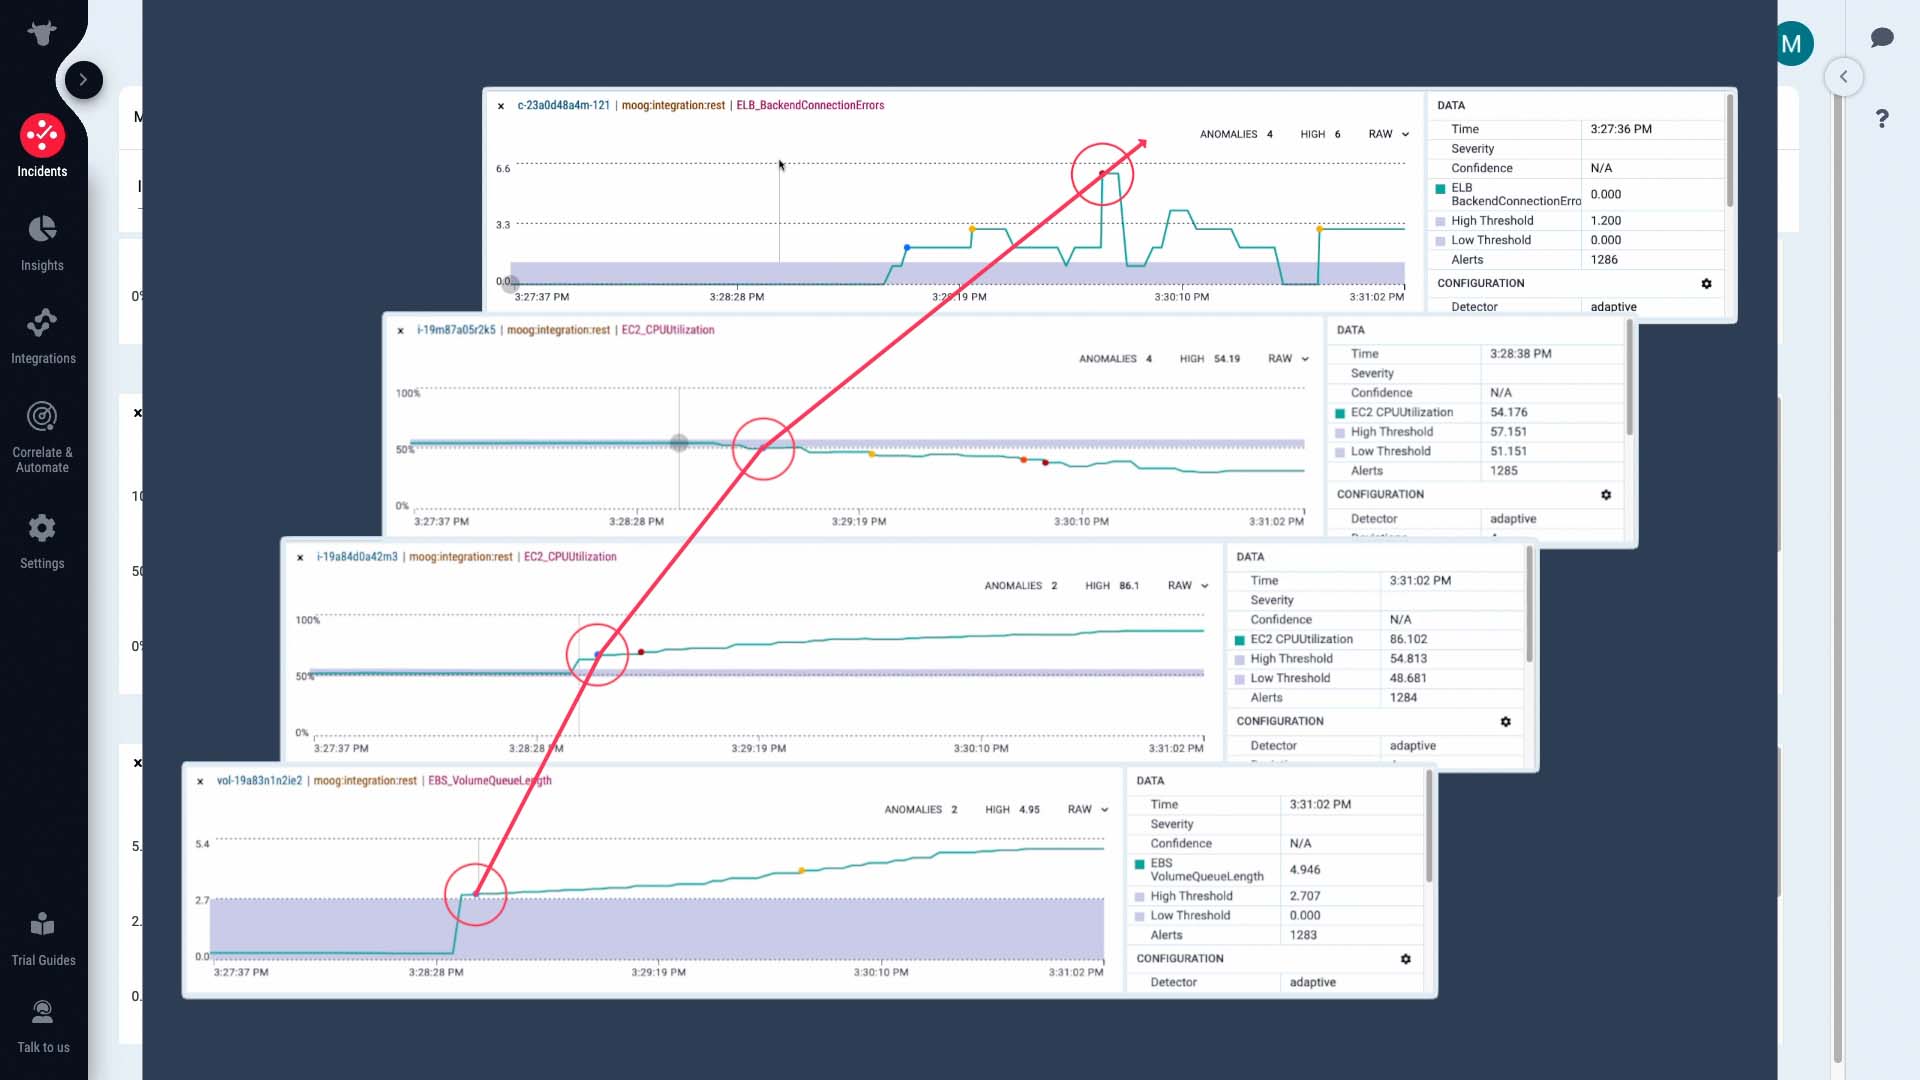
Like this, looking at the key happenings and context of the time series data gives you an instant understanding of how the incident unfolded.
We’ve confirmed that the disk I/O bottleneck indicated by the increase in Volume Queue Length is causing the incident. We have a runbook tool we can use to free up resources.
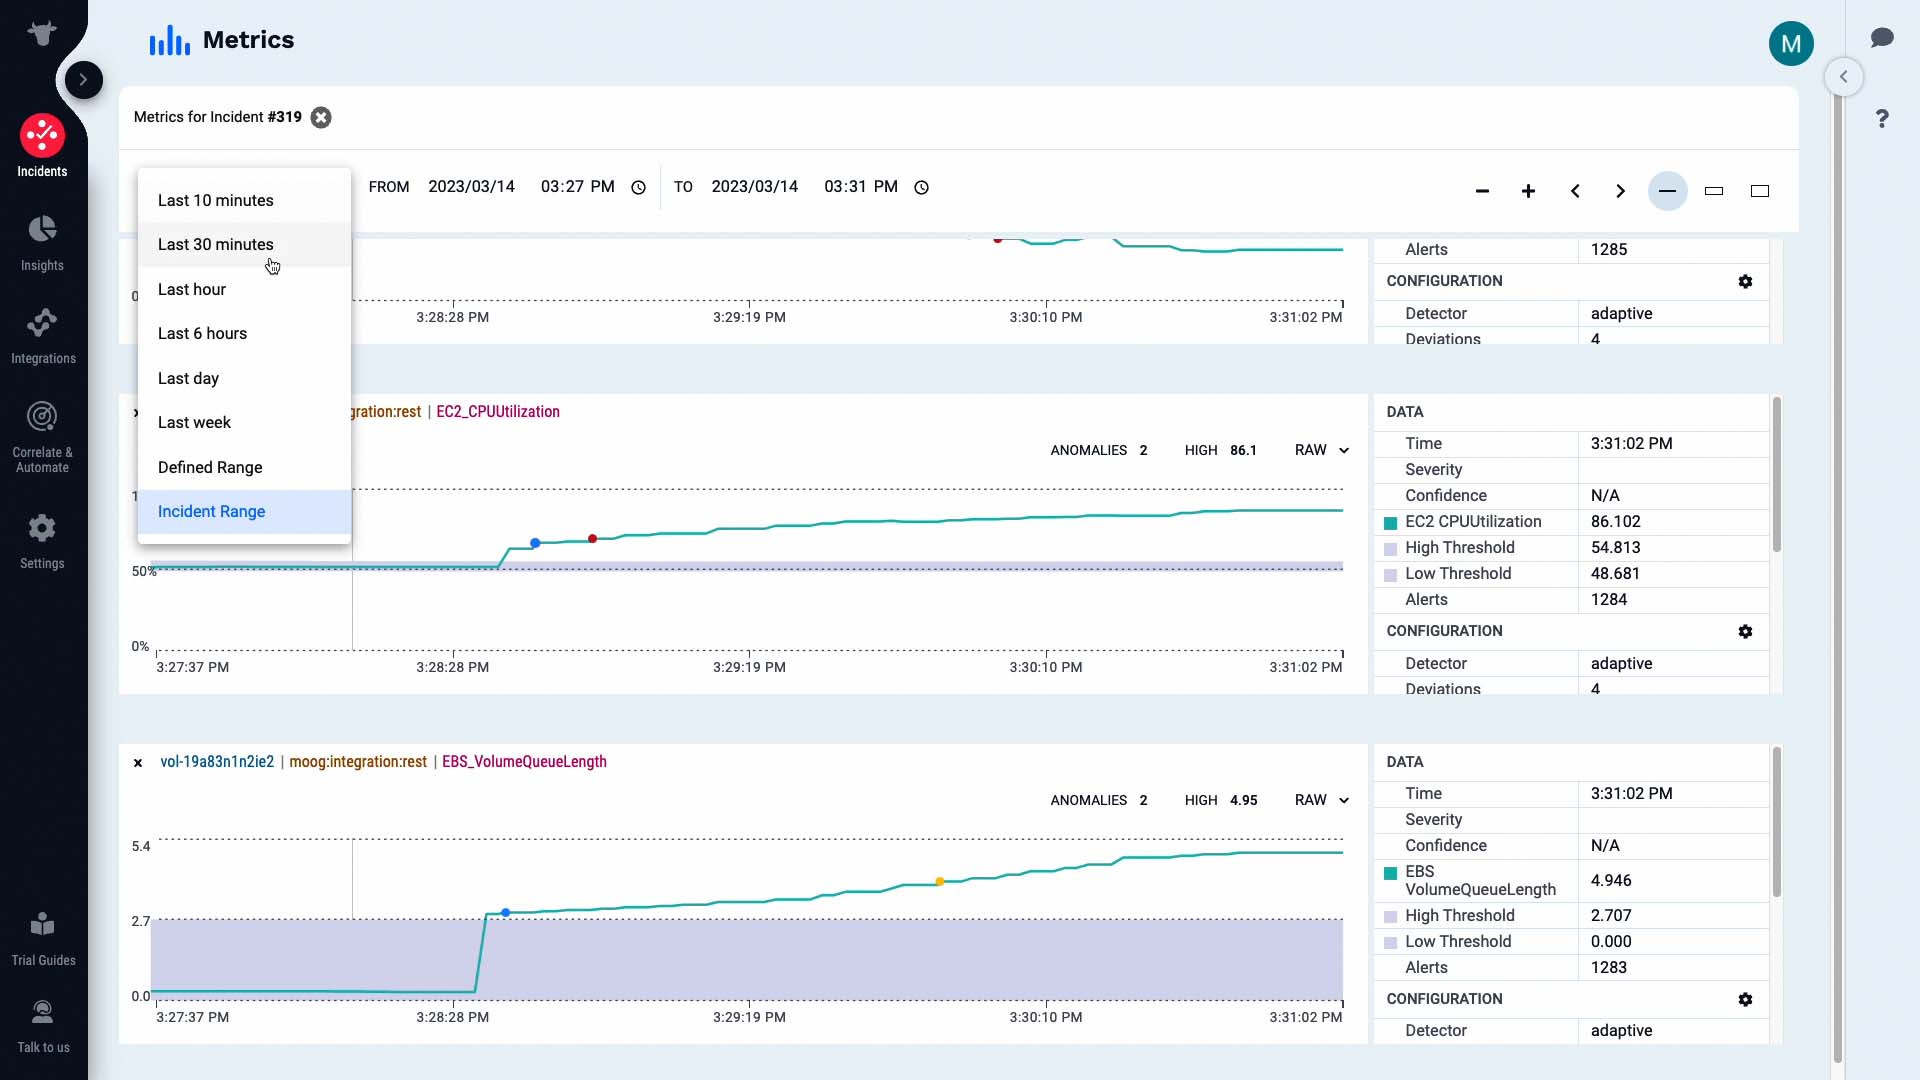
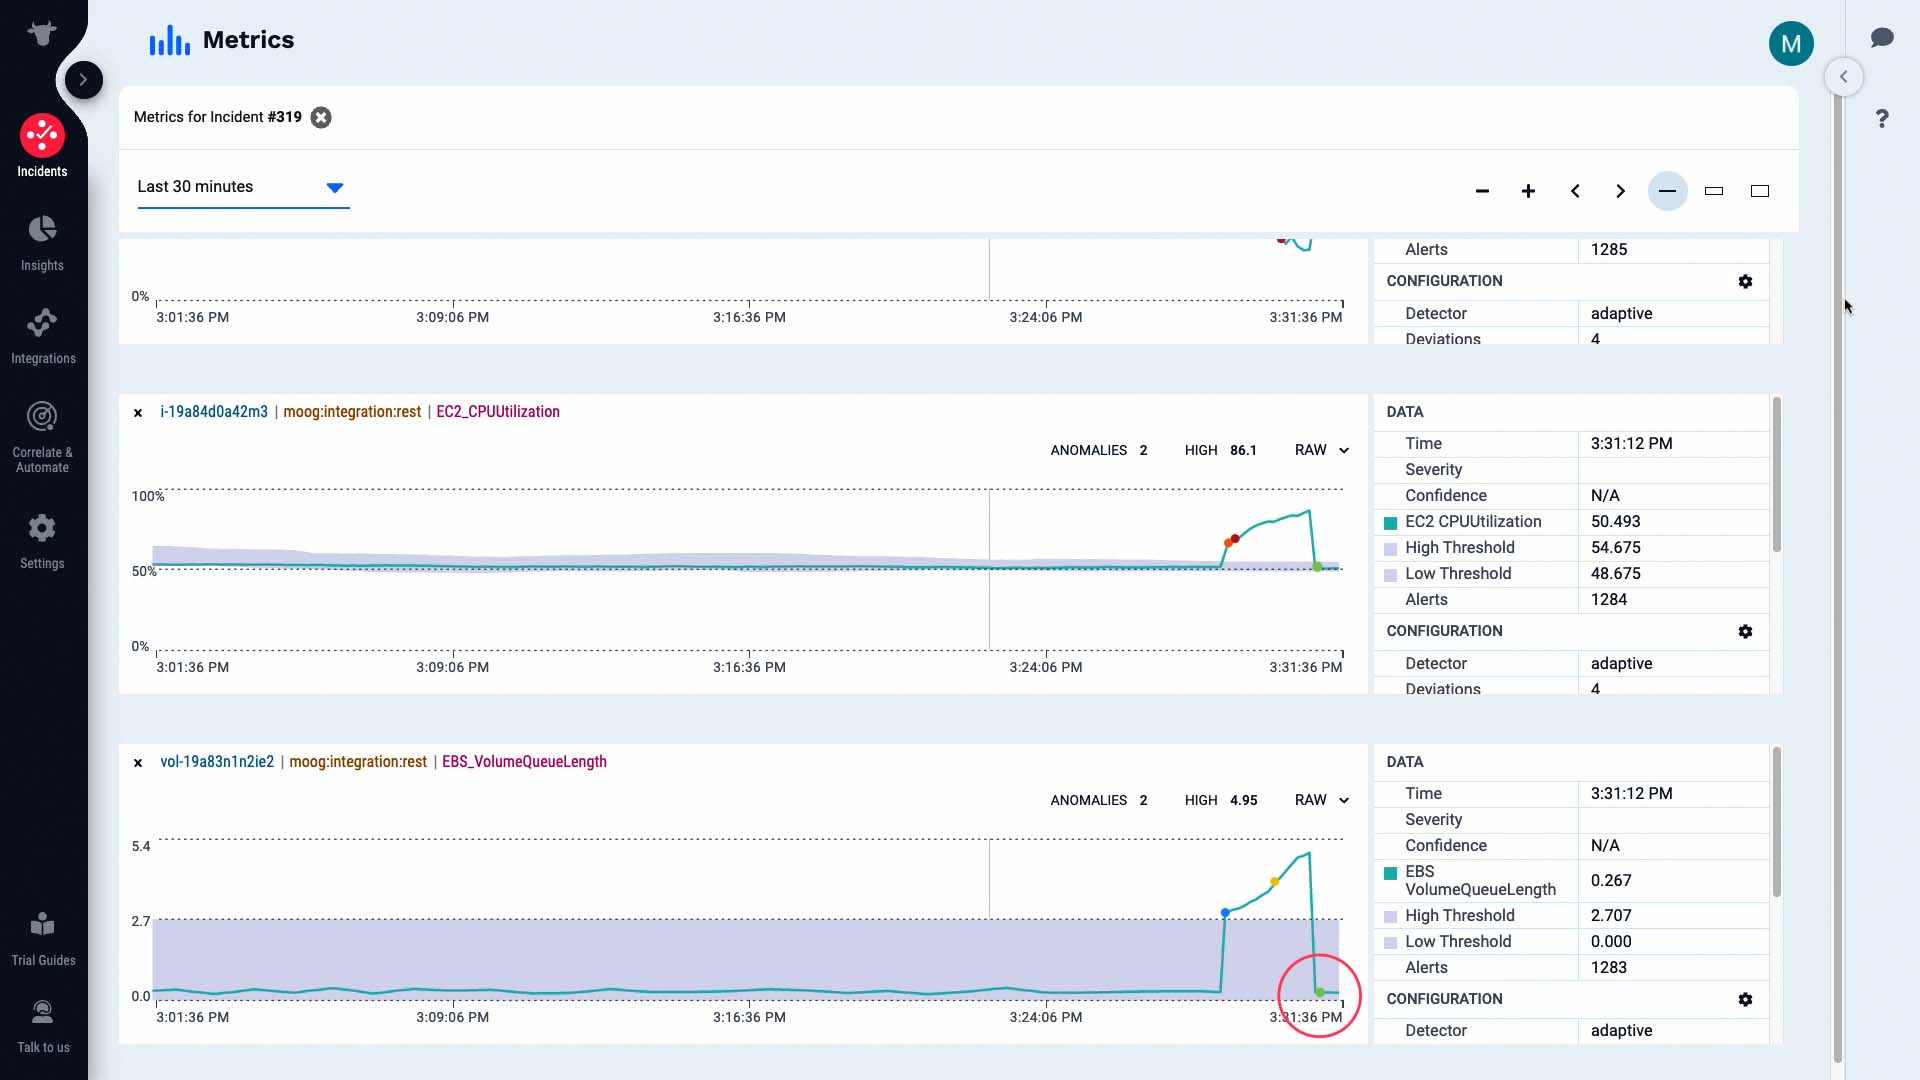
Currently the time window we are seeing is from the moment when the first alert in the incident occurred. We want to see what happens to the metrics when we run the tool. So let’s change the time frame. Now, the metrics are going to be updated in real time.
We’ve run the tool, and with the runaway processes that were overloading I/O killed, the CPU load on the front-end web server is back to normal...
...and activity has resumed on the back end server as well.
Nice! The anomaly has resolved and now the metrics are within the normal range previously learned by the system. Good job!
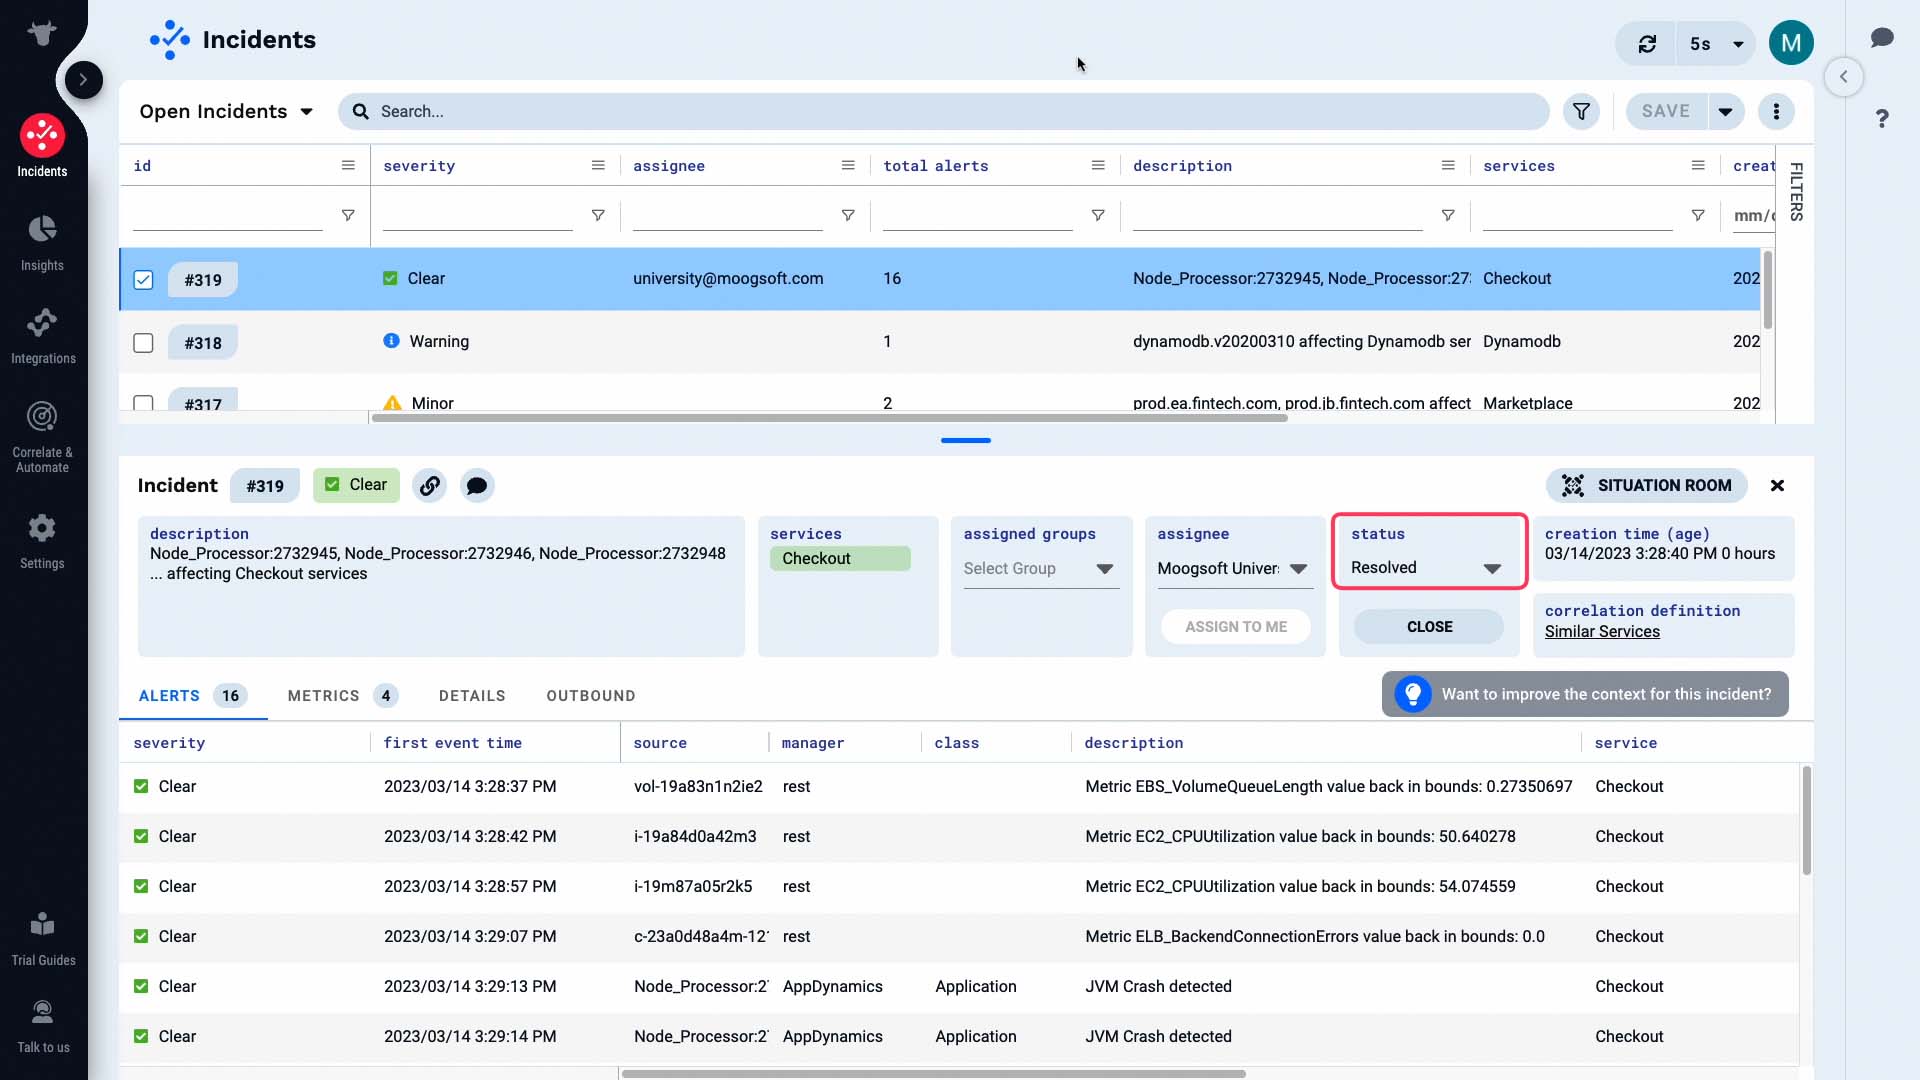
Now the alerts in our incident are all clear, as well as the incident itself.
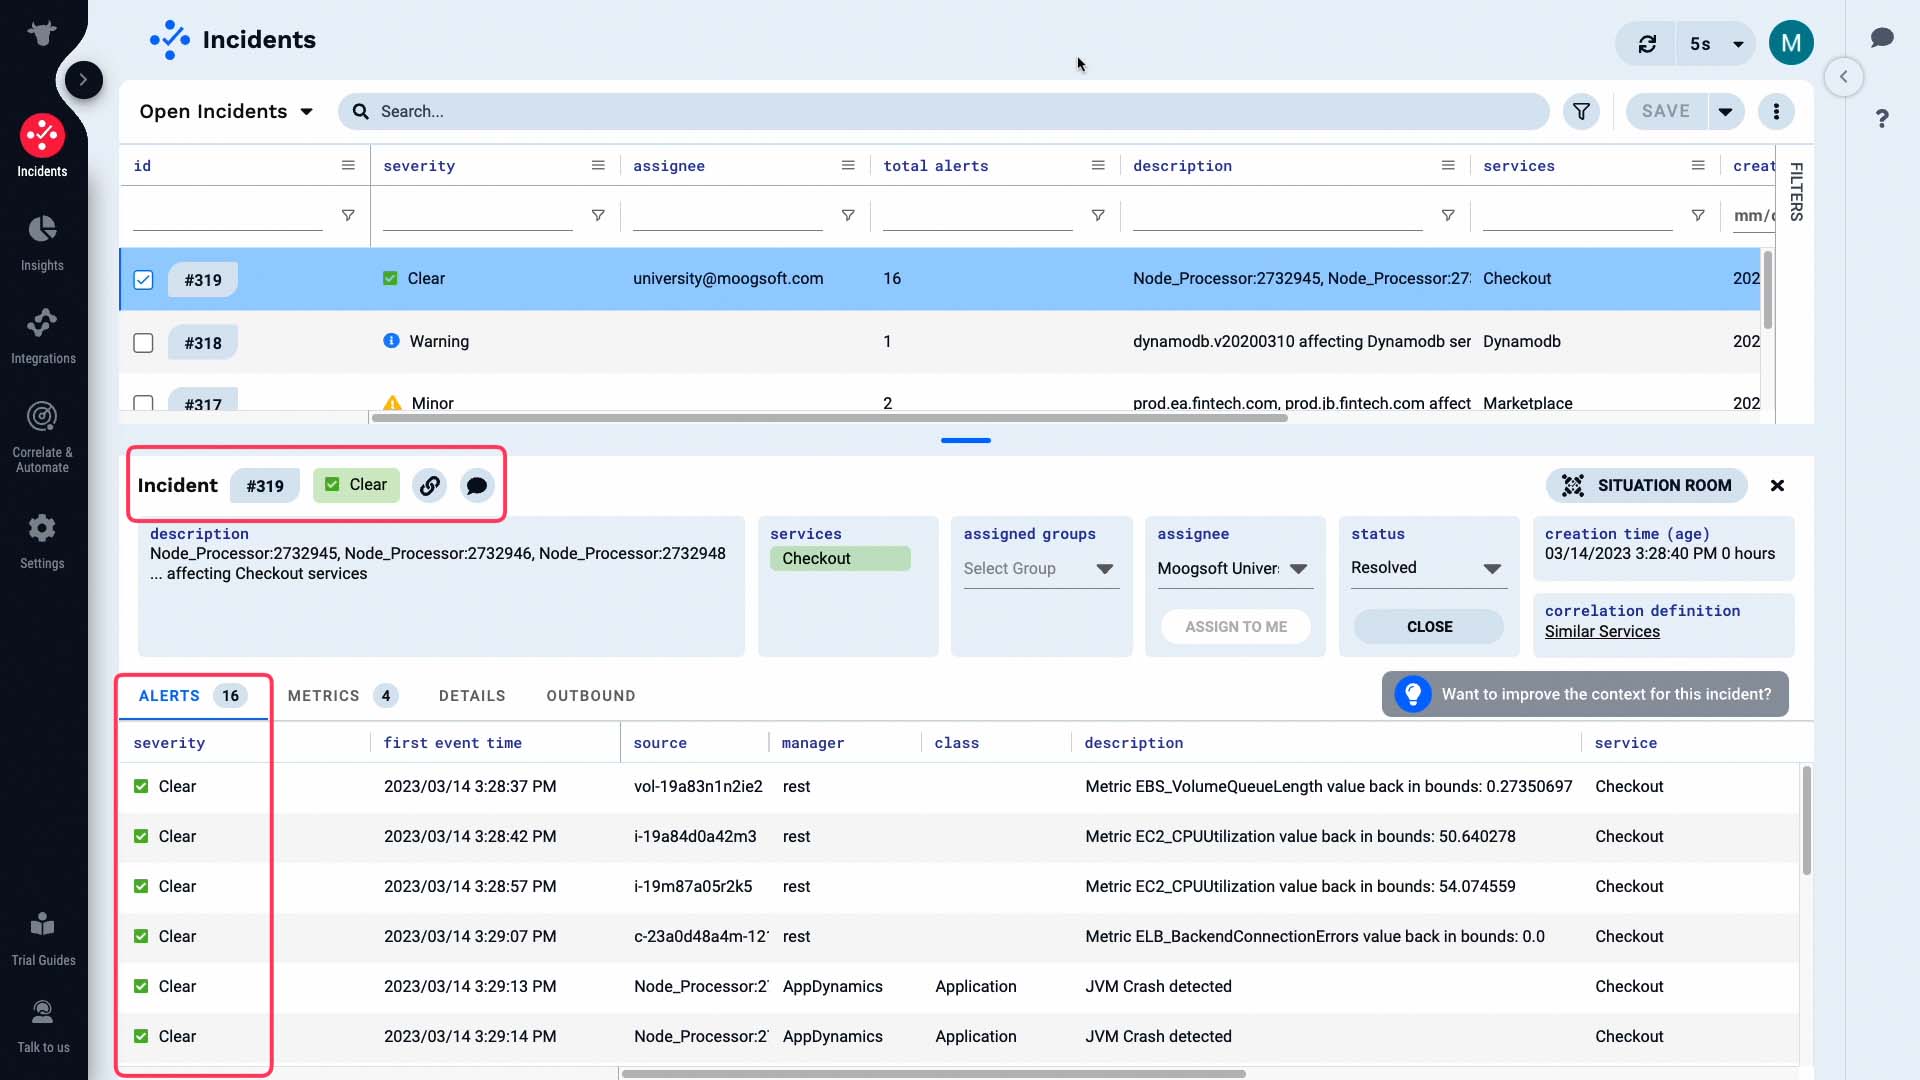
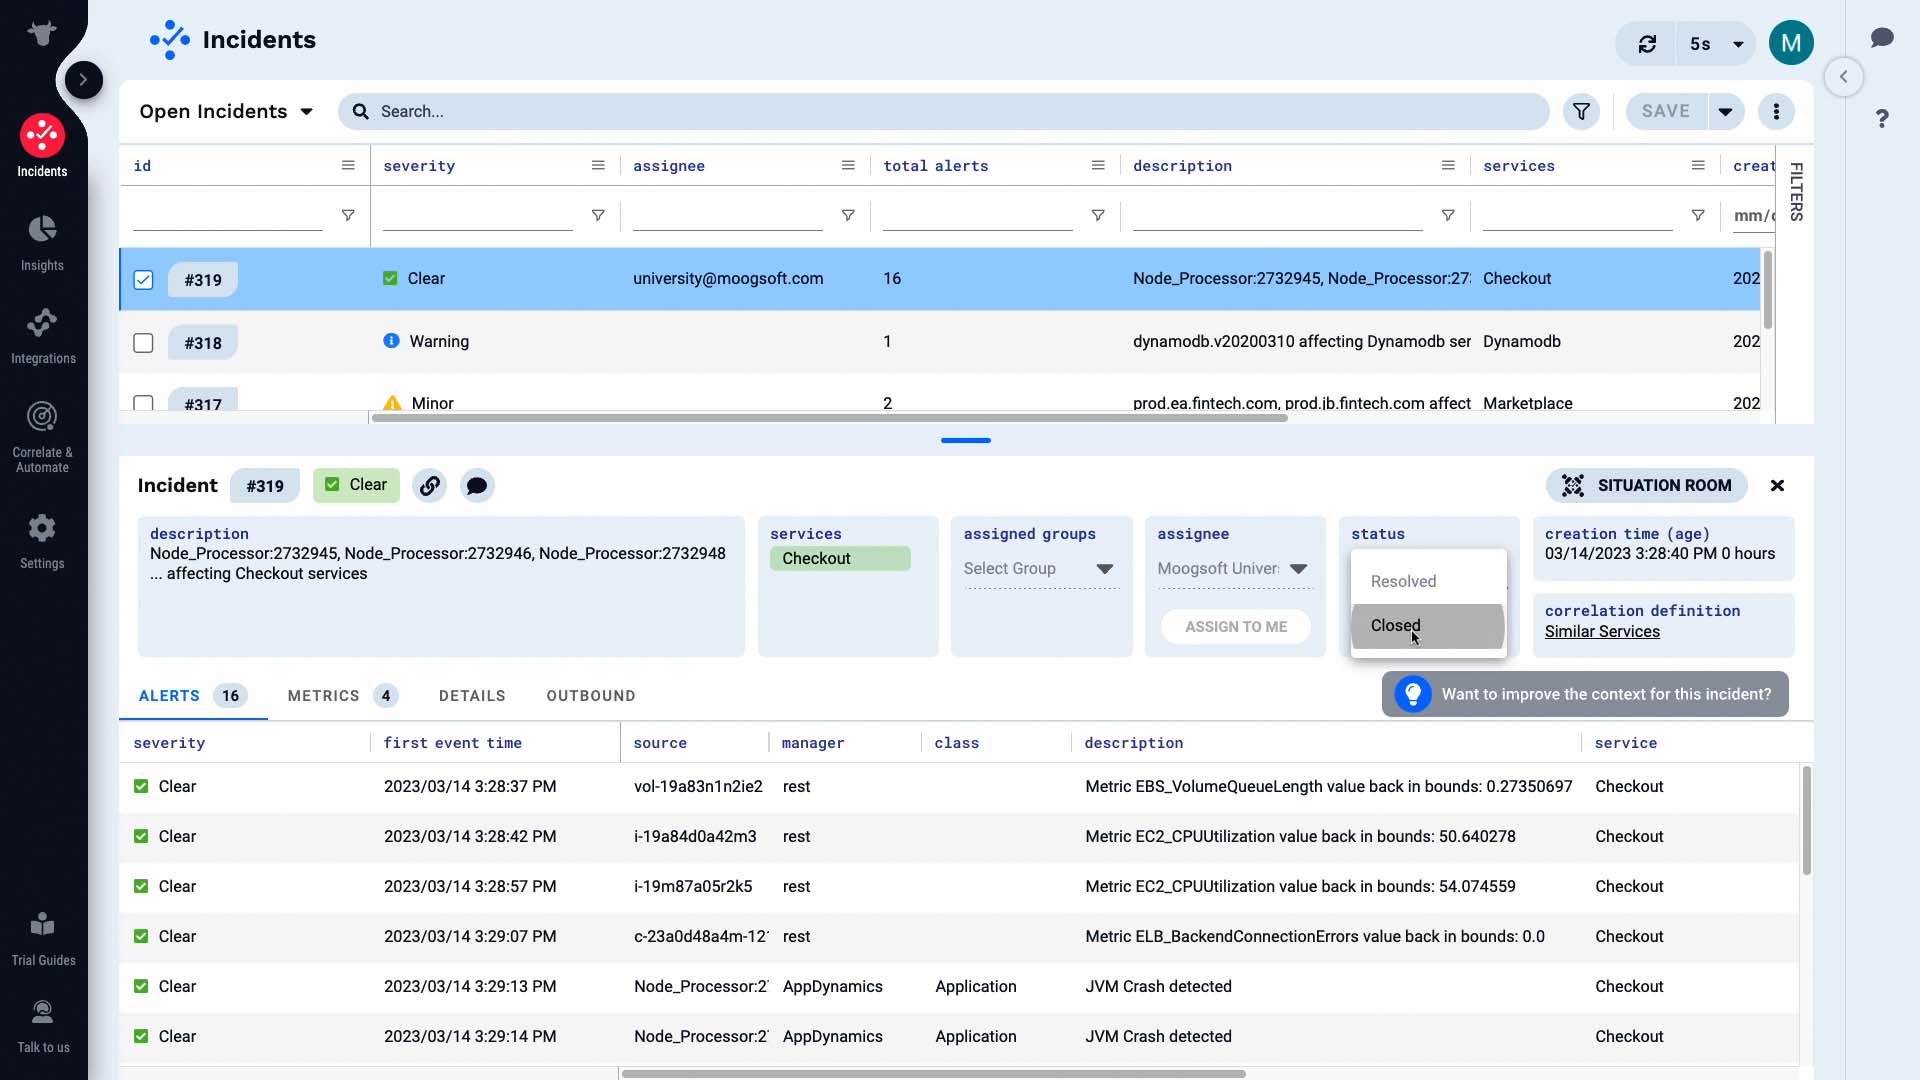
The incident status has been changed to resolved...
...and the case is closed!
Just like that, we have resolved our first incident in Moogsoft. Now it’s your turn to experience this workflow yourself!
Thanks for watching!