Key benefit discussion: Integrating Moogsoft Cloud with Datadog ►
Are you a Datadog user? And do you wish to optimize your workstream further? Then this video is for you! We recommend adding Moogsoft to your Datadog environment!
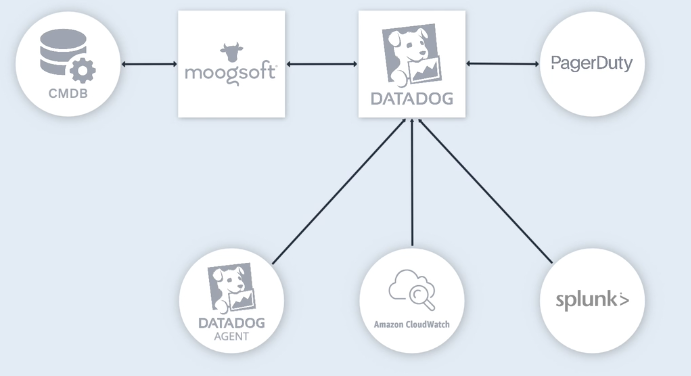
Let’s explore a sample use case to learn the key benefits. You are monitoring your application and infrastructure performance with Datadog, and maybe a few other tools… let’s say Cloudwatch and Splunk.
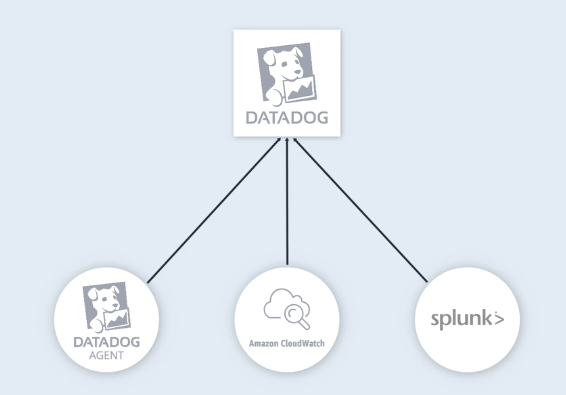
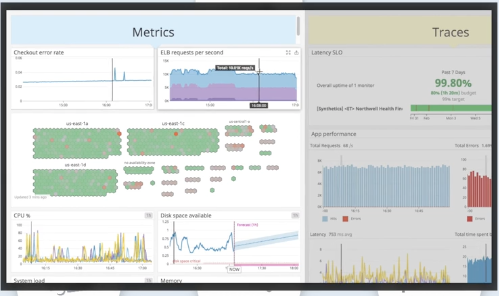
You analyze the data in Datadog using their strong visualization.
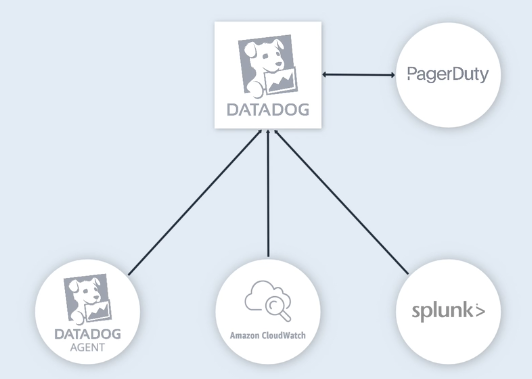
As you note anomalies, you may create incidents and collaborate with teams in Pagerduty.
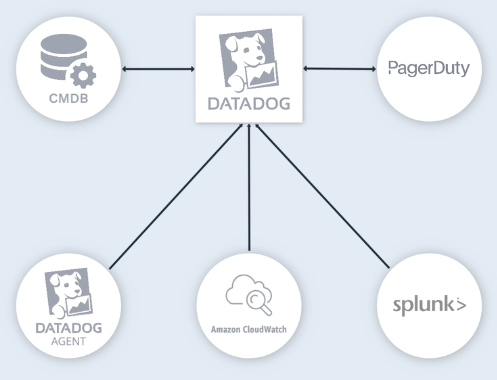
You might reference other tools such as a CMDB as needed during the issue investigation.
We are going to add Moogsoft to the mix. Your monitoring architecture looks like this after incorporating Moogsoft. The change is pretty minimum.
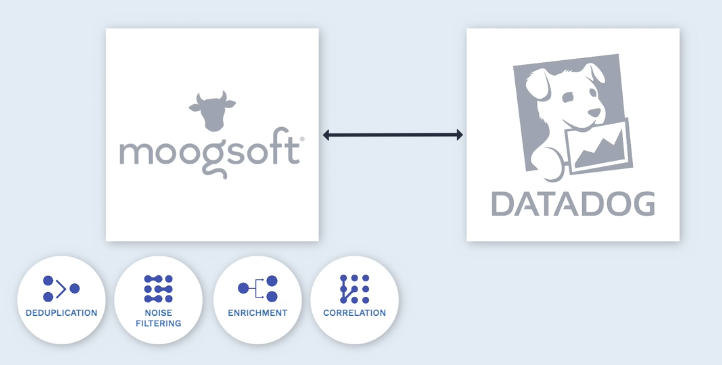
Now, the data that comes into Datadog is routed to Moogsoft. There, Moogsoft will handle the deduplication, noise filtering, enrichment, and correlation without any manual intervention, and produce incidents.
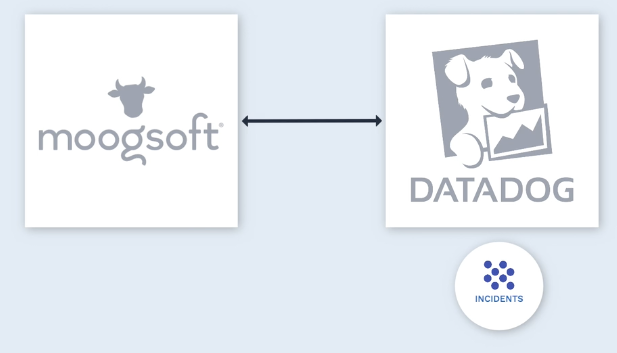
Then, the incidents are sent back to Datadog, and you can start your investigation skipping all the manual work.
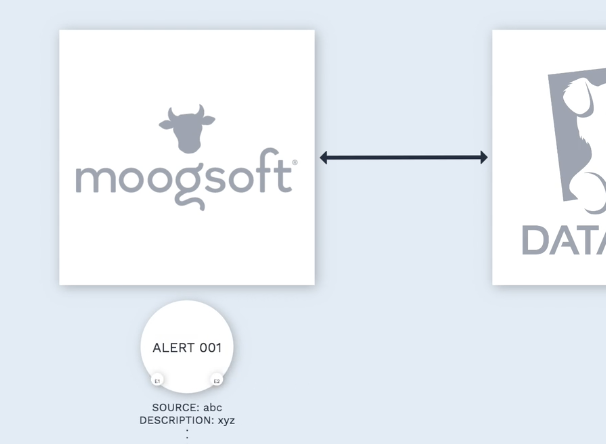
Let’s have a closer look at what happens here.
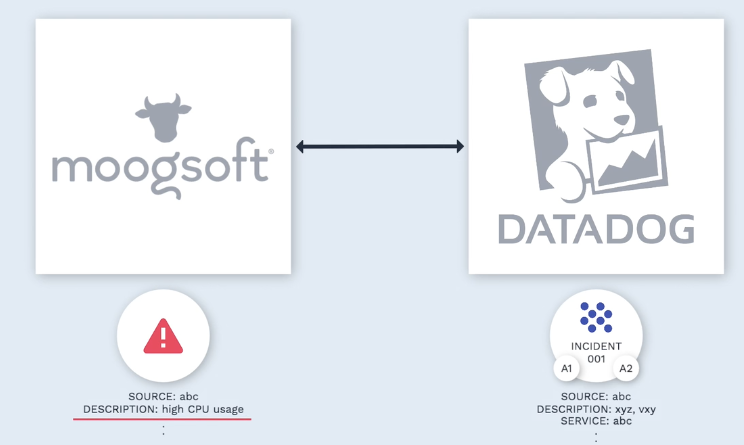
Here comes a warning event. Then, a critical event with the same set of attributes.
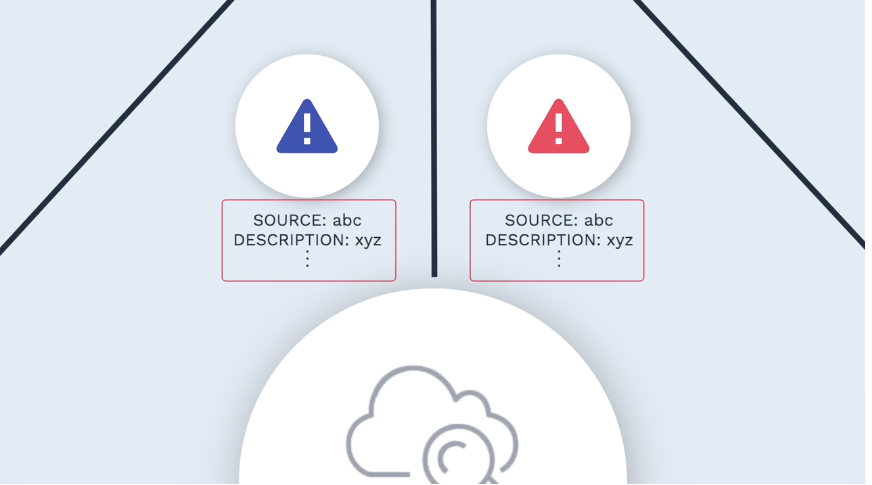
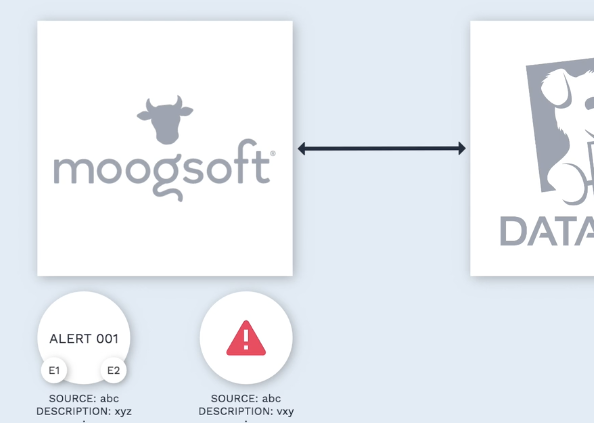
They are routed to Moogsoft as they come in, and there, they become one alert after the deduplication.
Here comes another event with a different description, but most attributes are overlapping. This should be looked at with the context of the other two events.
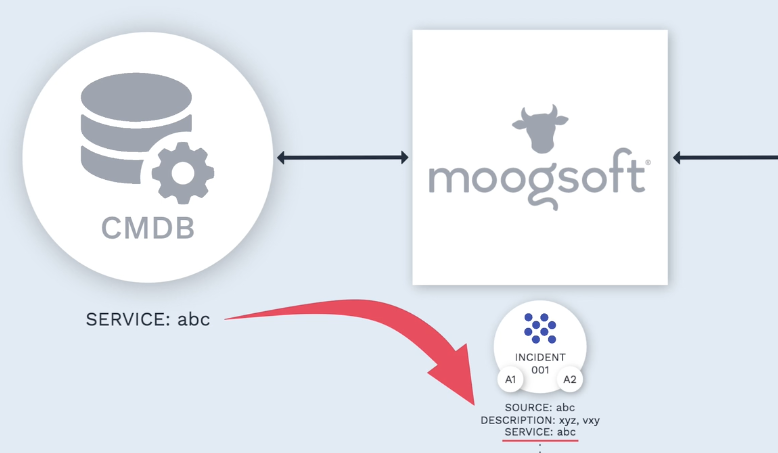
Moogsoft recognizes the shared attributes, and groups all three into an incident. Also, suppose you have been referencing a CMDB for the services information. Moogsoft can handle the lookup, and attach the service information for you.
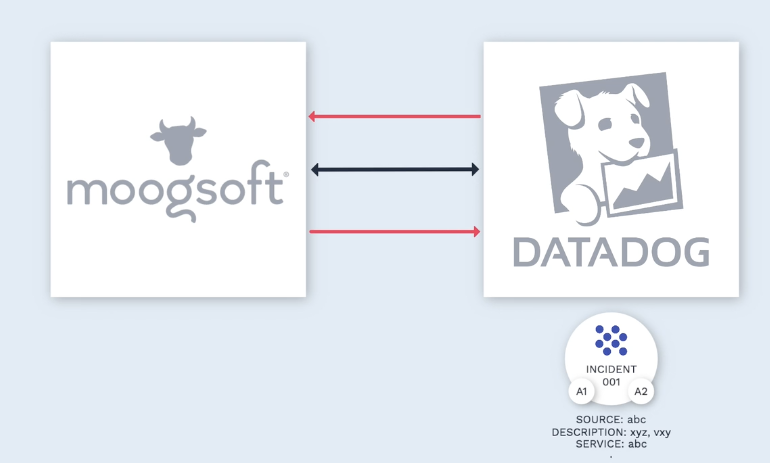
Now the incident- after deduplication, enrichment, and correlation gets sent back to Datadog. As you work on the incidents, you can reference back to Moogsoft, and take advantage of the information.
Meanwhile, here comes another event…Say it’s a “high CPU usage” alert.
However, suppose this alert gets triggered typically around this time of the day, and the overall performance of the application hasn’t been impacted.
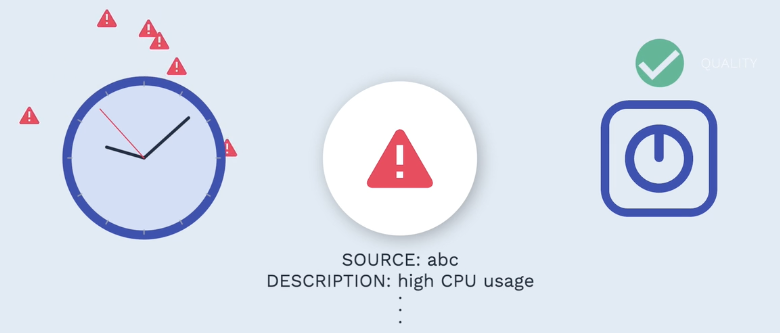
Moogsoft’s dynamic thresholding learns that and adjusts to the new norm, so it will filter out this event as noise. So the incidents you see in Datadog are only the important ones that require your attention.
Now you know the key benefits of adding Moogsoft to your Datadog environment. You can get a Moogsoft trial instance from the Datadog marketplace page. Try it out and thanks for watching!