Alert correlation example
This example illustrates how Moogsoft Cloud clusters alerts with just a few high-level bits of information from you.
You're a Moogsoft DevOps engineer responsible for setting up . You're using Amazon CloudWatch and Moogsoft collectors to monitor your infrastructure. You go to the Correlation editor and create a new correlation.
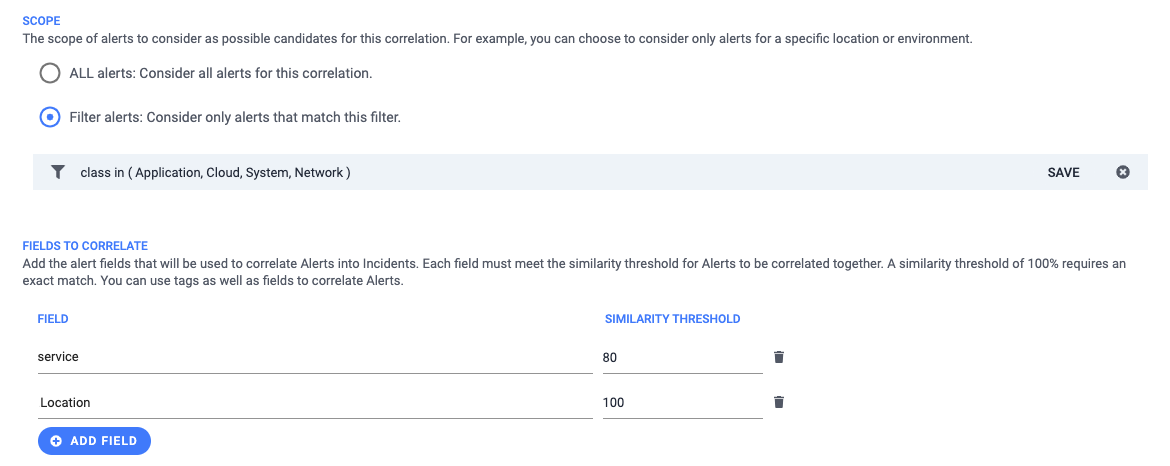
You want to cluster application, system, cloud, and network alerts for the same service in the same location. When prompted for the alert fields to correlate, you select the following:
servicefield, with 80% similarity. The 80% similarity helps cluster alerts with slight variations on the same service name.locationfield, with 100% similarity. You want to make sure that all the alerts in each incident are from the same location.
 |
You accept the defaults for the other options. You click Save and the correlation engine processes new alerts using your correlation:
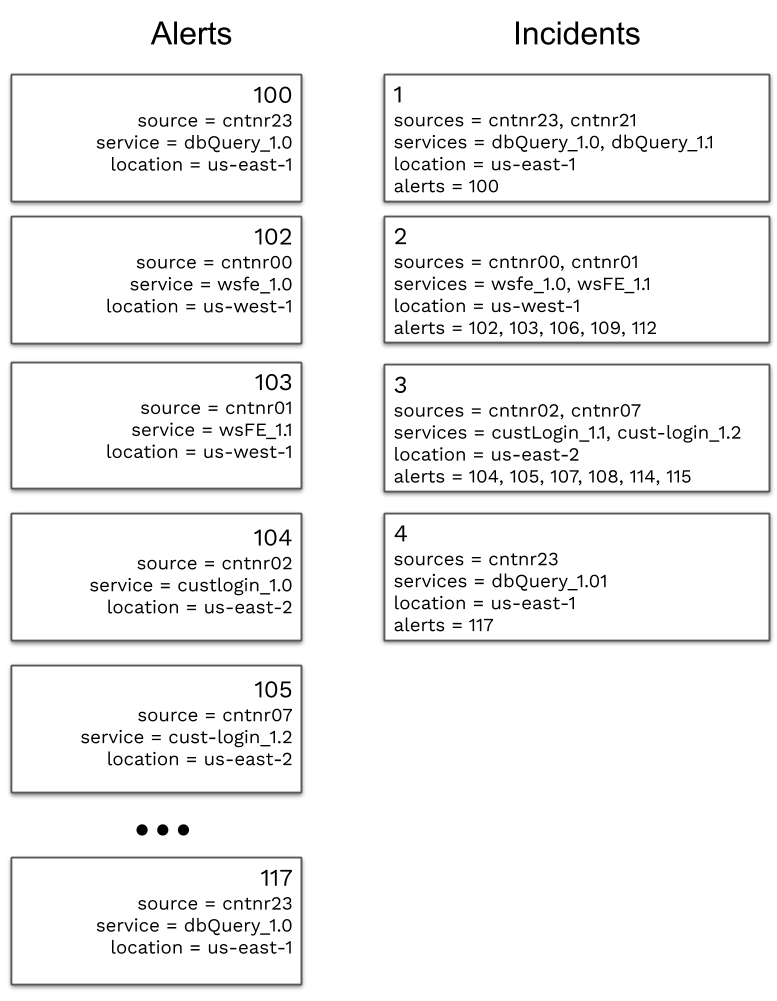
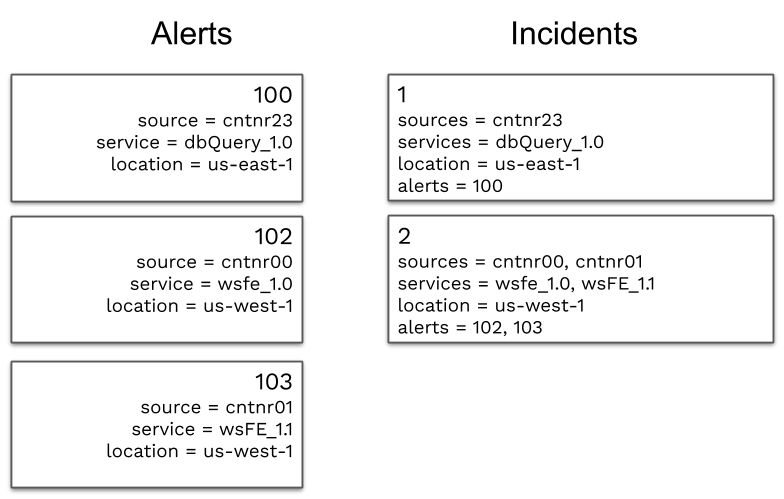
Amazon CloudWatch sends an alarm to the Events API: inbound network traffic is high on cntnr23.
The alarm passes through the enrichment and deduplication pipelines.
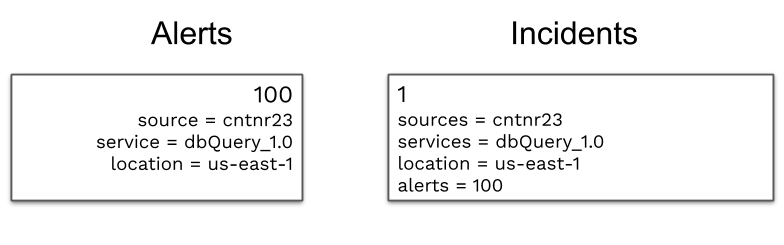
The alarm arrives at the correlation engine as Alert 100 with
class= Network,service= dbQuery_1.0, andlocation= us-east-1.Your correlation filter allows for
class= Network, so this is a candidate for correlation. The engine creates a new incident based on this alert. As yet there are no correlations with any other alerts.
Amazon CloudWatch flags an anomaly and sends it to the Events API: a spike in 4xx (bad requests) at a specific endpoint.
The anomaly passes through the pipeline and arrives at the correlation engine as Alert 101 with
class= API.The correlation scope does not include
class= API, so this alert is not a candidate for correlation.
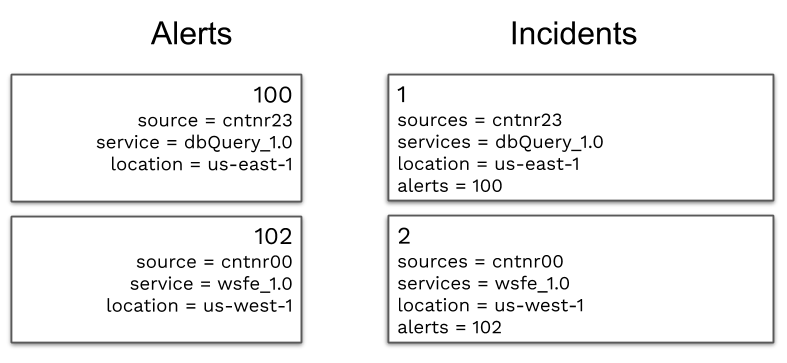
A Moogsoft collector flags an anomaly and sends it to the Metrics API: free memory is down on cntnr00.
The anomaly passes through the pipeline and arrives at the correlation engine as Alert 102 with
class= System,service= wsfe_1.0, andlocation= us-west-1.The alert passes your correlation filter, so the engine creates a new incident. Again there are no correlations based on your definitions.
The anomaly detector flags another anomaly in the collector metrics: HTTP response times are spiking on cntnr01.
The anomaly arrives at the correlation engine as Alert 103 with
class= Application,service= custLogin_1.0, andlocation= us-west-1.The engine finds that Alerts 102 and 103 are correlated based on your definition: Their services meet the 80% similarity threshold ( custLogin_1.0 and wife_1.1) and their locations are both us-west-1.
The engine adds Alert 103 to Incident 2.
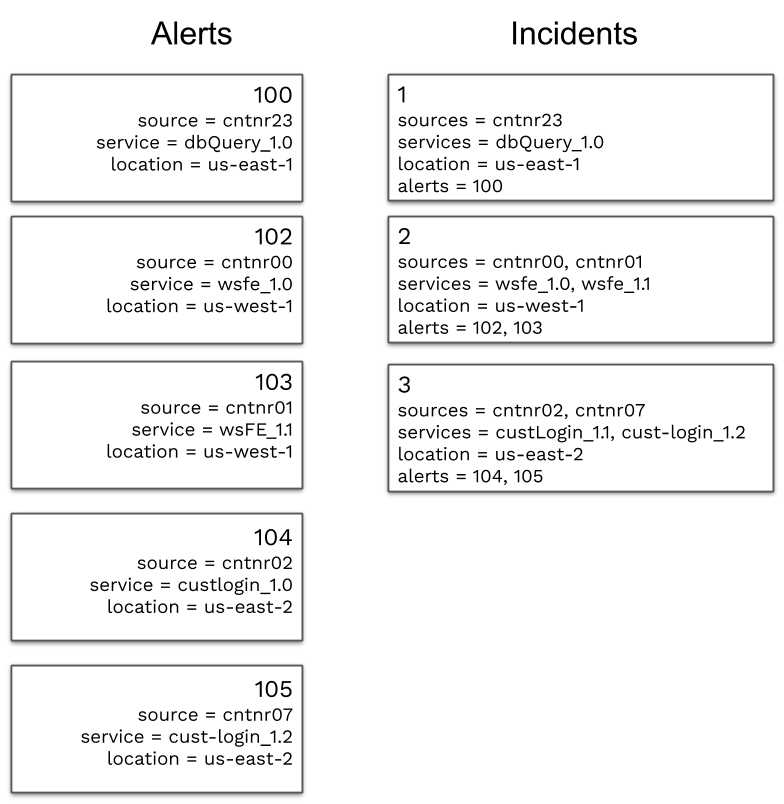
The anomaly detector flags two CloudWatch metrics for another container: CPU utilization and disk write operations are significantly down on containers running the customer-login service.
Alert 104 arrives with
class= Cloud,service= custLogin_1.1, andlocation= us-east-2.This alert passes the filter but does not correlate with any open alerts. The engine creates Incident 3 with alert 104.
Alert 105 arrives with
class= Cloud,service= cust-login_1.2, andlocation= us-east-2.The engine finds that alerts 104 and 105 are correlated based on their similar service names and identical locations. The engine adds alert 105 to incident 3.
An hour and a half goes by. Moogsoft ingests more alerts and adds them to incidents based on your correlation. Another alert arrives from CloudWatch, noting that network traffic is still high on cntnr23.
The alarm arrives at the correlation engine as Alert 117 with
class= Network,service= dbQuery_1.0, andlocation= us-east-1.This alert matches your correlation filter. It also meets the source and location similarities with Alert 100 in incident 1.
However, the correlation time window for incident 1 has expired. Each correlation has a configurable time window, which is set to 65 minutes by default.
The engine creates a new incident and adds alert 117 to it.